


LightningChart JSData Visualization with Ionic Capacitor, Angular & JS Charts (Part 1)
TutorialIonic capacitor is a mobile development framework for both iOS & Android applications
Written by a human | Updated on April 10th, 2025
Building mobile Ionic chart applications with Ionic Capacitor
This is the first part of the article “Data Visualization with Ionic Capacitor, Angular & JS Charts (Part 2)
I recently wrote an article about how to create an Android Studio charting application using LightningChart JS. But this time I wanted to write an extremely useful article for when one has to work with Android and iOS projects. To do so, we have 2 options… we either work with Android Studio and XCode or use a framework that helps us work on a single project and build an application for each platform.
The first option would be the best one for me but this would take more time and money. Therefore, the latter option has become a standard for mobile development. The great benefit of the second option is that we can build a website using frameworks like Angular and Vue.JS and build mobile apps from this project.
So, the first step in creating a mobile app with the help of the Ionic Capacitor framework is to have a compatible Angular project. For the content of this project, we will use the LightningChart JS (“lcjs”) library.
The entire project will be somewhat more complex than the previous article. For this reason, in this article, we will start with the Angular part and in the second part, we will work with Android and iOS. So, let’s start.
Project Overview: What is Ionic Capacitor?
Ionic is a framework that allows us to build mobile, web, and desktop applications. Using Ionic on a mobile device will allow us to access the device’s gestures, make use of the animations that the device allows and manipulate internal devices of the cell phone… such as cameras, fingerprint readers, microphones, etc.
On the other hand, Capacitor is a JS library that will allow us to make use of web interactions between the device and a server. Previously, Cordova was used, but it could be said that Cordova is an older version of Capacitor. Given this brief introduction, let’s start with our project.
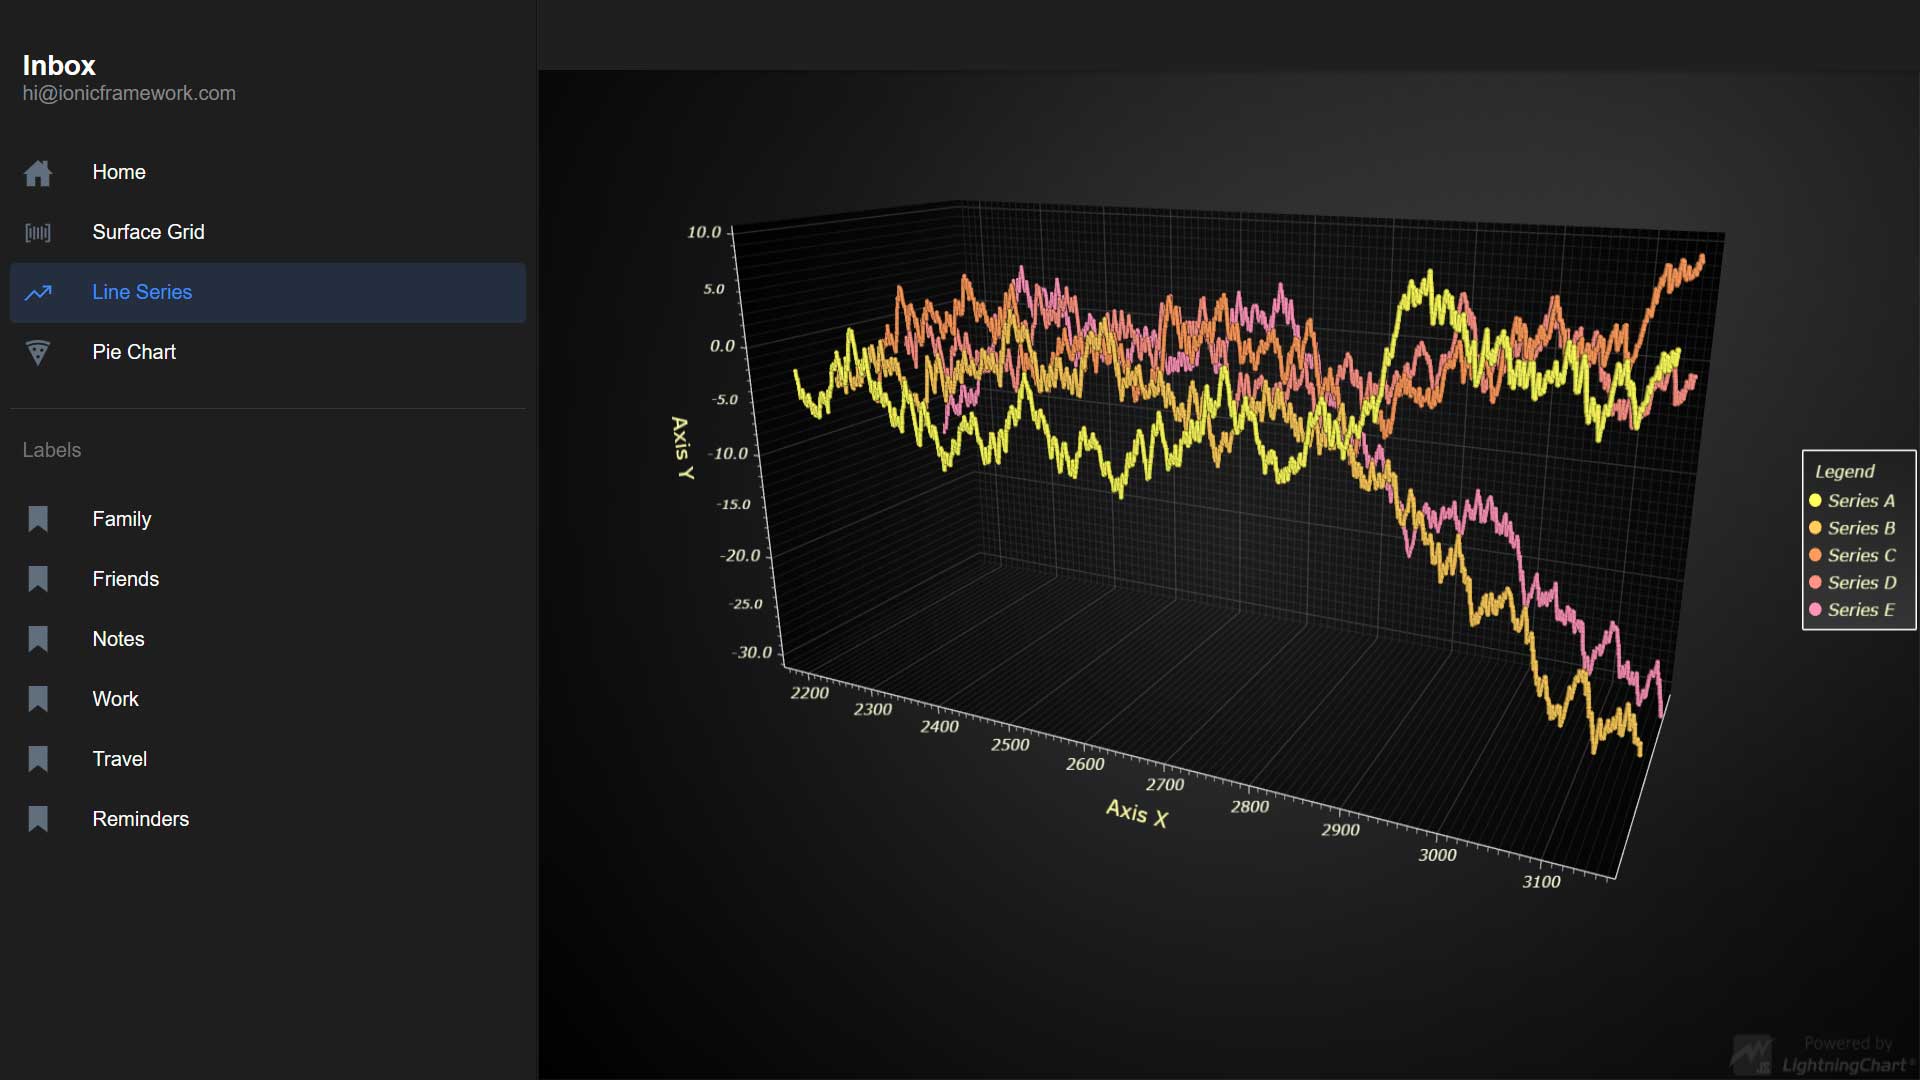
Take a quick look at the final Ionic Capacitor + Angular and JS charts application:
Please download the template to follow the project:
 Download the project to follow the tutorial
Local Setup
For Angular, we can run ng commands, but in this case, we need to build a mobile application from an Angular project… so we will go for another way. I recommend using the same names that I used, to avoid issues with references. Notice that if you only want to use the template of this article, you just need to run the npm install command.
1. Create the folder [LCIONICCAPACITOR]
Once you’ve created it, open it with visual studio code.
2. Open a new terminal and run the following command:
- Ionic start myApp sidemenu
- Ionic start will create a new project based on this framework and myApp would be the default name of the project. [sidemenu] will be the default template for our Angular project:

3. Select Angular as the main framework:

You will have to use the down/up arrow keys to select the option. By default, Angular is the first option in the list. After entering the Angular framework, the terminal will show a download process; wait until this process finishes.
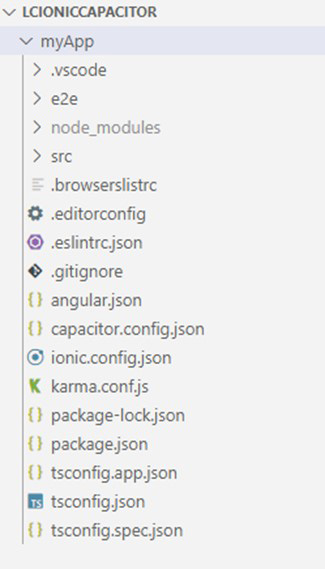
Your project will look like this:
4. Right-click on [myApp] root folder and select [open in integrated terminal].
5. Write and execute the command ionic serve:
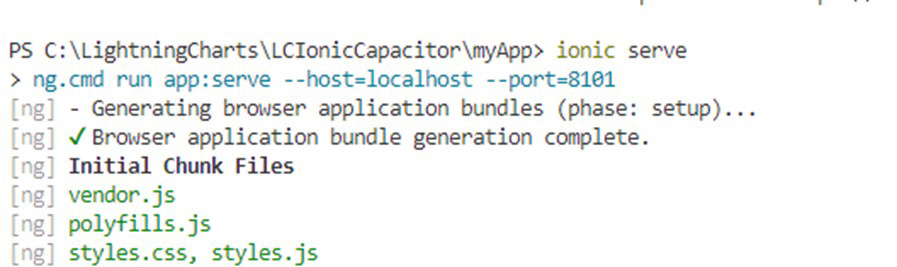
This command will compile and run the angular project on our local server. A new web explorer window will be opened automatically, if not, you can open your explorer and enter the local host path that was generated by ionic:
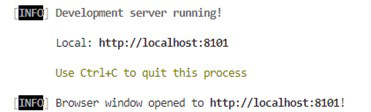
The application will look like this:
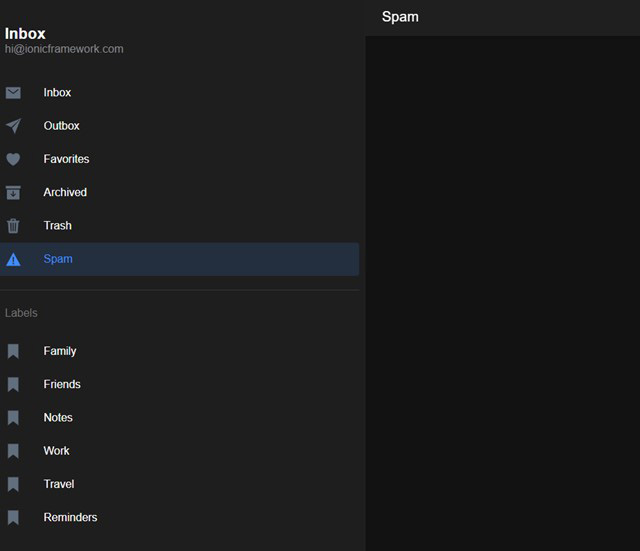
6. Terminating the process
Go to your terminal and terminate the current process. For this, type [Ctrl]+[c]:
[ng] Terminate batch job (Y/N)?7. Execute the following commands:
- npm i @arction/lcjs
- npm i @arction/xydata
With those commands, we will download the LightningChart JS library needed for our Angular project and that’s it. We already configured our project. As you can see, we didn’t use Angular commands as Ionic will be in charge of building and running the application. Remember to run the last commands on the [myApp] folder (step 4), otherwise, you will get an error message related to the Ionic project not found.
Angular
Before I get started with Angular, I’d like to give a brief introduction. If you haven’t worked with Angular, I highly recommend reviewing the Angular documentation.
In this project, you will see a pattern like a model view controller (MVC) but mostly related to the view. For example, in a classic MVC project, the model’s actions must pass through the controller to reach the view and vice versa. In this case, the view can modify the controller and the controller the view (MVVM).
Another important concept is the use of components:
- Components | Angular documentation:
- Components are the building blocks that make up an application. A component includes a TypeScript class with a @Component() decorator, an HTML template, and styles.
And before continuing with the code, we must understand a little bit about Dependency Injection:
- Dependency Injection | Angular documentation:
- Dependency injection lets you declare the dependencies of your TypeScript classes without taking care of their instantiation. Instead, Angular handles the instantiation for you. This design pattern lets you write more testable and flexible code.
- Understanding dependency injection is not critical to start using Angular, but it is strongly recommended as a best practice.
Code
We will work under the source folder (src). When we created the project, a “folder” was created. We will use all the items within as a template for our components.

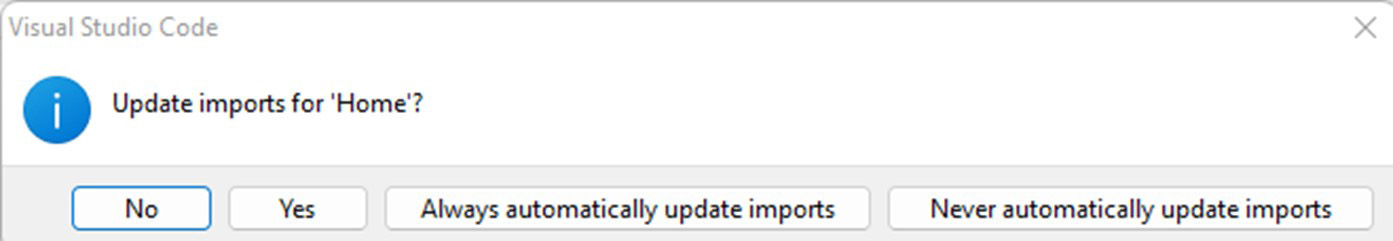
1. Rename “folder” as “Home”
After renaming the folder, you will see an alert like this, select [Yes].
2. Renaming files
Change the name of all files inside “Home”. Replace the word “folder” by “Home”. This is too “manual”, but I think is a good exercise to start identifying the files we must work on.

3. Replace folder name
Go inside each file and replace the word “folder” with “home”. You can use the replace tool by pressing [Ctrl] + [f]:

4. Continue renaming files
Repeat the same process for the rest of the files. When you replace it for the first time, you will see some files change the font to red, this is normal because the references have changed. In the end, all the files should not be in red, if not check the files and replace them correctly.
- Home-routing.module.ts
This file will say what view should be displayed. By default, we are assigning the [Home.page.html] file as our view for [Home]. The folder [Home] can work as a webpage.
import { NgModule } from '@angular/core';
import { Routes, RouterModule } from '@angular/router';

import { HomePage } from './Home.page';- Home.module.ts
In this file, we must specify all the import and NG modules that we need to use for [Home].
import { NgModule } from '@angular/core';
import { CommonModule } from '@angular/common';
import { FormsModule } from '@angular/forms';

import { IonicModule } from '@ionic/angular';

import { HomePageRoutingModule } from './Home-routing.module';

import { HomePage } from './Home.page';

@NgModule({
  imports: [
    CommonModule,
    FormsModule,
    IonicModule,
    HomePageRoutingModule
  ],
  declarations: [HomePage]
})
export class HomePageModule {}
When the project was created, ionic created the basic imports that we need to run forms, ionicModule, and routing. IonicModule is an NG module that bootstraps an ionic app.
- Home.page.html
This will be the view for the Home page. If you worked before with HTML, this would look very familiar. The main difference is that we need to use Ionic UI components, instead classic HTML tags. I recommend using these components to take advantage of ionic and have good compatibility with mobile devices. In case you need it, you can use HTML tags with style or event tags.
<ion-header [translucent]="true">
  <ion-toolbar>
    <ion-buttons slot="start">
      <ion-menu-button></ion-menu-button>
    </ion-buttons>
    <ion-title>{{ Home }}</ion-title>
  </ion-toolbar>
</ion-header>

<ion-content [fullscreen]="true">
  <iframe src="https://lightningchart.com/" style="width:100%; height: 100%;"></iframe>
</ion-content>
For example, for home, I’m using the iFrame HTML tag, to load and display the Lightning Chart website as the home content.
- Home.page.scss
This file will contain CSS classes, that we can use for the look and feel of our application. If you worked before with CSS, this would work as you expected. This scss file will be assigned to the Home view, so you will be able to use CSS classes in the HTML elements.
ion-menu-button {
  color: var(--ion-color-primary);
}

#container {
  text-align: center;
  position: absolute;
  left: 0;
  right: 0;
  top: 50%;
  transform: translateY(-50%);
}

#container strong {
  font-size: 20px;
  line-height: 26px;
}

#container p {
  font-size: 16px;
  line-height: 22px;
  color: #8c8c8c;
  margin: 0;
}

#container a {
  text-decoration: none;
}- Home.page.spec.ts
These files are created for each .ts file in our folder. This file can be used for unit testing, but for this moment we will skip this point.
- Home.page.ts
In this .ts file (type script), is where we can allocate all our logic to show a result in our view. Also, we can manipulate the view components. To have access to the view and styles, we must specify the template and style files. Also, we can import more components to make our code work, for example, we can import the LightningCharts JS libraries.
import { Component, OnInit, } from '@angular/core';
import { ActivatedRoute } from '@angular/router';
@Component({
  selector: 'app-Home',
  templateUrl: './Home.page.html',
  styleUrls: ['./Home.page.scss'],
})
export class HomePage implements OnInit {
  public Home: string;

  constructor(private activatedRoute: ActivatedRoute) { }

  ngOnInit() {
    this.Home = this.activatedRoute.snapshot.paramMap.get('id');
  }
}
Creating Charts
The [Home] page worked as another introduction to how angular constructs a component.
1. How to manipulate the view from the controller, and how to create a JS object and send this object to the view.
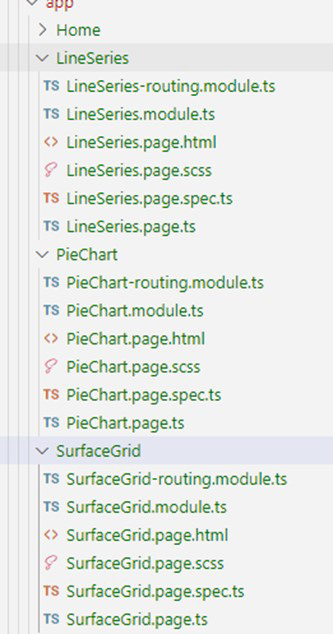
You have two options… copy the [Home] folder and replace “Home”, with the name of the charts we will work on (LineSeries, PieChart, SurfaceGrid), or copy and paste the folders from the template of this article.
2. The files tree should look like this:
3. HTML:
We must add a [ID] to our [ion-content]. The [ion-content] will work like a body tag. The chart will be displayed in the entire content, but at the first instance of the view, we will show a header. The [ID] property will help the controller to find the HTML object.
<ion-content [fullscreen]="true" [id]="this.charthtml">
  <ion-header collapse="condense">
    <ion-toolbar>
      <ion-title size="large">{{ SurfaceGrid }}</ion-title>
    </ion-toolbar>
  </ion-header>
  <button (click)="createChart()">Click Me!</button>
  <div id="container">
    <strong class="capitalize">{{ SurfaceGrid }}</strong>
    <p>Explore <a target="_blank" rel="noopener noreferrer" href="https://ionicframework.com/docs/components">UI Components</a></p>
  </div>
</ion-content>
The HTML button will execute the createChart() function. This function will create the chart object. As you can see, we can call javascript functions as a normal web page with embedded JavaScript.
4. LineSeries.page.ts
To make this work, we must import some components:
import { Component, ElementRef, OnInit, ViewChild } from '@angular/core';
import { ActivatedRoute } from '@angular/router';
import { lightningChart, AxisTickStrategies, AxisScrollStrategies,Themes } from '@arction/lcjs';
import { createProgressiveTraceGenerator } from '@arction/xydata';
The component will help us to join the HTML and SCSS files to this TypeScript file:
@Component({
  selector: 'app-LineSeries',
  templateUrl: './LineSeries.page.html',
  styleUrls: ['./LineSeries.page.scss'],
})
ElementRef will help us to manipulate a DOM element from here. ViewChild will help us to query a view and get and specific DOM element.
@ViewChild('charthtml') charthtml !: ElementRef;For external libraries, we must import them as components. In this case, we are importing the required classes from LC JS.
import { lightningChart, AxisTickStrategies, AxisScrollStrategies,Themes } from '@arction/lcjs';
import { createProgressiveTraceGenerator } from '@arction/xydata';
5. createChart():
This function will create the chart object and will be exported to the ion-content object in the view.
6. Creating the chart object
This chart works with the Chart3D type. The container will help us to display the chart inside the frame we want. In this case the ion-content (ID: this.charthtml). We can specify some properties like the theme (look and feel), animations, title, etc.
const chart3D = lightningChart().Chart3D({
    container: `${this.charthtml}`,
      disableAnimations: true,
      theme: Themes.darkGold,
  })
      // Set 3D bounding box dimensions to highlight X Axis.
      .setBoundingBox({ x: 1.0, y: 0.5, z: 0.4 })
.setTitle('3D Realtime Line Series')- For 3D charts, we can work with 3 axes (x,y,z).
We can add properties by using the getDefaultAxis function. The axis Z will work as a visual perspective, so we just need to get focus on axes x and y.
chart3D.getDefaultAxisX().setTitle('Axis X')
  chart3D.getDefaultAxisY().setTitle('Axis Y')
  chart3D.getDefaultAxisZ().setTitle('')
7. Defining Series configuration for simplified example modification.
const seriesConf = [
      {
          name: 'Series A',
          z: 0
      },
      {
          name: 'Series B',
          z: 0
      },
      {
          name: 'Series C',
          z: 0
      },
      {
          name: 'Series D',
          z: 0
      },
      {
          name: 'Series E',
          z: 0
      },
  ]
8. Defining the intervals for axes x and y:
// Configure Progressive X Axis.
  chart3D.getDefaultAxisX().setInterval(-1000, 0).setScrollStrategy(AxisScrollStrategies.progressive)

  // Set Z Axis interval immediately.
  chart3D.getDefaultAxisZ().setInterval(-1, 1+seriesConf.reduce((prev, cur, i) => Math.max(prev, i), 0), false, true)
9. Indefinite loop
For each Serie in the seriesConf array, we will create an indefinite loop. The Z axis is just a visual perspective, so the value can be zero. For each cycle, the iSeries value will be updated and the Serie will be added to the chart.
seriesConf.map((conf, iSeries) => {
          const seriesName = conf.name || ''
          const seriesZ = conf.z || iSeries

          const series = chart3D.addLineSeries()
              .setName(seriesName)
10. Static datasets
Generate a static YZ dataset for this series that repeats indefinitely along the X plane. Repeat the dataset so that it can be repeated indefinitely.
return createProgressiveTraceGenerator()
              .setNumberOfPoints(seriesUniqueDataAmount / 2)
              .generate()
              .toPromise()
              .then((data) => {
                  // Map XY data to YZ data.
                  return data.map((xy) => ({
                      y: xy.y,
                      z: seriesZ
                  }))
              })
              .then((data) => {
                  // Repeat data set so that it can be looped indefinitely.
                  return {
                      series,
                      data: data.concat(data.slice(1, -1).reverse()),
                      currentData: []
                  }
              })
      })
11. Adding LegendBox to the chart (after series were created).
.setAutoDispose: Dispose of the example UI elements automatically if they take up too much space.
).then(( seriesAndData ) => {
      // Add LegendBox to chart (after series were created).
      const legend = chart3D.addLegendBox()
          // Dispose example UI elements automatically if they take too much space. This is to avoid bad UI on mobile / etc. devices.
          .setAutoDispose({
              type: 'max-width',
              maxWidth: 0.20,
          })
          .add(chart3D)
12. Setup streaming to all series.
let tStart = Date.now()
      let dataAmount = 0
      let xPos = 0
13. Keep track of data currently in each series.
const pushNewData = () => {
          for ( let iNewPoint = 0; iNewPoint < pointsPerFrame; iNewPoint ++ ) {
              for ( const { series, data, currentData } of seriesAndData ) {
                  // Pick YZ coordinates from data set.
                  const yz = data[xPos % data.length]
                  const point = {
                      x: xPos,
                      y: yz.y,
                      z: yz.z
                  }
                  series.add(point)
                  currentData.push(point)
                  dataAmount ++
              }
              xPos ++
          }
          // Schedule next batch of data.
          requestAnimationFrame(pushNewData)
      }
      pushNewData()
14. Schedule cleaning of old data
const checkCleanupOldData = () => {
          const minPointsToKeep = 1000
          for ( let i = 0; i < seriesAndData.length; i ++ ) {
              const { series, data, currentData } = seriesAndData[i]
              if (currentData.length < minPointsToKeep)
                  continue
              const spliceStart = currentData.length - minPointsToKeep
              const spliceCount = Math.min(minPointsToKeep, currentData.length - spliceStart)
              const pointsToKeep = currentData.splice(spliceStart, spliceCount)
              series.clear().add(pointsToKeep)
              seriesAndData[i].currentData = pointsToKeep
          }
      }
      setInterval(checkCleanupOldData, 1000)
15. Display the incoming points amount in the Chart title.
- updateChartTitle: calculate the number of incoming points / second.
- In case the page is frozen, the counter will be reset every 5000 milliseconds.
const title = chart3D.getTitle()
      let lastReset = Date.now()
      const updateChartTitle = () => {

          if (dataAmount > 0 && Date.now() - tStart > 0) {
              const pps = (1000 * dataAmount) / (Date.now() - tStart)
              chart3D.setTitle(`${title} (${Math.round(pps)} data points / s)`)
          }

          if (Date.now() - lastReset >= 5000) {
              tStart = lastReset = Date.now()
              dataAmount = 0
          }
      }
      setInterval(updateChartTitle, 1000)
About other charts, there are specific articles created for creating a JavaScript pie chart and the surface grid map chart, so I recommend checking them out for a more detailed explanation.
Routing
The last part of this project is to set up the routing for each page. When we created the project, the routing module was created and ready to work with our side menu. If we go to the [app.component.ts] file, you can add or remove options from the menu:
import { Component } from '@angular/core';
@Component({
  selector: 'app-root',
  templateUrl: 'app.component.html',
  styleUrls: ['app.component.scss'],
})
export class AppComponent {
  public appPages = [
    { title: 'Home', url: '/Home/Home', icon: 'home' },
    { title: 'Surface Grid', url: '/SurfaceGrid/SurfaceGrid', icon: 'barcode' },
    { title: 'Line Series', url: '/LineSeries/LineSeries', icon: 'trending-up' },
    { title: 'Pie Chart', url: '/PieChart/PieChart', icon: 'pizza' },
  ];
  public labels = ['Family', 'Friends', 'Notes', 'Work', 'Travel', 'Reminders'];
  constructor() {}
}
The title will be the text shown in the option. The URL will point to the module file inside the page folder. In the [app-routing.module.ts] we need to specify the module path for each page folder. In this way, the module will be loaded when we click on its option.
const routes: Routes = [
  {
    path: '',
    redirectTo: 'LineSeries/LineSeries',
    pathMatch: 'full'
  },
  {
    path: 'Home/:id',
    loadChildren: () => import('./Home/Home.module').then( m => m.HomePageModule)
  },
  {
    path: 'LineSeries/:id',
    loadChildren: () => import('./LineSeries/LineSeries.module').then( m => m.LineSeriesPageModule)
  },
  {
    path: 'SurfaceGrid/:id',
    loadChildren: () => import('./SurfaceGrid/SurfaceGrid.module').then( m => m.SurfaceGridPageModule)
  },
  {
    path: 'PieChart/:id',
    loadChildren: () => import('./PieChart/PieChart.module').then( m => m.PieChartPageModule)
  }
];
Running the app
If you remember well, we just need to open a terminal under the [myApp] folder and run the command ionic-serve.
PS C:\LightningCharts\LCIonicCapacitor\myApp> ionic serve> ng.cmd run app:serve --host=localhost --port=8101This folder will compile and execute the project in your local machine:

Here’s the Ionic Capacitor + Angular charting application
2nd part of the Ionic Capacitor mobile charting application tutorial
In the second part of the Ionic Capacitor mobile application article, you’ll learn how to complete the mobile application for both Android and iOS devices with a great-looking UI ready to be presented, e.g., as a PoC for any client.
The application will feature LightningChart JS scientific charts and of course, you can add any charts needed. To see all the available charts, visit our interactive examples. See you in the second part of this article!

Omar Urbano
Software Engineer
Continue learning with LightningChart

Elliott Wave Theory in Trading
Financial markets often appear chaotic, but many traders believe that price movements follow recurring patterns driven by human psychology. One of the most influential approaches based on this idea is the Elliott Wave Theory. Developed nearly a century ago, it remains one of the most widely studied methods of technical analysis.

The Head and Shoulders Pattern in Technical Analysis
The Head and Shoulders Pattern in Technical Analysis The Head and Shoulders Pattern in Technical Analysis The Head and Shoulders pattern is one of the most recognized and widely used chart patterns in technical analysis. It is considered a reliable reversal pattern...

Best Telerik Charts Alternative in 2026: GPU Performance for WPF, WinForms, and Web
Telerik from Progress is a comprehensive UI component suite covering WPF, WinForms, ASP.NET, Blazor, and JavaScript. The charting components: RadChartView for WPF and WinForms, and Kendo UI Charts for web and Blazor, arrive bundled with the suite purchase. For teams...


If you have any questions, feel free to contact us!
©LightningChart Ltd 2026. All rights reserved.