Every WebSocket tutorial on the internet shows the same thing: a server sends a random number every second, a chart...


Regional Account & Marketing Executive (China, Japan and South Korea)
+358 503 543 706
Book a meeting
Regional Account Manager (North America, South America)
+358 505 528 995
Book a meetingOur dedicated sales team is ready to help you find the perfect solution for your data visualization needs. Don't hesitate to reach out for personalized assistance or to schedule a demo of our products.

Regional Account & Marketing Executive (China, Japan and South Korea)
+358 503 543 706
Book a meetingRegional Account Manager (North America, South America)
+358 505 528 995
Book a meetingOur dedicated sales team is ready to help you find the perfect solution for your data visualization needs. Don't hesitate to reach out for personalized assistance or to schedule a demo of our products.


Every WebSocket tutorial on the internet shows the same thing: a server sends a random number every second, a chart...
ScottPlot is genuinely excellent for what it is: a free, MIT-licensed, actively developed .NET plotting library with...
Using Fibonacci Tools in Trading: A Practical Guide for Market AnalysisTechnical traders rely on various tools to...
The data visualization market in 2026 is highly fragmented, yet in mission-critical sectors, one name consistently...
IntroductionAs per our standards at LightningChart Ltd., we have always maintained publicly available performance...

IntroductionThe swing index indicator is a technical analysis tool developed by Welles Wilder to help traders detect...

IntroductionThe Supertrend indicator is a powerful and simple tool used in technical analysis to identify the...

IntroductionThe Schaff Trend Cycle is a momentum oscillator designed to respond faster than traditional trend...
IntroductionThe Range Action Verification Index (RAVI) is a lesser-known yet practical technical analysis indicator...
IntroductionThe Random Walk Index (RWI) is a technical analysis tool that evaluates whether a financial instrument is...
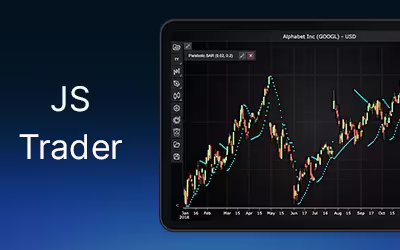
IntroductionThe Parabolic Stop and Reverse (Parabolic SAR) indicator is a widely used tool in technical analysis....
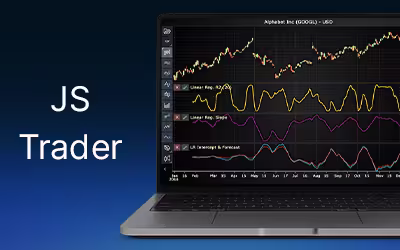
IntroductionLinear regression is a statistical method that fits a trendline to a dataset by minimizing the sum of...