


Blog

Swing index indicator: formula and implementation with LC JS Trader
Learn the Swing Index indicator formula and implementation with LightningChart JS Trader to detect trend direction and refine trading signals.

How to use the Supertrend indicator for Fintech app development
Learn about the Supertrend indicator in fintech app development to generate clear buy and sell signals, optimize ATR settings, and enhance trading strategies.

Using the Schaff Trend Cycle Indicator for Fintech App Development
Learn how the Schaff Trend Cycle combines MACD and stochastic logic to deliver faster, smoother momentum signals for fintech trading applications.
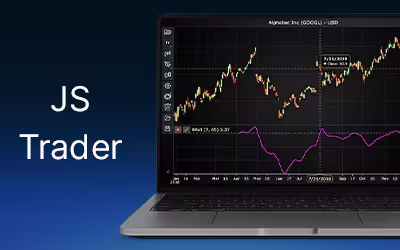
Using the Range Action Verification Index (RAVI)
Discover how the Range Action Verification Index (RAVI) helps fintech apps detect trending vs range-bound markets using moving average divergence.
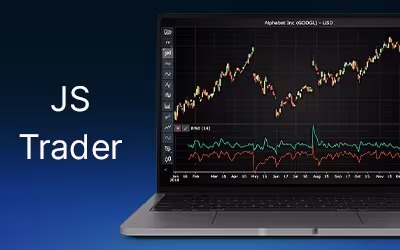
Random Walk Index Indicator for Fintech App Development
Discover how the Random Walk Index helps fintech apps detect true market trends, filter noise, and deliver smarter trading insights in real time.
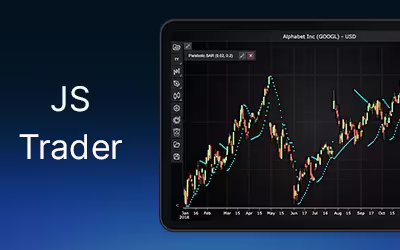
Creating a Parabolic Stop and Reverse Indicator for Fintech Applications
Build a Parabolic Stop and Reverse Indicator for fintech apps to detect trend direction, spot reversals, and improve trading strategy accuracy.
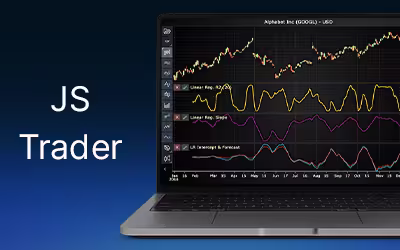
Linear Regression in Finance Application Development
Explore how linear regression in finance supports trend analysis, forecasting, and data modelling in application development with key metrics like slope and R².
Using the Gopalakrishnan Range index for Fintech App Development
Discover how the Gopalakrishnan Range index measures volatility using logarithmic price ranges and enhances fintech app analytics and trading strategies.
Using Average Directional Index for Fintech App Development
Learn how the Average Directional Index measures trend strength, confirms signals, and improves trading strategies with ADX and DI indicators.
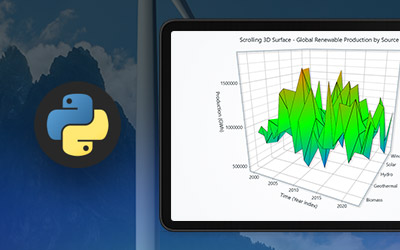
Global Renewable Energy Indicators
Explore how to visualize global renewable energy indicators effectively with LightningChart Python for insightful data representation.


If you have any questions, feel free to contact us!
©LightningChart Ltd 2026. All rights reserved.