


JavaScript Data Visualization5 Best JavaScript Charting Libraries
ArticleAn in-depth comparison of the most popular JS charting libraries
Written by a human | Updated on April 9th, 2025
Reviewing 5 of the most popular JS charting libraries
In all my previous articles I have been working with LightningChart for JS and .NET. However, in my experience, I have worked with other libraries related to creating charts and displaying a large size of data points.
So, for this article, I would like to review and compare what are the best JavaScript charting libraries. I will review documentation, scope, technical information, and pricing plus the features included. The libraries to review are:
LightningChart JS

As we know, LightningChart is an advanced library that allows us to work with JavaScript (LC JS) and C# (LC .NET). In the case of LightningChart .NET, we can render 3D images and process up to 1 trillion data points using the DigitalLineSeries line series.
But in this article, I’ll focus entirely on reviewing the JavaScript version and we will extend reviewing LightningChart for mobile devices.
In my experience working with LightningChart JS, I noticed a significant focus on high performance.
LightningChart JS is a library that prioritizes processing heavy data loads at extremely high-performance benchmarks that are especially related to scientific purposes.
Another great point that I noticed is the great versatility that LightningChart JS has when working with other frameworks. For instance, LightningChart JS supports 10+ data visualization frameworks including iOS, Android, Blazor, MAUI, React, and many more.
Recently, I had the chance to write a tutorial on using the LC JS library to create a desktop electrocardiogram application with Electron JS.
This is an easy-to-follow tutorial that expands the possibilities of what you can create in the popular JavaScript language while easily transposing it to a desktop application thanks to Electron JS.
But LightningChart JS also stays up to date. Soon, you’ll see a new article I have also been working on: a QUASAR JS data visualization template.
There are more articles available that will help you start using LightningChart JS with its free community version together with popular languages and environments such as TypeScript and NodeJS.
As another experience, I was able to work with binary data, which means that we can implement physical modules with sensors. This helps to transform and display the results with LightningChart (also use frameworks like Electron JS and display everything as a desktop application).
Recommended article: Using LightningChart, Node JS, and Typescript to create a multi-direction JS dashboard.
Documentation
When talking about documentation, LightningChart (lc js) provides complete API documentation, explaining all the Classes, Enums, Interfaces, functions, and objects included in the JS libraries. You can visit the documentation here.
Technical documentation is also complemented by real-industry examples, tutorials, theoretical explanations about how/when/why to use a specific chart, and general knowledge about the industries that implement them.
You can visit the LightningChart articles with some examples, to learn how to implement different types of charts.

Scope
As I said before, we can implement LightningChart in many applications, we can use LC JS with modern Angular, TypeScript, and mobile applications, or also we can use it on C# / Java web applications.
If you’re interested in .NET development: For C#, LC .NET provides a framework entirely focused on this language. The C# framework lets us create a basic template (WPF, WINFORMS) ready to work in our visual studio to modify the code and the source data.
Technical Information
As I mentioned before, LightningChart JS (and also .NET) is a high-performance oriented charting library, which means no basic HTML5 charts or low-end graphics.
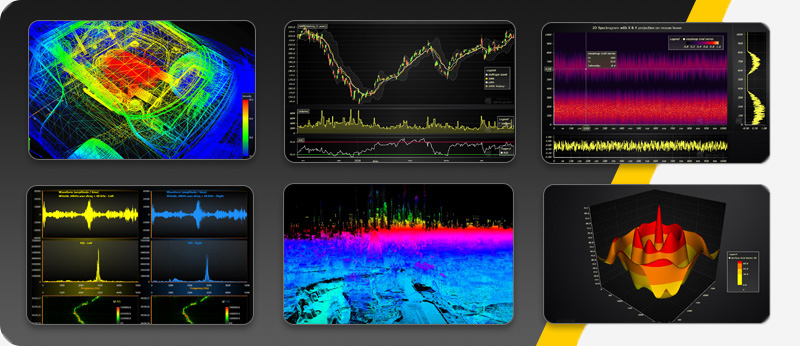
LightningChart JS features more than 100 chart types for industries including trading, medical, statistics, business, finance, and geographical. Other chart types are surface charts, heat maps, line charts, 3D charts, etc.
Data Limits
When referring to performance, LightningChart JS has limitations as other libraries also have but these limitations exceed what’s in the market right now (and what I’ve been able to see in my career as a software engineer). For instance, different chart types have different performance ranges.
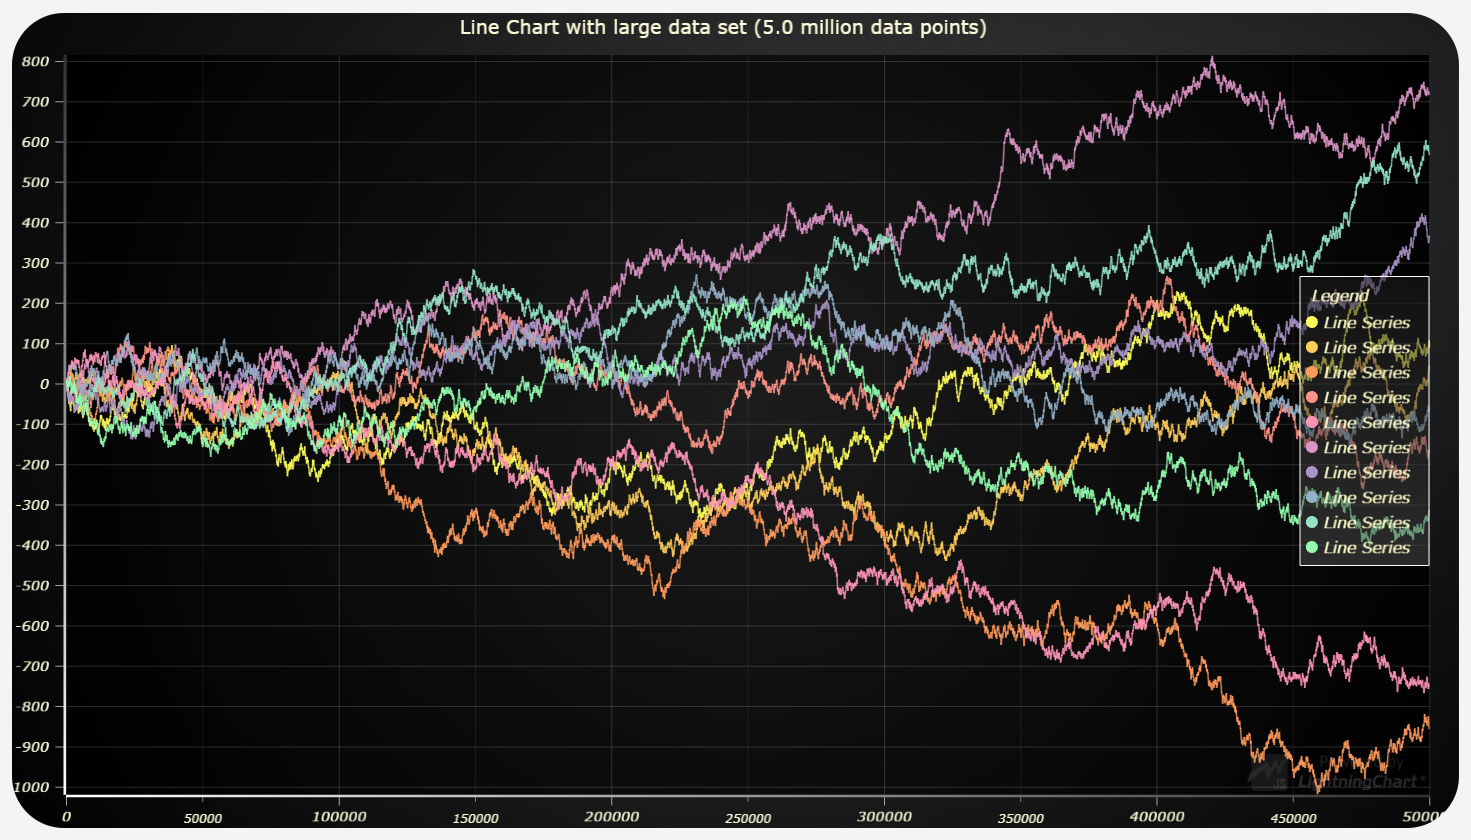
When using JS line charts on a high-end PC, the amount of data varies according to the line chart type. See here:
- Static line charts: render more than 500 million data points and 100 million data points are loaded in only 6.5 seconds.
- Refreshing line charts: render more than 2 million data points.
- Appending line charts: render more than 4 million new data points/sec.
As for heatmaps on a mid-level PC:
- Static heatmaps: 900 million data points in 5 seconds.
- Real-time refreshing heatmaps: 196 million data points.
- Real-time appending heatmaps: 1.2 billion data points at 140 FPS.
Rendering technology
LC JS uses WebGL rendering which highlights the library’s capability to render highly interactive 2D and 3D charts. LC JS is also fully GPU (hardware) accelerated which guarantees that resources are used more efficiently thus speeding up rendering processes. Feel free to interact with all the JS charts examples available.
Server Side
LC JS has a headless NPM package to render LC charts in a server application. You can learn about it on NPM.
Interactivity
LC JS has several UI features including touchscreen compatibility, zooming, panning, and tooltips. These features are fully customizable.
License
LightningChart JS has multiple licensing options including a free community version (for non-commercial purposes), a Web Developer license, an Application Developer license, and an Enterprise license that is fully adaptive to the user’s requirements.
LightningChart JS pricing starts from $1 090 for a Web Developer and a 1-year license for one developer. You can learn more about our adaptive, flexible, and fully customizable licensing options here.
HighCharts
This is a library that brings back old memories. When I was working as a developer in a financial corporation, I had the job of finding a simple and quick way to display data in graphs.
HighCharts was a good solution at the time because it was very easy to implement the library in our Visual Studio project. My experience was about 5 years ago but today HighCharts is still a relevant library.
In my experience, I remember working with over 100,000 rows of data on a single page. At the time, I remember HighCharts as a fully JS library. HighCharts now has an option to make .NET (and .NET Core) work too.
Documentation
HighCharts provides a vast documentation site where users can learn how to install the packages and implement many types of charts. Also, we can use the “Chart Chooser” tool, where we can experiment with many types of charts, and select the chart that could resolve our necessity.
Scope
I have found great tools to test, we can use Highcharts with financial data or we can use it for mathematical purposes. Also, if we need to display data on maps, we will have a 3D representation of the world.
For JS, we can use it in modern websites or mobile apps, using frameworks like Capacitor by Ionic. For C#, we can get the HighCharts package for .NET and .NET CORE, which means we can use it in our web/desktop app.
Technical Information
Regarding data limitations, in research, HighCharts defaults to a limit of 1000 data points. There isn’t a solid number for how many data points this library can allow, but checking some forums, there are reported issues with trying to use more than the initial limit.
This is a major limitation for those users who require outstanding performance.
Rendering technology
HighCharts is a full JavaScript-based library. HighCharts makes use of scalable vector graphics, HTML5, and CSS. Now there is a server-side option (without the use of a web client), making use of the Phantom JS technology.
It offers fast and native support for various web standards: DOM handling, CSS selector, JSON, Canvas, and SVG. – https://phantomjs.org/

Interactivity
Touchscreen compatibility, zooming, panning, and tooltips will be available depending on the device/software compatibility.
License
In terms of licensing, HighCharts offers Web, SaaS, SaaS+, and OEM on top of their free license.
Plotly
I have no experience working with Plotly professionally, but I had to go through the documentation and was able to check many examples.
Plotly gives us many libraries to work in many languages with open-source coding including Python, R, Julia, JS, GGPlot2, F#, MatLab, and Plotly Dash.
I would say that Plotly shows the most modern minimal user interface, and this is useful if your purpose is to display maps, charts, or properties for sale purposes. It looks very attractive and modern.
Scope
Plotly will allow you to work in JS and C# and create many types of graphs, maps, and real-time object recognition but at a limited data amount processing.
Documentation
Plotly has its own web documentation. Compared to LightningChart and HighCharts, this would be the least impressive documentation I’ve seen.
The C# documentation is not too impressive, and the examples (Images) could be disappointing because after seeing the main page (right side), you would wait to see real-time examples like those.

For coding, it’s good. The documentation provides full code to create the charts. For each web language, we will have full documentation with many examples, but with the same presentation as C#.
Technical Information
Regarding data limits, there isn’t a solid number for how many data points this library can allow. Searching in some forums, it seems like the standard could be 500k of data, but there are problems with crashes trying to render millions of points. Here’s a StackOverflow post about it:
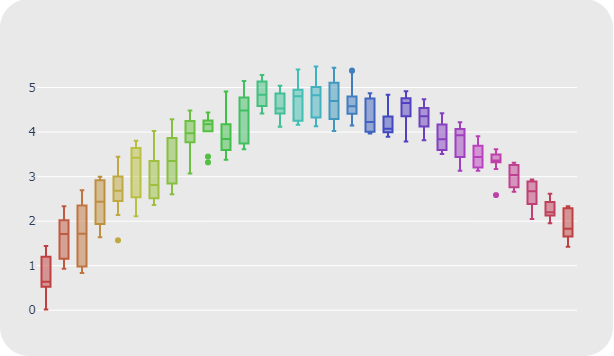
“Plotly really seems to be very bad in this. I am just trying to create a boxplot with 5 Million points, which is no problem in the simple R function “boxplot”, but Plotly is calculating endlessly for this. It should be a major issue to improve this. Not all data has to be saved (and shown) in the Plotly object. This is the main problem I guess.”
Rendering technology
Plotly is built using D3.js technology. Also, Plotly makes use of NVIDIA Inception, a virtual accelerator designed to support startups that use GPUs, meaning computation in the cloud side. This isn’t cost-effective for customers as it increases the costs of running the services.
Interactivity
Touchscreen compatibility, zooming, panning, and tooltips will be available depending on the device/software compatibility.
License
Regarding licensing, Plotly is pretty much limited to using open-source or enterprise leaving very little flexibility for getting an immediate overview of the right pricing based on the user’s requirements.
ZingChart

ZingCharts is a library focused on JavaScript data plotting. If you just need to create charts in a web app, this would be a simplified way to do it.
Also, the look and feel of this library look very nice and familiar for websites that use the Twitter bootstrap, using the minimal and clean style to display data.
That being said, we will be able to integrate ZingCharts into our web applications… maybe not in an advanced way like the other chart libraries, but in a way that is really familiar to web designers and developers.
Scope
ZingCharts is focused on web development, so you will be able to work with its libraries on modern websites. There is not a fully dedicated C# package, so I can’t ensure that you will be able to work with desktop applications.
If you need to work with .NET, your project will have to execute JavaScript. In that case, I would recommend working with MVC .NET projects, because they would be easier to implement.
Documentation
I liked the ZingCharts documentation site as it’s very easy to understand. You’ll be able to copy the HTML, JavaScript, and CSS properties, paste them into your project and that’s it (for an initial setup).
About C#, this was a bit disappointing, because you will be redirected to a GitHub page. GitHub is great, but I would prefer dedicated documentation from ZingChart.
Technical Information
Regarding data limitations, ZingChart can render more than few thousand data points making it one of the slowest options available in the market for charting solutions.
Rendering Technology
ZingChart is a full JavaScript-based library. ZingChart makes use of basic technology scalable vector graphics, HTML5 and CSS.
Interactivity
Touchscreen compatibility, zooming, panning, and tooltips will be available depending on the device/software compatibility.
License
Compared to Plotly, ZingCharts offers several pricing options depending on your requirements. What you’ll base your purchasing decision on will depend on your project needs.
AnyChart

If you like the minimalist style of ZingChart, perhaps Any Charts is your favorite of these best JavaScript charting libraries. Why? Well, if your clients need a style more akin to excel graphics; this option will be the right one.
But don’t let appearances fool you; Any Chart offers some advanced user interface controls that will be helpful to the user. Almost all data analysts use Excel documents to graph their data, Any Charts will be familiar to them and quite intuitive to use.
AnyCharts has some integration templates for .NET, VB.NET, and MySQL. If you want a simpler integration with your website, AnyCharts might be the best option.
Scope
AnyCharts focuses on web development or any type of application that can run JavaScript. Perhaps the scope may seem limited, but if you only need to display data on your website, this would be one of the easiest ways. To implement AnyCharts, you just need to import the API or simply copy the JavaScript library into your project and code.
Documentation
For AnyChart, we will have the API documentation and a tool named “Playground”, where you can choose a type of chart and copy the source code.
Technical Information
The information about how many data points can be rendered in different chart types is not available. However, this JavaScript charting library is not performance-oriented, and similar to ZingChart, rendering capabilities are limited to only a few thousand data points.
Rendering technology
AnyChart is a full JavaScript-based library. It makes use of the GraphicsJS Drawing Library.
Interactivity
Touchscreen compatibility, zooming, panning, and tooltips will be available depending on the device/software compatibility.
License
Like ZingCharts, there are several pricing options available.
Conclusion: Best JavaScript Charting Libraries
We reviewed what are 5 of the best JavaScript charting libraries. All of them are very productive, and the choice will be yours. If you or your clients just need a friendly and easier way to implement and display your data, AnyCharts and ZingCharts will provide the solution.
Also, if your application only needs to execute JavaScript and your programming experience is more Front-End focused, these libraries would be a great option.
On the other hand, we have LightningCharts, HighCharts, and Plotly… Plotly shows an amazing user interface (on their website), but I don’t know how long it would take to generate graphs like that…performance is pretty much questionable.
Reviewing the documentation, the examples are very attractive, and I suppose you will have to have advanced knowledge of Front-End dev.
HighCharts gives us similar solutions in a more user-friendly guise, and at first, you’ll get a better look than Plotly. If you like ZingCharts or AnyCharts, but need dedicated C# packages, or to work on modern web apps or mobile apps, HighCharts would be a better choice.
About LightningChart, I was able to work on different projects and the compatibility is very impressive. The documentation is very comprehensive and the support for getting code and viewing their interactive JavaScript charts examples is great.
You will be able to combine two or more chart types into one and create a custom chart. You will also be able to display a lot of graphics on the same desktop with good performance.
Almost all graphics have a 3D rendering, and it is very easy to switch between different themes (look and feel). If you need to read binary data in real-time and represent electric/sound/vibration signals in 2D and 3D, this would be the best choice.
In the end, researching the technical information of each library, I was disappointed with Plotly and Highcharts, because the information is not very clear and understandable. (Not taking into account crash reports due to performance issues). LightningChart offers too many details of its technologies and impressive performance results.
If you just need to display data without millions of data points, go for Highcharts, but if you need a powerful option that combines high performance, state-of-the-art technology, and impressive-looking charts, I think you’ll have to look into LightningChart.

Omar Urbano
Software Engineer
Continue learning with LightningChart

React Charting Performance
Here's a scenario that plays out across development teams every few months. Someone builds a React dashboard, picks Recharts or Victory because they're popular, the devs love them, and the first demo looks great. Then the dataset gets bigger. Or the data starts...

Javascript Charting Library comparison 2026
Every year someone publishes a listicle of JavaScript charting libraries. They screenshot a demo, note the GitHub stars, paste in the npm install command, and call it a day. Then you follow their recommendation, get six months into your project, and discover that your...

Visualizing 10 Million Data Points in the Browser (2026): The Technical Deep-Dive
Ten Million Data Points in the Browser: How WebGL Makes Mass Datasets Interactive Ten million data points. That number used to mean a database problem, not a front-end problem. Now research teams want to explore it interactively in a browser. Trading desks want...


If you have any questions, feel free to contact us!
©LightningChart Ltd 2026. All rights reserved.