Visualizing 1 trillion data points in real-time with .NET charts
DemoA WPF project made to render 1,000,000,000,000 data points using the DigitalLineSeries.
1 Trillion Data Points – video demo
LightningChart .NET has broken a world record and achieved a major milestone in charting performance and data rendering. A few years ago, we breached the record of rendering of 1 billion data points in a chart setting LightningChart .NET with the world record. Today, LightningChart .NET can visualize 1,000 times more than before. LightningChart .NET is now able to render 1 trillion data points in a real-time scrolling use case.
LightningChart .NET is a data visualization component (charting library) compatible with WinForms, UWP, and WPF. LightningChart has been intensively developed to meet the highest performance requirements of demanding application developers and end-users.
Software developers and engineers working in highly demanding industries like vibration analysis, medical devices manufacturing, or trading and finance, build data-oriented applications that must process massive amounts of data in real-time without downsampling a single data point.
What is the 1 trillion data points major breakthrough about?
LightningChart .NET v.10.3 brought several performance improvements and new additions, including a brand-new line series named the DigitalLineSeries which displays a line alternating between two Y-values.
The novelty of the DigitalLineSeries is that it refers to a binary stepping line for visualizing digital logic states and from all the line series available in LightningChart .NET, this one consumes the least amount of memory.
Video demo of LightningChart rendering 1 trillion data points
Test specifications
Device Hardware & Operating System Specifications

OS
Windows 10
CPU
AMD Ryzen 9 5900X
RAM
128 GB
GPU
Nvidia GTX 1070
Test Parameters
Digital line series count
100X axis length 10 billion data points
Data point append count / round / series:
6250*
Test overview
Along with the release of LightningChart .NET v.10.3, we’ve performed rendering and performance tests where we were able to demonstrate how the new line series DigitalLineSeries can visualize 1 trillion data points (1,000,000,000,000) in a real-time scrolling use case.
During the tests, we monitored the frames-per-second (FPS) and observed a high FPS rate of around 60hz. The frames-per-second indicate the times per second that a chart or visualization is updated. The higher the FPS rate, the better but as a reference, a good FPS should be at least 40 or more.
No downsampling was used
Downsampling refers to a technique that contrasts true high-performance as it is implemented when there is a need to render million, billion or more data points. The way how downsampling works is by processing only a limited percentage of data points, for instance, instead of processing 100% of the data points, only 1% is processed. This is a common workaround that eases the resources consumption in the device at the cost of a huge loss of information.
When visualizing 1 trillion data points, every single data point was fully included in the rendering. LightningChart .NET becomes the first charting library capable to visualize several times more data than any other WPF data visualization solution has been able to, using 128 GB RAM.
1 Trillion data points
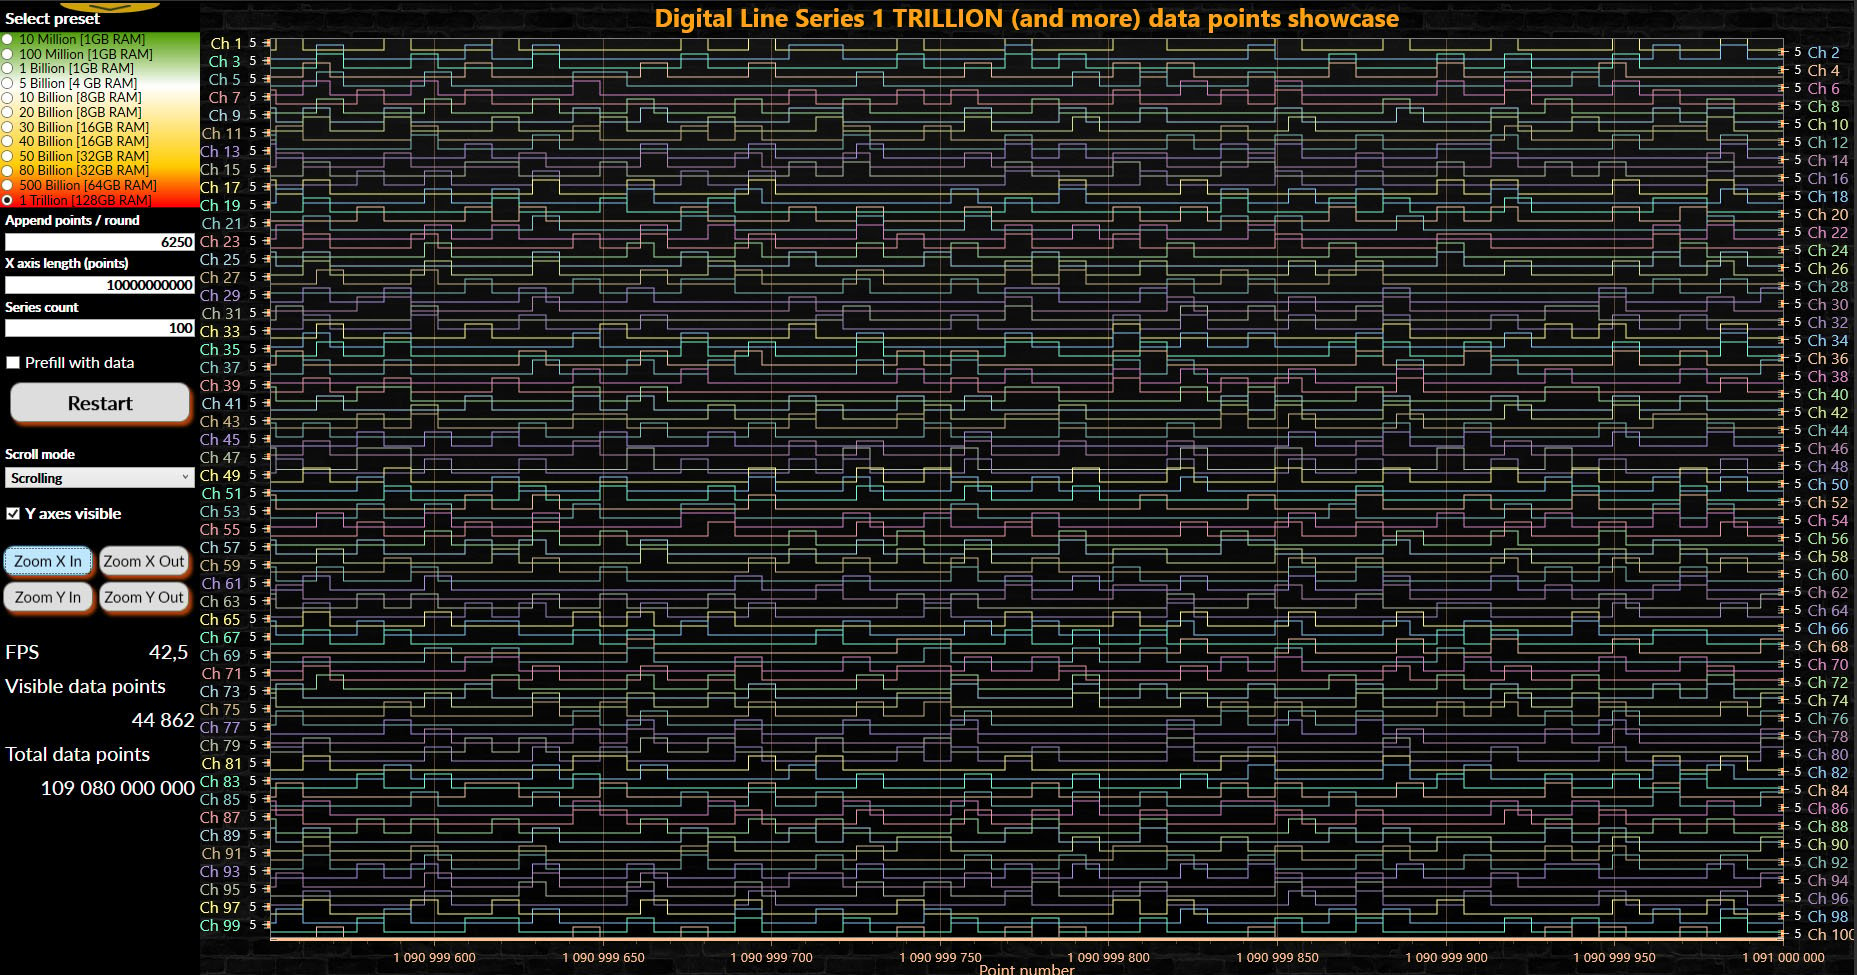
The next image shows how the DigitalLineSeries is rendered, in a scrolling mode, with 1 trillion data points using 99 different data stream channels simultaneously.

Image: Visualizing 1 trillion data points with the DigitalLineSeries in LightningChart .NET
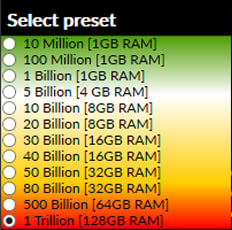
From the top left corner, you can see different presets available. In terms of the device’s resource consumption, the first preset is the most affordable as it renders 10 million data points using only 1 GB of RAM, a feasible process for even the most low-end devices.
The last available preset corresponds to rendering 1 trillion data points using 128 GB of RAM. This preset is suggested to be used in high-end devices for applications with data-intensive processes.

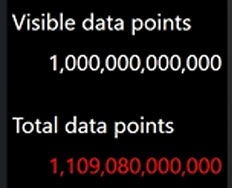
As visible in the video, at the end of the process, it can be seen the total number of data points that were rendered: 1,109,080,000,000. Over 1 trillion data points are actually visualized.

Replicating the test
This test can be replicated by any user with a desktop device capable of handling the test requirements. LightningChart .NET can be downloaded via the free trial version of 30 days. After downloading LightningChart .NET, you’ll get access to the desktop interactive examples where you can search for the DigitalLineSeries and execute the test. The test can be adjusted to your device’s specifications, for instance, visualizing 5 billion data points with 4 GB RAM or 40 billion with 16 GB RAM.


