









LightningChart .NET v.12.6.1 is out now!
Features of LightningChart® .NET version 12.6.1
In this release we added new features, made several improvements and fixed dozens of errors. We upgraded target framework (from .NET 8.0 to 10.0), added Universal-Data-Parser control (dashboard creator and data visualizer in one) and improved custom-colored line’s rendering speed among other things.
New .NET Target framework
LightningChart .NET has been updated from version 8.0 to 10.0. This change ensures native support for the LightningChart control within .NET projects and aligns with Microsoft’s support policy for the .NET framework.
LightningChart v12.6.1, is compiled for .NET 10.0. Additionally, a separate library build is available for projects utilizing .NET Framework 4.8 and later versions.
Universal-Data-Parser
A drop-in WPF dashboard for LightningChart. The user drags data files onto it, picks what to draw and where, and the parser reads the file, works out its shape and renders it into a chart. Everything is built on robust and fast LightningChart controls.
UniversalDataParser is a UserControl which can handle dashboard creation and data loading without a single line of code. Just drag-and-drop data source, create desired layout and add chart-type you need or like.
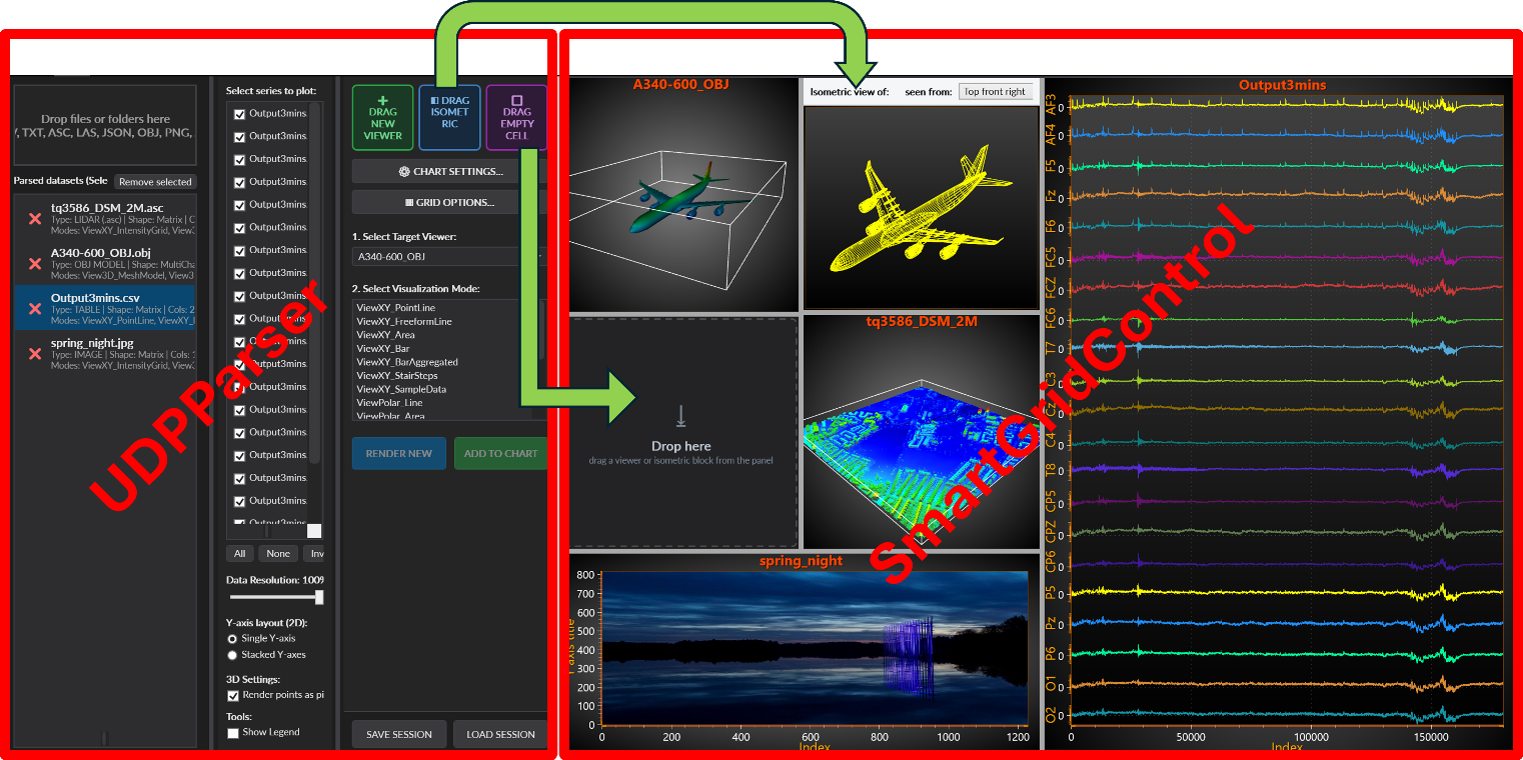
Example showing usage of data-parser and Smart-grid-control.
More information can be found here.
Custom-colored lines now render up to 100 times faster
Custom-colored lines now render up to 100 times faster when using the CustomLinePointColoringAndShaping event in SampleDataSeries, PointLineSeries, and FreeformPointLineSeries.
LightningChart has CustomLinePointColoringAndShaping event, which can be used to add custom colors for SampleDataSeries, PointLineSeries and FreeformPointLineSeries. Event handler receives array of screen-coordinates constituting line-series. And user can change color of each point on the screen though this event handler. The rendering speed increase (as compared to previous version) is higher when series have more points. For example, if SampleDataSeries & PointLineSeries has 1 million points, colored-line rendered 100 times faster than before. Rendering speed also increased as the user receives an array of original point indices (int[] DataPointIndices) corresponding to those pixels on the screen. Therefore, users won’t need to call series.SolveNearestDataPointByCoord or series.SolveNearestSampleByCoord method to find that information. Furthermore, CustomLinePointColoringAndShapingBaseEventArgs class now contains field DataPointIndiceCount – array of data point count at each coord. FreeformPointLineSeries already had non-empty DataPointIndices array before. Therefore, improvement in colored-line rendering speed is smaller, but nonetheless significant (up to 3x faster). In addition, vector format output (SVG, EMF) now also supports Custom-colored lines. Previously, line-style color of series was used.
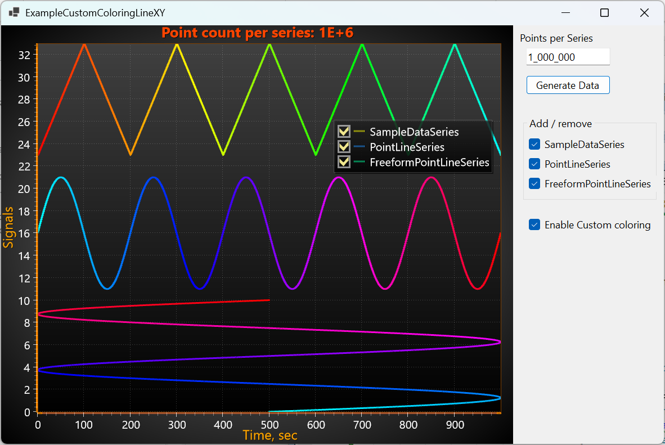
Example showing custom-colored lines.
More information can be found here.
Improved rendering of thick lines
Previously, when data is scrolled/swept or DataBreaking is enabled, lines-series rendering may have some discontinuities or joint (between line segments) chipping. That especially apparent for thick line and if color was semitransparent. The same issue has been present with some of thick borders. Now thick line rendering is smoother and looks better. In addition, new RemoveOverlapBetweenLineSegments property is added (part of ChartRenderOptions in WPf or RenderOptions in WinForms). It controls how the overlap adjacent line segments (of line-series, or border of Polygons/Maps) are rendered. By enabling RemoveOverlapBetweenLineSegments property semitransparent line will become more homogeneous and nicer.
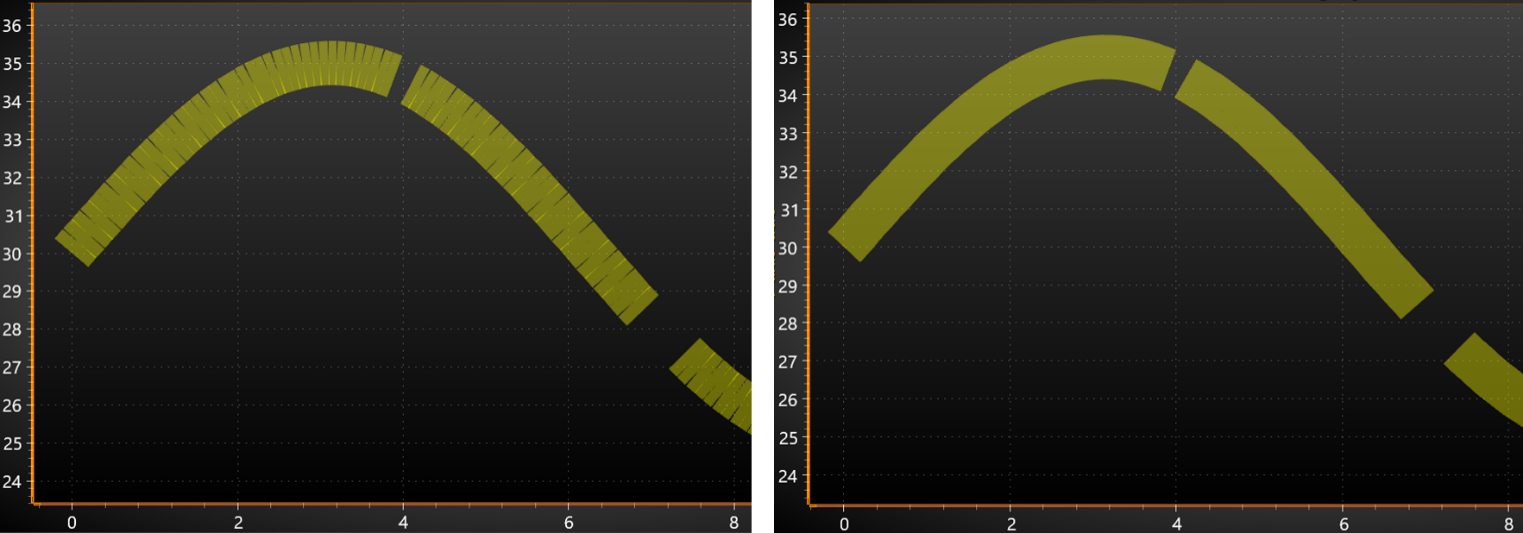
Thick (50px) semitransparent high-density line with DataBreaking. On the left previous version rendering, on the right v12.6 with RemoveOverlapBetweenLineSegments enabled.
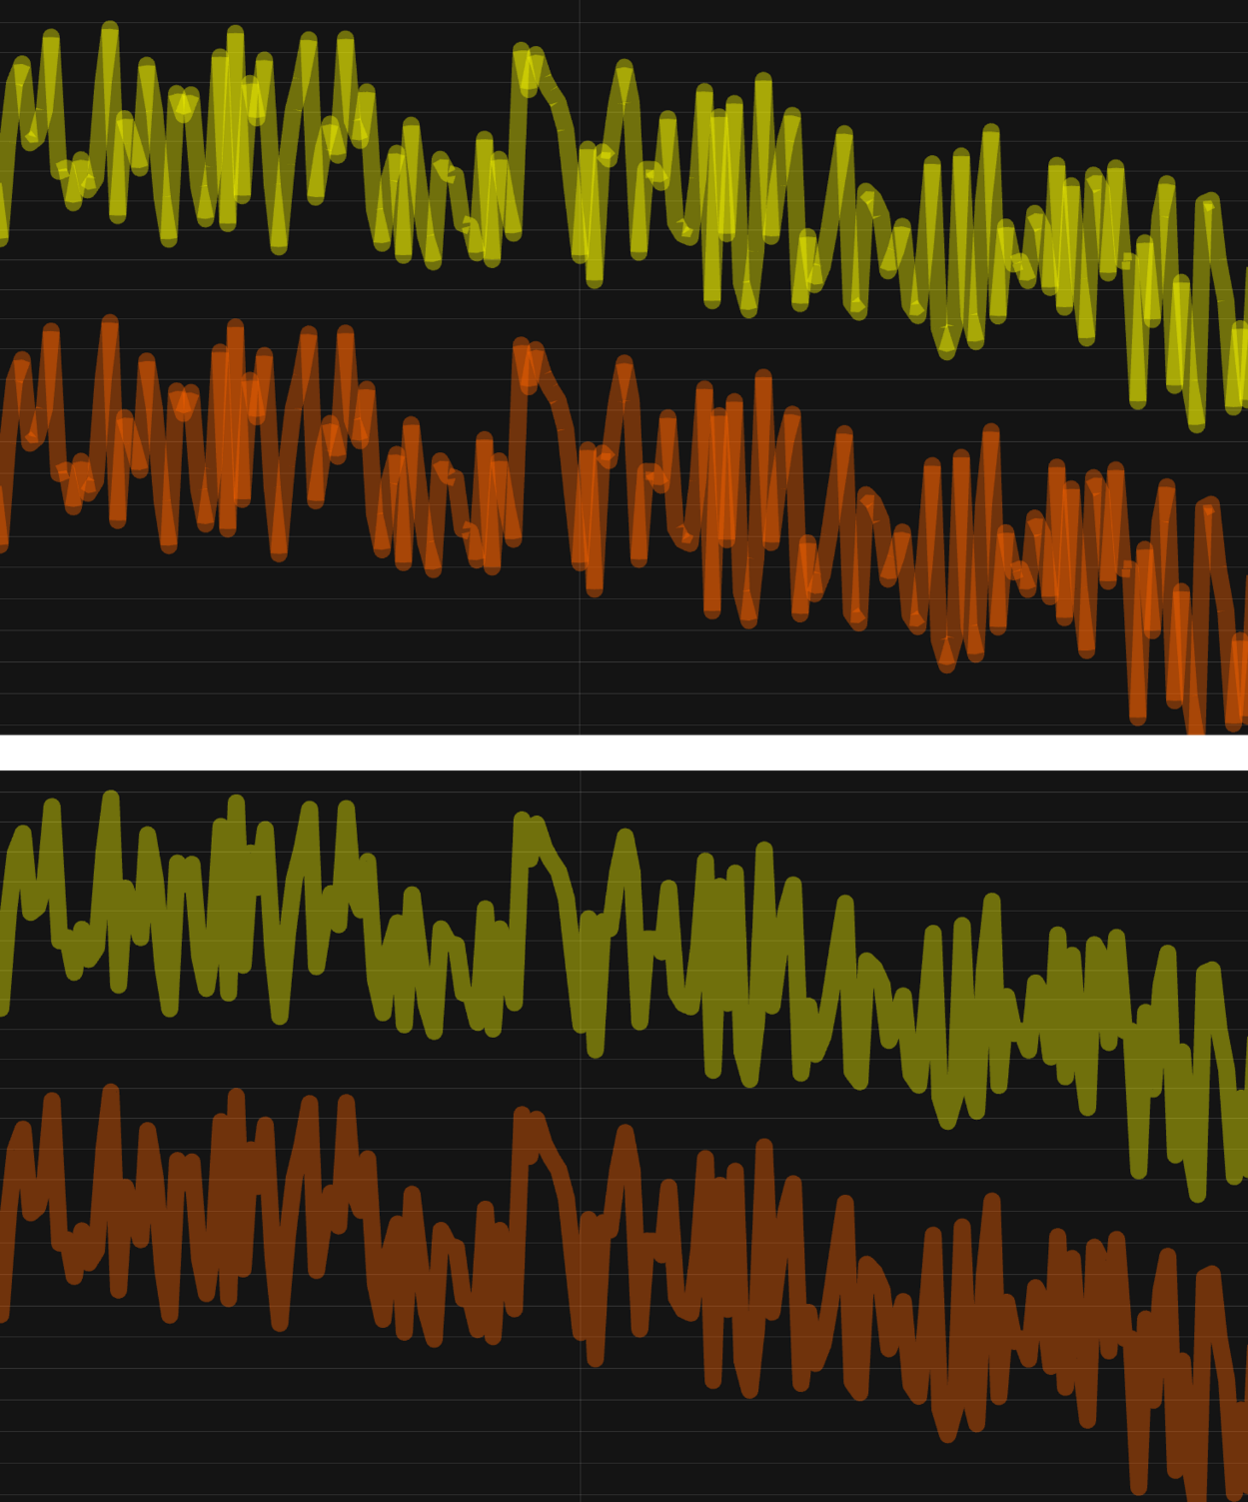
Continuous line made up of steep segments. Top, RemoveOverlapBetweenLineSegments disabled (old behavior, default) and at the bottom – enabled.
New technical indicators added to .NET Trader
Added the following technical indicators to .NET Trader: Average Daily Range (ADR), Choppiness Index CHOP), Hull Moving Average (HMA), Smoothed Moving Average (SMMA), Fibonacci Bands.
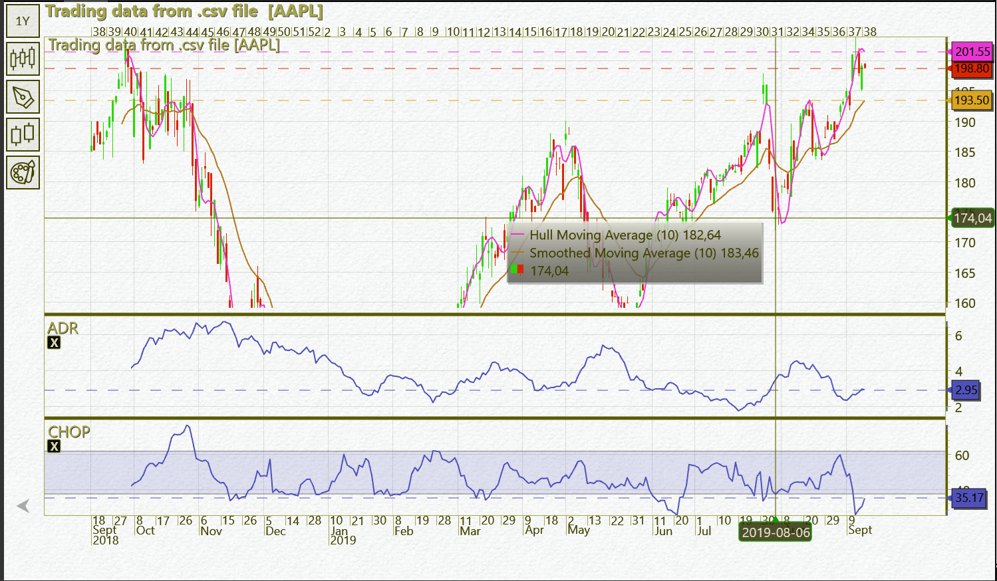
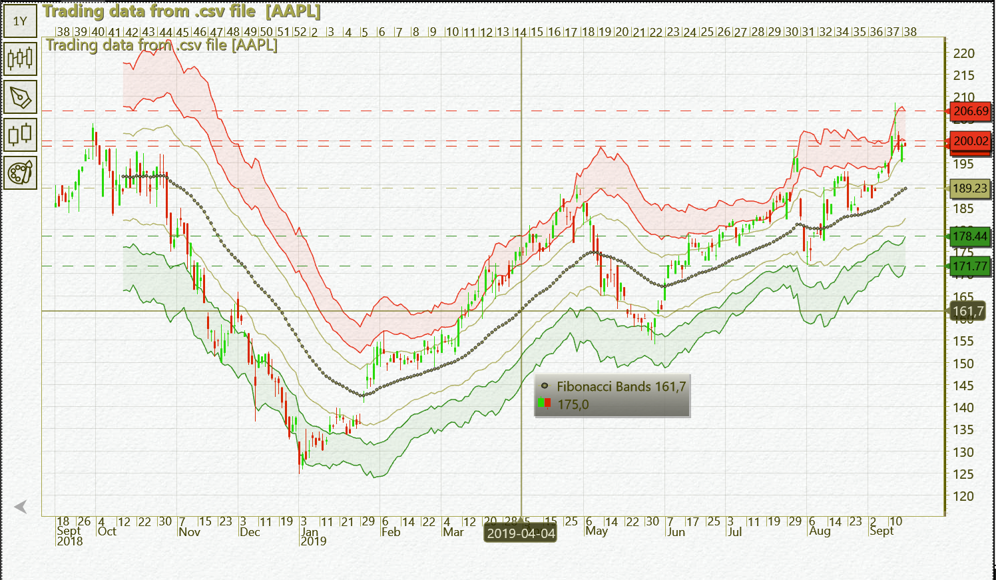
Trading data with new Technical Indicators.
Improved data streaming with LiteLineSeries
Smoother and faster data sweeping/scrolling with LiteLineSeries than before (when same amount of data used). When large amount of progressive but not fixed interval data is streamed (e.g. 100M points), lots of computer resources are needed (i.e. CPU and RAM). When those resources are scarce, scrolling of data becomes less smooth, choppy or even some data blocks get temporally not displayed. Latest improvement makes large data scrolling faster (up to 3 times), smoother and without artifacts.
Other features/improvement
- DataCursor now works better with multi-colored lines.
- DataCursor’s ResultTable now supports titles with multiple lines.
- SVG file size is halved, when chart with intensity-series is exported.
- Added support for paletted line with DataBreaking in DirectX9 engine.
- DigitalLineSeries now support LineSeriesCursor and DataCursor.
Improved rendering of transparent points of SeriesPointCompactColored3D-type of PointlineSeries3D.
For a complete list of changes, check the official changelog.
Get started with LightningChart .NET v.12.6.1
See more news
Trend Lines in Trading
Trend lines are among the simplest yet most powerful tools in technical analysis. They help traders visualize market direction, identify potential support and resistance levels, and make more informed trading decisions. Despite their simplicity, trend lines remain a...
Announcement: Baumer as LightningChart customer
Enabling High-Performance Visualization of Industrial Sensor Data with LightningChartDiscover how Baumer uses LightningChart to configure and visualize data from a wide variety of industrial sensors and create responsive, data-rich visualization...
Best Python Charting Library in 2026
Python's charting ecosystem is large, overlapping, and regularly misunderstood. Most comparison guides stop at Matplotlib, Plotly, and Seaborn. This one goes further: it covers what happens when your datasets grow large, your update rates increase, or your chart types...
Best TradingView Charting Library Alternative
TradingView's charting libraries are the most visible option for fintech developers. Visibility is not the same as capability. This guide is for developers who have hit the wall on candle count limits, watermark restrictions, branding requirements, real-time...



If you have any questions, feel free to contact us!



©LightningChart Ltd 2026. All rights reserved.