Universal Data Parser
From version 12.6 UniversalDataParser control can be used.
A drop-in WPF dashboard for LightningChart. The user drags data files onto it, picks what to draw and where, and the parser reads the file, works out its shape and renders it into a chart. Everything is built on robust and fast LightningChart controls.
UniversalDataParser is a UserControl which can handle dashboard creation and data loading without a single line of code. Just drag-and-drop data source, create desired layout and add chart-type you need or like.
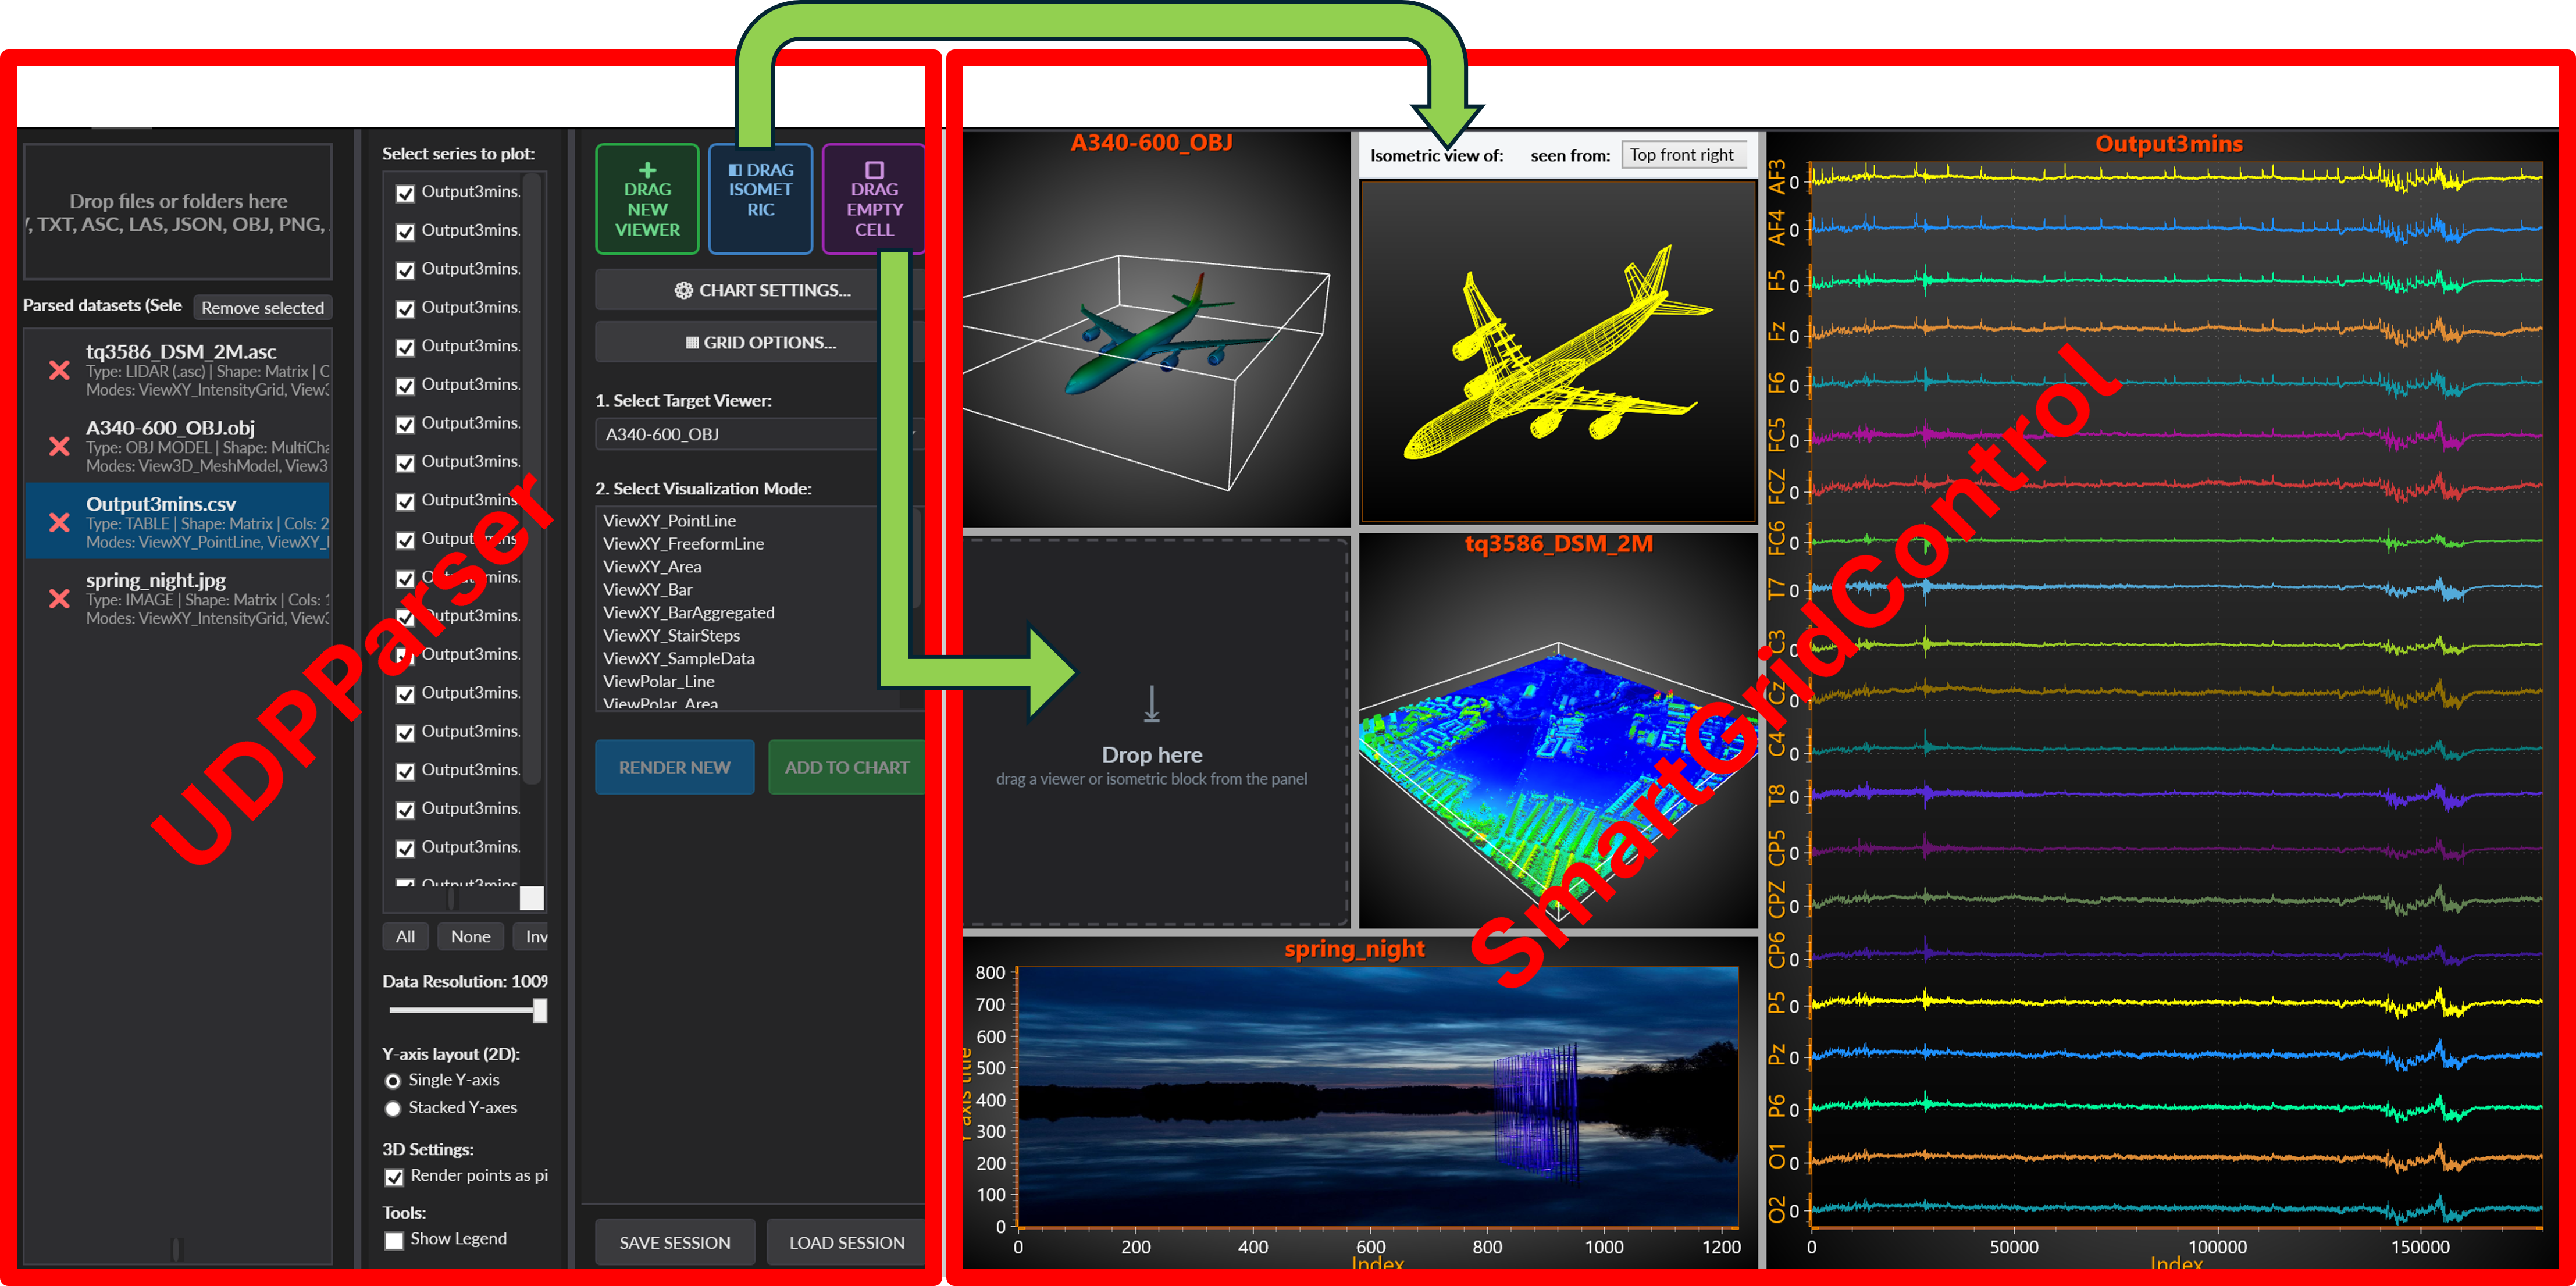
UDP controls highlighted: UDPParser, SmartGridControl, UDPIsometricPanel, EmptyGridCell. Not highlighted cells in SmartGridControl hold UDPViewer (4 charts in total).
1.1 Requirements
| Framework | WPF on .NET Framework 4.8, or WPF on .NET 10. |
| Assembly | LightningChart.WPF.UDP.NET4 on .NET Framework, LightningChart.WPF.UDP.NET10 on .NET. The control is a companion assembly beside the charting library rather than part of it. Each goes with the charting assembly of its own framework - NET4 with LightningChart.WPF.Charting.NET4, NET10 with LightningChart.WPF.Charting.NET10 - and the pairing is not optional. The parser uses members the charting library keeps internal, and both assemblies carry the same version from one build to the next, so a mismatched pair loads without any complaint from the loader and fails at the first moment one of those members is needed. Deploy both from the same build. |
| Namespace | LightningChartLib.WPF.Charting.CustomControls.UniversalDataParser |
| Rendering | DirectX 11 or DirectX 9 through the LightningChart rendering engine |
| Thread | All controls are WPF controls and belong to the interface thread. Parsing and render-data building are moved to background threads internally; nothing in the public API is safe to call off the dispatcher. |
1.2 The controls
| Control | What it is |
|---|---|
UDPParser | The panel on the left: dropped files, their series, the visualization mode list, and the Render / Append / Save / Load buttons. One per dashboard. |
SmartGridControl | The layout area on the right. Viewers, isometric blocks and empty cells are dragged into it, split, resized with splitters and removed. |
UDPViewer | One chart with its own context menu and render settings. Created by dragging into the grid. |
UDPIsometricPanel | A block that projects another viewer's data into a 2D isometric picture. Dragged in like a viewer. |
EmptyGridCell | A placeholder cell, so a layout can be built before the charts exist. |
Only UDPParser and SmartGridControl are placed by the host application. The rest are created by the
grid when the user drags them in, or by a restored session.
1.3 Quick start
In XAML file define two containers - one for the parser, one for the grid:
<Grid>
    <Grid.ColumnDefinitions>
        <ColumnDefinition Width="1*" MinWidth="260"/>
        <ColumnDefinition Width="5"/>
        <ColumnDefinition Width="2*" MinWidth="200"/>
    </Grid.ColumnDefinitions>

    <Grid x:Name="ParserHost" Grid.Column="0"/>
    <GridSplitter Grid.Column="1" Width="5" HorizontalAlignment="Stretch" VerticalAlignment="Stretch"/>
    <Grid x:Name="LayoutHost" Grid.Column="2"/>
</Grid>
In code-behind — build on Loaded, not in the constructor:
using LightningChartLib.WPF.Charting.CustomControls.UniversalDataParser;

public partial class DashboardView : UserControl, IDisposable
{
    private UDPParser _parser;
    private bool _built;

    public DashboardView()
    {
        InitializeComponent();
        Loaded += OnLoaded;
    }

    private void OnLoaded(object sender, RoutedEventArgs e)
    {
        if (_built)
            return;

        _built = true;

        _parser = new UDPParser();
        ParserHost.Children.Add(_parser);

        LayoutHost.Children.Add(new SmartGridControl { ConnectedParser = _parser });
    }

    public void Dispose()
    {
        Loaded -= OnLoaded;

        if (_parser != null)
        {
            _parser.Dispose();
            _parser = null;
        }
    }
}
That is the whole integration. ConnectedParser is what ties the two halves together: the grid registers
each viewer it creates with that parser, and the parser offers them in Select Target Viewer.
Build the content on Loaded rather than in the constructor. An exception thrown from a constructor
cannot be shown by most hosts, and a control that failed to construct cannot be disposed cleanly.
Opening with a session
A session file (.udpsession) stores a whole dashboard: the layout, the viewers and the files that were rendered into them. Load one if you want the application to open with a dashboard already filled in instead of an empty grid. Do it after the parser and the grid have been added to the window, so there is something for the session to restore into.
try
{
    await _parser.LoadSessionFromFileAsync(sessionPath);
}
catch (Exception ex)
{
    MessageBox.Show(
        "Could not load the session." + Environment.NewLine +
        sessionPath + Environment.NewLine + Environment.NewLine + ex.Message,
        "Universal Data Parser", MessageBoxButton.OK, MessageBoxImage.Warning);
}
Await it. The method reads and re-renders every file the session names, which takes time, and everything it has to report comes back through the task. Call it without awaiting and you neither know when the dashboard is ready nor reliably observe failures. The call has to be made from an async method, which in a WPF Loaded event handler means async void; keep the try/catch inside that handler.
A session stores file paths, not file contents, and a path that no longer resolves is skipped on its own rather than failing the whole restore. The layout is rebuilt either way, so a session whose files have moved opens as viewers with nothing in them. That is deliberate.
1.4 Licensing
UDPViewer.SetLicenseKey("your-deployment-key");
Call it once, before the first viewer is created. It forwards to LightningChart.SetDeploymentKey, so an
application that already sets the key globally does not need this.
1.5 Watching the charts the parser creates
The charts are created inside viewers. Two process-wide callback properties expose their lifetime:
UDPViewer.ChartCreatedHandler   = chart => _myChartList.Add(chart);
UDPViewer.ChartDisposingHandler = chart => _myChartList.Remove(chart);
Assign these callbacks once at application level. Each property holds one delegate: assigning a new value replaces the previous callback, and clearing it affects every UDP viewer in the process. If several components need notifications, install one dispatcher or explicitly combine the delegates. Release references captured by the callback when the application no longer needs them.
UDPViewer.ChartCreatedHandler = null;
UDPViewer.ChartDisposingHandler = null;
Following the viewers themselves
A viewer also raises RenderCompleted on the interface thread once a render has finished and its chart holds the result. It is raised on the interface thread, so the handler can read the chart directly. Use this event, and not the chart's own repaint events, whenever you need to react to the data a viewer is showing.
The host never constructs a viewer, so there is nothing to subscribe to at startup. Viewers appear as the user drags them into the grid and as a session is restored. The parser announces each one:
_parser.ViewerRegistered   += OnViewerRegistered;
_parser.ViewerUnregistered += OnViewerUnregistered;

// Any viewer already there, which is the case when a session was
// restored before this code ran.
foreach (UDPViewer viewer in _parser.Viewers)
    viewer.RenderCompleted += OnRenderCompleted;

private void OnViewerRegistered(object sender, UDPViewerEventArgs e)
{
    e.Viewer.RenderCompleted += OnRenderCompleted;
}

private void OnViewerUnregistered(object sender, UDPViewerEventArgs e)
{
    e.Viewer.RenderCompleted -= OnRenderCompleted;
}

private void OnRenderCompleted(object sender, EventArgs e)
{
    UDPViewer viewer = (UDPViewer)sender;
    Debug.WriteLine(viewer.ViewerName + " finished a render.");
}
ViewerUnregistered is raised before the viewer is disposed, so the handler can still read it. Subscribing on registration and unsubscribing on removal is the whole pattern; there is no need to poll Viewers.
1.6 The Parser Panel
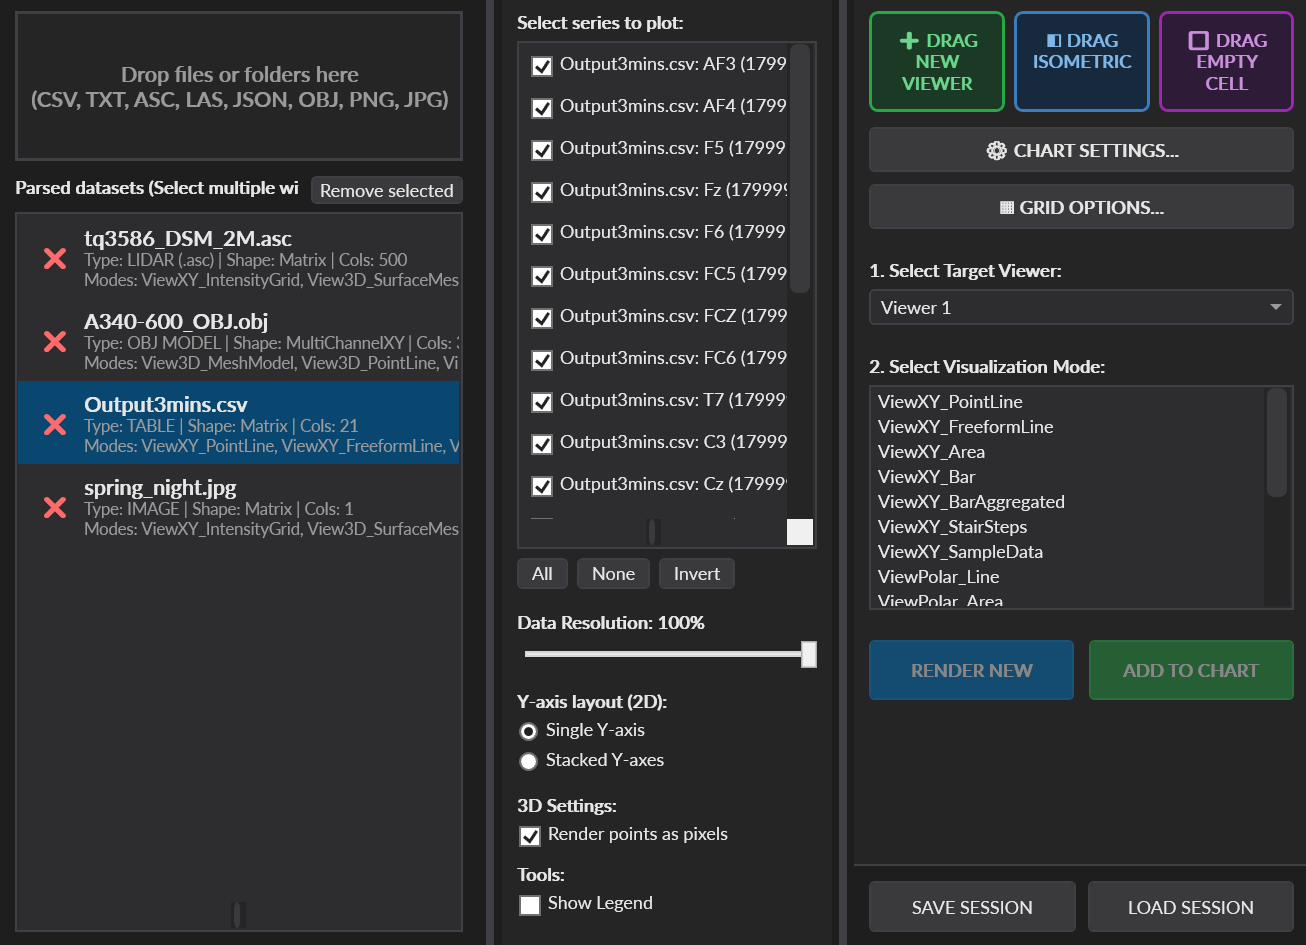
Parser Panel in details
What the user sees on the left, top to bottom:
| Element | Does |
|---|---|
| Drop area | Accepts dragged files. Unrecognized extensions are ignored silently. |
| Parsed datasets | Every file read, multi-selectable with Ctrl / Shift. Remove selected or Delete drops them. |
| Select series to plot | The columns of the selected dataset, each with a checkbox. All, None and Invert act on the list. |
| Select Target Viewer | Every viewer registered by the connected grid, by name. |
| Select Visualization Mode | Only the modes that suit the selected dataset's shape. |
| Axis and point options | Single Y-axis or Stacked Y-axes, Render points as pixels, Show Legend, and a downsample percentage. |
| DRAG blocks | The layout grid can be divided again and again by dragging one of blocks. |
| RENDER NEW | Replaces what the target viewer holds. |
| ADD TO CHART | Appends to it, keeping what is already drawn. |
| SAVE / LOAD SESSION | Writes or reads a .udpsession file. |
| ⚙ CHART SETTINGS… | The render settings of the selected target viewer. |
| GRID OPTIONS… | The layout grid and every chart in it: whether the charts redraw while a cell is being resized and how long they wait before they do, whether the splitters are shown, and Reset Layout, which empties the grid after asking and keeps the dataset list. |
Recognised Extensions
.csv,.txt,.asc,.json,.obj,.las,.png,.jpg,.jpeg,.bmp
Every dropped file is analysed on a background thread, so the interface stays responsive while a large file is read. The analysis works out the delimiter, whether there is a header row, the column names and their types, and the overall shape of the data. The file then appears in the dataset list, and the visualization modes that suit it become selectable.
1.7 The Layout Grid
SmartGridControl is a split layout that can be divided again and again. Drag a block onto an existing one and the cell splits in the direction of the drop, so dropping near the left edge puts the new block on the left, near the top puts it above, and so on. Dropping into the middle of an empty cell fills that cell instead of splitting it. When a block is removed, the block beside it grows to take the space back.
| Member | Does |
|---|---|
ConnectedParser | The parser that viewers in this grid register with. Set it once, when the grid is created. |
SplittersVisible | Whether the splitters are shown. Read-only; set through the two calls below. |
ToggleSplitters() | Flips splitter visibility. |
SetSplittersVisible(bool) | Sets it directly. |
ApplyGridOptions(options) | Hands a UDPGridOptions to every chart already in the layout. Splitter visibility is not part of it - a restored layout brings its own - so set that through SetSplittersVisible. |
GetSession() | The current layout as a SmartGridSession. |
RestoreSession(session) | Rebuilds the layout from one. |
LoadLayout(session) | The same, by another name. |
ResetLayout() | Empties it. Every viewer is removed, unregistered and disposed, and the viewer counter restarts. |
ClearLayoutProgrammatically() | Empties it without resetting the counter. |
RemoveElement(element) | Removes one block, promoting its sibling. |
DisposeLayoutTree() | Disposes everything and disconnects the parser. |
1.8 Sessions
A session is an XML document (.udpsession) holding three things: the datasets, the render operations, and the layout.
| Type | Holds |
|---|---|
UDPSession | Datasets, RenderOperations, Grid |
UDPSessionDataset | File path and the series selection made on it |
UDPSessionRenderOperation | Viewer id, dataset path, mode, stacked axes, pixel points, downsample percentage, append |
SmartGridSession | Viewer count, splitter visibility, layout root |
SmartGridNode | One node: Viewer, Empty or Split, with its children and split ratio |
- The control is a companion assembly, not part of the charting library, and it is built for .NET Framework 4.8 and .NET 10 from one set of sources. Deploy it beside the charting assembly of the same framework and the same build.
- Sessions store file paths, never file contents. Restoring one re-reads and re-analyses every source file, so a file that has moved is skipped rather than failing the load.
- They record what the viewers show, not the history of how they got there: operations a later non-appending render superseded are not written, so opening a session does not read the same file twice.
- Modes are serialized by name, so a session written by an earlier build keeps its meaning when an enum gains members.
| Call | Does |
|---|---|
LoadSessionFromFileAsync(path) | Reads the file and restores everything. Await it. |
LoadSessionAsync(session) | The same from an object already deserialized. |
LoadLayoutOnly(session) | Rebuilds the layout, loads no data. |
1.9 Render Settings
Every viewer carries its own UDPRenderSettings, reached from the parser's Chart Settings button or in code through UDPViewer.RenderSettings. The dialog edits a clone: Cancel discards its changes, while OK clamps and assigns them to the selected viewer and saves them as the defaults for subsequently created viewers. These settings are consumed by later renders; accepting the dialog does not rebuild content already in the chart. Viewer context-menu commands are separate, immediate edits.
Limits
| Setting | Meaning | Default |
|---|---|---|
MaxStackedAxes | How many stacked segments show Y axes. If segment count above it, YAxes won't be visible. | 64 |
MaxPointsPerSeries | Points before a series is split into chunks | 500 000 |
MaxGridCellsPerTable | Cells before an intensity grid is split | 1 000 000 |
MaxBarsPerSeries | Bars before rows are binned | 250 |
MaxCachedDataCells | Caches files with no more than this many parsed values | 10 000 000 |
Appearance and behavior
| Setting | Meaning | Default |
|---|---|---|
BarAggregation | Aggregated-bar value: furthest from zero (Peak) or arithmetic mean (Mean) | Peak |
AreaBaseMode | Area baseline: SeriesMinimum, Zero, Custom value | SeriesMinimum |
AreaBaseValue | The custom level | 0 |
SurfaceContourLines | Contour lines on 3D surfaces | off |
PolarGridVisible | Polar grid | on |
PolarAreaFilled | Filled polar areas | off |
SmithReferenceMode | Smith reference impedance: Taken from the data, 50 ohms or Custom value | FromData |
SmithReferenceValue | The custom reference impedance | 50 |
SeriesAllowUserInteraction | Series respond to the pointer | on |
ObjectsAllowUserInteraction | 3D objects respond to the pointer, and mesh triangle tracking | off |
SeriesHighlight | None, brighten or blink under the pointer | None |
DarkBackground | Chart theme | dark |
LegendBoxVisible | Legend box | off |
XYAxisXReversed / YReversed | Axis direction | off |
StackedAxesReversed | Order of stacked bands | off |
XYGridVisible | XY grid | on |
XYPointMarkersVisible | Point markers on line series | off |
IntensityGridPixelRendering | Pixel rendering instead of interpolated | off |
View3DLighting | How a 3D scene is lit: Standard, FromCamera, Surround, Uniform, Studio, SoftDome or HighContrast | Standard |
View3DLightMarkersVisible | Mark each light in the scene, with a draggable handle | off |
View3DOrthographic | Parallel projection | off |
View3DAxesVisible | 3D axes | off |
View3DSceneScalePercent | How much of the view the scene fills | 80 |
View3DWallsVisible | Scene walls | off |
View3DOrientationArrowsVisible | Axis direction arrows | off |
DataCursorVisible | Data cursor | off |
IsometricModelDrawnAs | Isometric model style: Vertices, All face edges, Outline edges or Filled faces | All face edges |
IsometricAskAbovePoints | Prompts before an isometric panel draws if more than this many projected points | 200 000 |
Persevering Render Settings
UDPRenderSettings settings = UDPRenderSettings.LoadUserDefaults();
settings.MaxPointsPerSeries = 250000;
settings.Clamp();
settings.SaveUserDefaults();
Written to %LOCALAPPDATA%\LightningChart\UniversalDataParser\RenderSettings.xml. Clamp() brings every value back into a workable range; Clone() gives an independent copy, which is what the settings dialog edits until it is accepted. Calling SaveUserDefaults() changes the defaults used by later viewers; it does not apply the object to an existing viewer unless it is also assigned to that viewer's RenderSettings.
1.10 Grid options
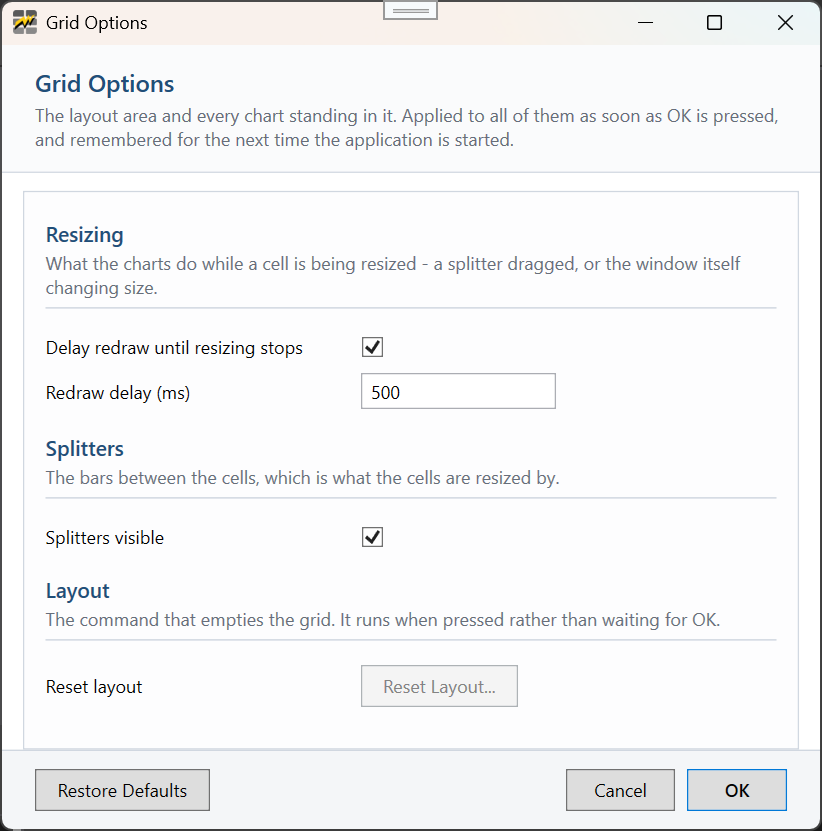
UDP Grid options window, when parser's Grid Options button is clicked.
UDPGridOptions is the other half: what belongs to the layout area rather than to one viewer. It is reached from the parser's Grid Options button, or in code through the static UDPGridOptions.Current, which every chart the parser creates reads as it is built. The dialog edits a clone the same way the chart settings do; OK clamps it, assigns it to Current, saves it as the user default and hands it to every chart already in the grid through SmartGridControl.ApplyGridOptions(options).
| Option | Meaning | Default |
|---|---|---|
UpdateOnResize | Charts redraw continuously while a cell is being resized. Off holds the last image and redraws once the size has settled, which is what keeps a splitter drag following the pointer on a dashboard of expensive charts. Applied to the chart's own ChartRenderOptions.UpdateOnResize, whose engine default is the opposite. | off |
UpdateOnResizeTimer | Milliseconds after the last size change before that redraw happens. Applied to ChartRenderOptions.UpdateOnResizeTimeInterval. Used only while UpdateOnResize is off. | 500 |
SplittersVisible | Whether the grid shows the splitters that resize its cells. | on |
Reset Layout... button | Removes every viewer and empty cell from the layout and returns it to the initial state. Asks first. The list of loaded files is kept. Disabled while there is nothing to empty, and while a render is running. |
1.11 Disposal
UDPParser.Dispose() is the one call the host needs. It disposes the connected grid, every viewer in it and every chart in those, unregisters the viewers, and releases the bookkeeping the control keeps outside the charts.
Disposing a viewer, whether by removing it or by disposing the parser, also:
- cancels a load that is still running,
- closes the tool windows that viewer opened,
- detaches the axis handlers it installed,
- drops the mesh, image-plane and grid-origin bookkeeping keyed by its chart, and
- calls
ChartDisposingHandlerbefore the chart goes.
1.12 Threading, Cancellation and Large Files
- File analysis and most parsing, palette-range scanning and render-data construction run on background threads. Chart-object creation and the final render run on the interface thread.
- A batch load shows an overlay naming the file and phase. If Cancel button is pressed: it stops at the next cancellation check during background work or between files, but it cannot interrupt synchronous chart rendering that has already started. Files already drawn remain visible.
- The public session-loading methods do not accept a caller-supplied cancellation token. Their lifetime token is cancelled by
UDPParser.Dispose(); the viewer's Cancel button controls an active data-load batch. - A render into a chart is wrapped in one update, so a multi-file batch paints once rather than after every file.
- LAS point clouds are read in chunks; the chunk size is the global
UDPParser.LasChunkSize. - Series longer than
MaxPointsPerSeriesare split into chunks that share their seam sample, so no gap appears between them. - Parsed rows are cached on the dataset only while they fit
MaxCachedDataCells; above that they are read again on the next render. Parsed OBJ models follow the same cap. - A dataset notices when its file changes on disk and drops its caches rather than drawing a stale copy.
1.13 API reference
UDPParser
ConnectedGrid | The grid this parser renders into. |
Viewers | The viewers currently offered as render targets. |
ViewerRegistered | Raised when a viewer becomes a render target. Subscribe to its events here. |
ViewerUnregistered | Raised before a viewer is disposed. Unsubscribe here. |
RegisteredViewers | The entries behind the target list. Bound to the list box, so of no use outside it; use Viewers. |
RegisterViewer(viewer) | Offer a viewer as a render target. The grid does this for you. |
UnregisterViewer(viewer) | Stop offering one. |
LoadSessionFromFileAsync(path) | Restore a whole dashboard from file. |
LoadSessionAsync(session) | Restore from an object. |
LoadLayoutOnly(...) | Restore only the layout. |
ToggleSplitters() | Toggle the grid's splitters. |
LasChunkSize | Static. LAS records per chunk. |
Dispose() | Tears down the parser, the grid and every viewer. |
UDPViewer
ViewerName | Dependency property. The name shown in the target list and on the chart. |
SessionId | Identity across a session save and restore. |
RenderSettings | This viewer's settings. |
LegendBoxVisible | Legend box state. |
EnableAxisContextMenu | Whether right-clicking an axis opens the engine's own menu. |
RenderCompleted | Raised on the interface thread once a render has finished. |
ChartCreatedHandler | Static. Called with every chart the control creates. |
ChartDisposingHandler | Static. Called before each is disposed. |
SetLicenseKey(key) | Static. Deployment key. |
UDPIsometricPanel
ConnectedParser | The parser whose viewers it can follow. |
SourceViewerName | The viewer it is following, by name. This is the value stored in a session file. |
Dispose() | Detaches from the source and the parser and disposes its chart. |
1.14 Enumerations
| Enum | Members |
|---|---|
DataSourceKind | DelimitedText, AscLidar, BinaryLidar, Image, GeoRoute, Json, ObjModel |
DataShape | VectorXY, MultiChannelXY, Matrix |
ChartDataType | Integer, Float, Double, DateTime, Unknown |
AscLidarFormat | TerrainGrid, PointCloudXyzRgb |
SavedCsvFormat | None, XY, XYWithText, XYError, HighLow, Stock, LineCollection, PointLine3D, PointLine3DWithIntensity, PointLine3DWithColor, PointLine3DWithColorAndSize, Polar, IntensityGrid, SurfaceGrid3D |
BarAggregation | Peak, Mean |
AreaBaseMode | SeriesMinimum, Zero, Custom |
SmithReferenceMode | FromData, FiftyOhms, Custom |
IsometricOrientation | Top / Bottom × Front / Back × Right / Left, which gives eight corners |
IsometricDrawMode | Automatic, Points, Lines |
IsometricModelStyle | Vertices, AllEdges, Outline, Filled |
UDPLightingScheme | Standard, FromCamera, Surround, Uniform, Studio, SoftDome, HighContrast |
1.15 Troubleshooting
| Symptom | Cause |
|---|---|
| A dropped file does nothing | Its extension is not in the recognised list. Nothing is reported for a file the parser does not claim. |
| No target viewer offered | The grid has no viewer yet, or its ConnectedParser was never set. |
| Render button disabled | A render is already running, or no dataset, target and mode are all selected. |
| A mode is missing from the list | The dataset's shape does not suit it. A file with two columns cannot make a 3D surface, and an OBJ model cannot make a candlestick chart. |
| Session restores an empty layout | The files it names have moved. Paths are stored, contents are not. |
| A chart is blank after a render | Check the dataset's series selection: a column of text encodes to no number and is dropped rather than drawn at zero. |
| Settings changed but nothing moved | Render settings are read as a render goes. Change them, then render. |
2.1 Input Formats
| Format | Read as |
|---|---|
| .csv .txt | Delimited text. Delimiter, header row, column names, stock columns and X axis type are detected. Files this parser saved itself are recognized by their header and read back in the same shape. |
| .asc | ESRI ASCII grid: either a terrain raster or an XYZ+RGB point cloud. The no-data value, the cell size and the real-world corner are read along with it. |
| .las | Uncompressed 3D LiDAR (Light Detection and Ranging) point cloud data, read in chunks. Embedded RGB is used when the point format supplies it; otherwise points use the height palette. |
| .json | Flat or nested. Nested documents become parallel-coordinate axes or a spider chart, with categorical axes carrying their category names as ticks. |
| .obj | Wavefront model with its .mtl materials, textures, per-vertex colours, faces and line strips. |
| .png .jpg .jpeg .bmp | It can be rendered as a 2D intensity grid, a 3D luminance surface carrying the source pixel colours, or a textured 3D plane. |
The reader consumes XYZ coordinates from uncompressed LAS records. RGB is recognised in point formats 2, 3, 5, 7, 8 and 10 when the record is long enough. It does not use intensity, classification, waveform or coordinate-reference metadata for colouring or rendering. Native RGB is retained by the compact coloured pixel path; choose height-palette colouring when rendering the cloud through a non-pixel point representation.
2.2 Schema detection
Each file is analysed once, and what is found decides which modes are offered:
- Delimiter, detected from the first two non-empty lines. Comma, semicolon and tab are supported; quoted fields and doubled quotes are handled, and decimal commas are considered when choosing between comma and semicolon. Space is not a general delimited-text separator.
- Header row, distinguished from data by whether its cells parse as numbers.
- Column names, which become series names and axis titles.
- X axis type: number or date-time, with day-month and month-day orders told apart.
- Stock columns: Date, Open, High, Low, Close, Volume, matched by name rather than position.
- Saved formats: a file this parser wrote is recognized from its header and read back into the same chart type it came from.
- Shape: a two-column vector, a multi-channel table, or a matrix.
- Grid geometry for ASC: corner, cell size and no-data value from the header.
- Extreme magnitudes: columns far from zero or in a very narrow band are scaled into a range the renderer can hold, and the scaling is disclosed in the axis or series title.
2.3 Visualization modes
ViewXY — PointLine, FreeformLine, Area, Bar, BarAggregated, IntensityGrid, StairSteps,
HighLow, Stock, SampleData, ParallelCoordinates, LiteFreeformLine Map.
View3D — PointLine, Scatter, SurfaceMesh, MeshModel, ImagePlane, ParallelCoordinates.
Polar — Line, Area, Spider.
Smith — PointLine.
Pie3D — Slices.
Only the modes that suit a dataset's shape are offered for it.
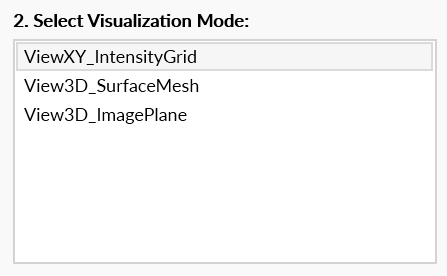
An example of Visualization modes suggested for bitmap image.
2.4 ViewXY
- Multi-channel data on stacked or layered Y axes.
MaxStackedAxeslimits visibility of stacked Y-axes, not the number of series or segments. When above the limit the stacked layout remains, but axis titles, labels, ticks and grids are suppressed. - Long series are drawn in chunks that share their seam sample, so no gap appears and no final sample is lost.
- Bars: raw mode draws one bar per row. Aggregated mode bins the visible rows to at most
MaxBarsPerSeries, anchors power-of-two bins to sample zero, states the rows per bar in the title, and re-bins as the X axis changes.BarAggregationselects either the value furthest from zero (Peak) or the arithmetic mean of finite values (Mean). - Intensity grids with interpolated or pixel rendering, a transparent palette step for no-data cells, and value scaling where the magnitude exceeds what the shader carries.
- Candlestick with a volume pane below it, as segments of one chart so the two pan and zoom together along X.
- Parallel coordinates, one axis per attribute, the lines recomputed as axes are dragged or zoomed.
- Stair steps, high-low, area with a choice of base level, sample-data and digital line series.
- A map mode for geographic routes, with a region selector.
- Wheel zoom in both directions;
ShiftandCtrlrestrict it as the engine defines, andAltzooms one stacked segment alone.
2.5 View3D
- Point clouds, scatter, surface meshes, terrain grids, image planes and imported models in one scene, all fitted to the same axes.
- Geographic grids carry a real-world corner, and those numbers are large: an Ordnance Survey tile starts near easting 365000. The first grid rendered into a chart fixes an origin for that chart, and every grid after it has the same origin subtracted. That is what keeps a set of tiles laid out side by side instead of stacked on top of one another.
- Scene dimensions follow the data's own proportions, with extreme ratios clamped so a thin axis stays visible and a thin one is lifted towards a floor rather than snapped to it.
- Anything sized in world units, such as a mesh model or an image plane, is rescaled whenever the axes move. That is what lets a model and a terrain share one scene without either being the wrong size.
- Camera: fit, top, front and side views, perspective or orthographic, and an adjustable scene box.
- Per-object section clipping: a clip box per mesh or point-line series, with six indicator planes drawn without the depth test so they are visible from any angle.
- The near clip distance is set to the larger of 0.5 and 5% of the camera view distance when the 3D scene is reset. This improves depth-buffer precision; it reduces, but cannot guarantee the elimination of, z-fighting. Geometry closer than the near plane is clipped.
- The 3D point-size tool applies one size, from 0.1 to 50 axis units, to adjustable non-compact point series. It includes OBJ data rendered as scatter points, but not a
MeshModel, compact points or pixel-optimized points.
2.6 OBJ models
- Materials and textures from the .mtl are preserved rather than overwritten with a palette.
- Alpha-cutout masks (map_d), which models use for foliage, fur and grilles, are drawn through the normal depth-writing path. The rest of the scene does not have to switch to order-independent transparency because of them.
- Transparency mode can be selected for all models or for one model: normal, ordered triangles, or order-independent.
- The opacity window changes only material parts that were transparent in the source OBJ/MTL. It applies one absolute opacity to those parts across the chart and can restore their source alpha values; it is not a per-model control and does not make originally opaque materials transparent.
- On import, source materials, textures and supported OBJ vertex colors are preserved when available; otherwise a height palette supplies fill color. The menus can replace mesh fill or wireframe with a single color or a height palette, globally or per model. They do not provide a command to restore source coloring after it has been replaced.
- Surface and wireframe are shown and hidden separately.
- Face culling is off, so a model with mirrored parts and opposite winding still draws. Models sit at the coordinates the file states, on the same axes as everything else. The engine's right-handed-to-left-handed depth conversion is applied once and used by every reader of the file alike.
- A model with no faces is drawn as points or line strips instead of a mesh.
2.7 Polar, Smith and Pie3D
- Polar: line and filled-area series, with an optional grid, and a spider chart built from nested JSON where each level becomes an axis.
- Smith: complex column pairs plotted against a reference impedance taken from the data, fixed at 50 Ω, or set by hand.
- Pie3D: one slice per row, for a categorical column against a value column.
2.8 Isometric block
This block follows one viewer and draws whatever it holds as a true isometric projection. The projection is computed once into two coordinates and the result is drawn as an ordinary 2D chart. That has three practical consequences: nobody can rotate the picture out of the arrangement it was drawn in, it prints and pastes exactly as it looks on screen, and it uses the 2D render path rather than the 3D one.
- Eight corners: top or bottom, front or back, left or right. All eight foreshorten the three axes equally; they differ only in which faces are in view.
- The scale is kept equal in both screen directions whatever shape the block is dragged into: the axes are re-ranged on every resize so one projected unit stays as wide as it is tall. Stretching one direction against the other would undo the equal foreshortening the projection exists for, and a cube would come out a box. The picture is sized to fit the shorter direction and centred in the longer, so nothing is ever cropped.
- Draw modes: automatic, points or lines.
- A model can be drawn four ways, chosen under Model Drawn As in the block's right-click menu and defaulted in the render settings: Vertices for the bare points, All Face Edges for the model exactly as its file stores it, Outline Edges, which leaves out the edge between two faces lying in the same plane so a box looks like a box rather than like the triangles it was cut into, and Filled Faces, which fills those same flat faces back to front and draws the outline over them.
- Depth is the coordinate the projection throws away, and it can be put back as color. Switch it on when a wireframe is hard to read, because it is what tells the near face of a shape from the far one.
- A large model is not projected unasked. Above a point count you set in the render settings the block says how big the picture would be and offers a button, and asks once when the model in the followed viewer changes.
- Adjustable point size and line width, light or dark ground.
- The three axes are made same length before projecting. As result, if data's X-Y-Z values differ by orders of magnitude, it comes out as a line rather than a picture.
- Both screen axes are given the same span, so a unit is the same length on each.
- It follows its source: whenever that viewer renders, the projection is rebuilt.
2.9 Context menus
Context Menu is open when clicked on the Viewer with secondary mouse button. Context Menu is content dependent.
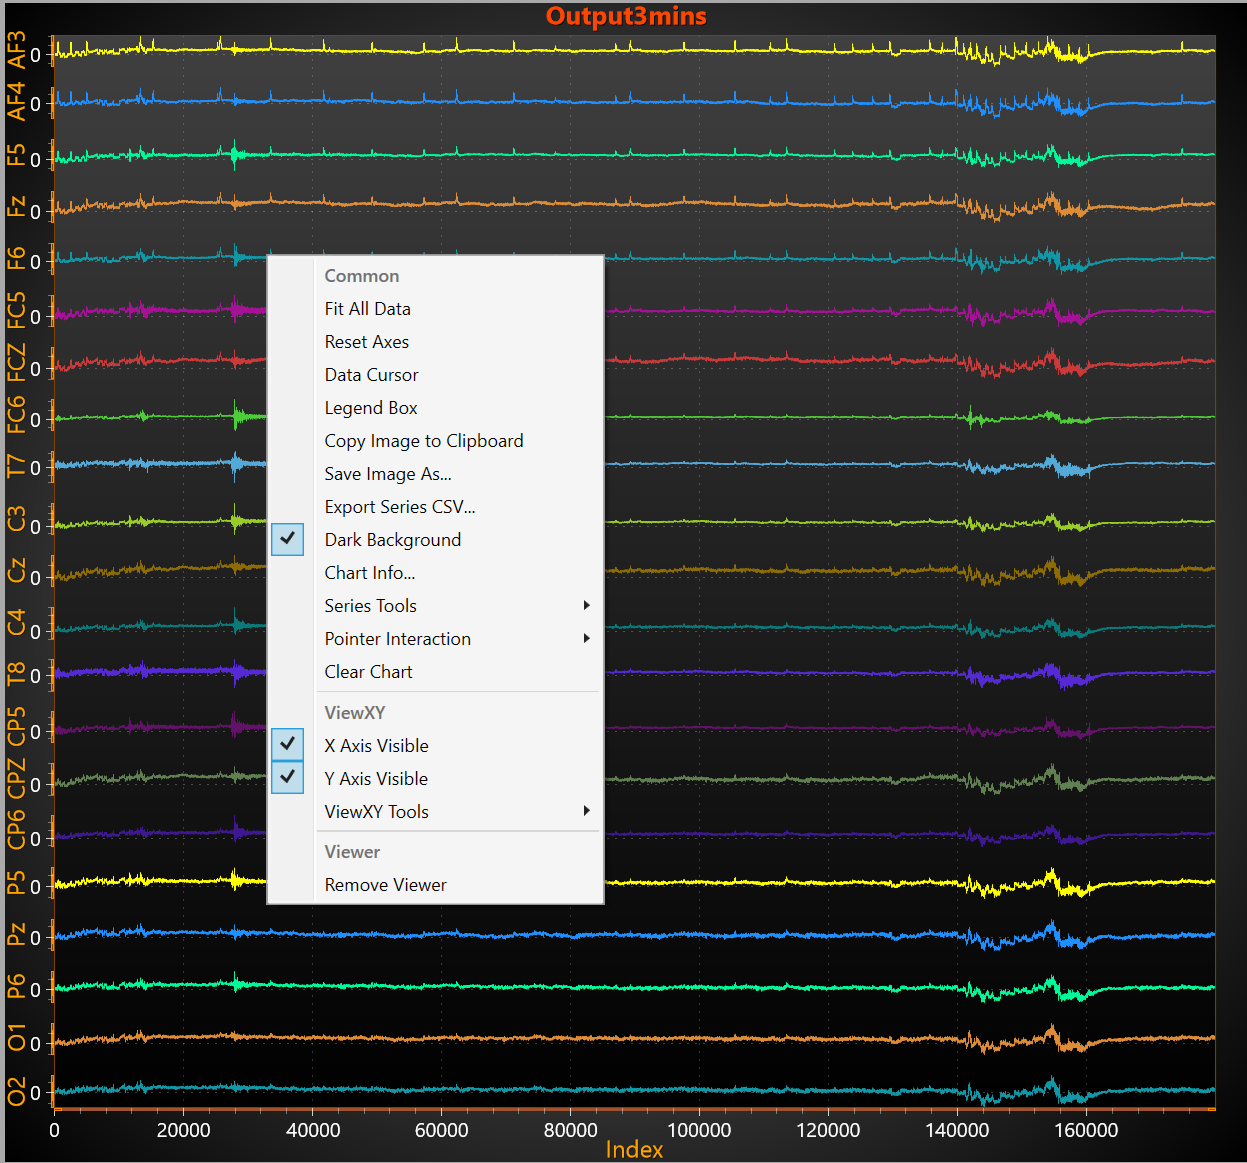
An example of Context Menu when ViewXY chart under UDP.
| Common |
|---|
|
| ViewXY |
|---|
|
| View3D |
|---|
|
| Mesh Models |
|---|
|
Pointer Interaction lists every series and object in the chart with a checkable entry each, and an All above them that sets the lot and writes it into the render settings so the next render keeps it. A mesh gives up its triangle tracking with its interaction, which is the part that can be demanding on a model of millions of triangles.
The isometric block has its own menu: Drawn As, Model Drawn As, Colour by Depth, Point Size, Line Width, Dark Background, Copy..., Save... and Remove....
2.10 Tool windows
Here is the list of dialog-windows used by Universal Data Parser (UDP).
| Window | Does |
|---|---|
| Chart Settings | Future-render settings for the selected target viewer. The dialog edits a copy; OK assigns and saves it, while Cancel discards it. |
| Chart Info | Every series and object in the chart: view, category, name, type, visibility and data count. |
| Section Planes | A clip box per object, with a range slider per axis and six indicator planes. |
| Adjust Mesh Models | Position, rotation and size of each mesh, live. |
| Mesh Transparency | One opacity applied across source-transparent material parts in the chart, with a source-value reset. |
| 3D Point Size | Uniform size for adjustable non-compact 3D point series; mesh geometry and pixel points are excluded. |
| 3D Dimensions | The scene box, with a reset to what the render created. |
All of them are closed when the viewer that opened them is disposed or its chart is reset.
Section Planes
If View is based on View3D and it data is visualized ans MeshModel or PointLineSeries3D, then context-menu will allow to select 'Section Planes...'. In dialog window user can select X, Y and Z axes range (in percentage) to shown /clipped. For example, in the image below MeshModel vertices cut in 25-75% X-range and 30-70% in Z-range.
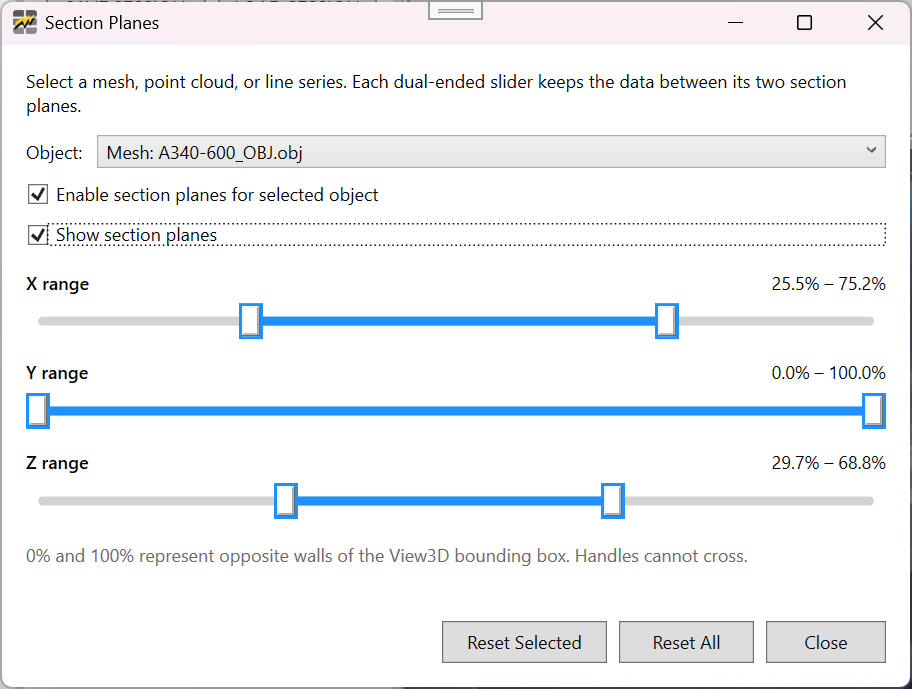
Section Planes dialog window.
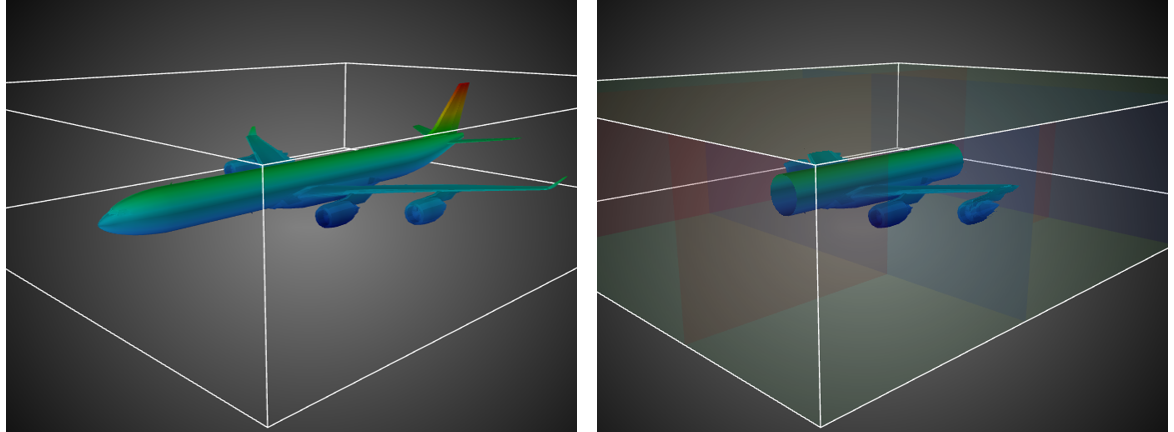
MeshModel example. On the left, normal rendering. On the right clipped same model (according settings above) with Section Planes visible.
2.11 Export
- Copy the chart image to the clipboard as a bitmap.
- Save the chart image: PNG, JPEG, TIFF, BMP, and the vector formats EMF and SVG. The format follows the extension.
- Export the rendered data as CSV, in the same formats this parser reads back: XY, high-low, stock, 3D point-line with color and size, polar, intensity grid and surface grid.
- Save the whole dashboard as a session and load it again.