









LightningChart .NET v.10.2.1 has been released!
Learn more about the latest improvements in compatibility and optimizations.
Main Changes
We’re happy to announce the third major release of the LightningChart® .NET product line. This LightningChart .NET v.10.2.1 focuses heavily on compatibility improvements. Mainly, we have resolved the issue with .NET Core 3. x and the .NET 5.0 application and added support for .NET 6.0.
In addition, we solved the issue with UWP charts, making now the charting application fully compatible with Microsoft Store.
LightningChart .NET v.10.2.1 Compatibility
We announce the full compatibility of LightningChart .NET v.10.2.1 WinForms and WPF components with .NET application. Also, we’ve added support for .NET 6.0.
UWP Charts Compatibility with Microsoft Store
The UWP charts have been introduced previously in LightningChart 10.0.1. Before it was possible to create and deploy UWP applications, but the requirements for submission to Microsoft Store were not met.
Now the issue is solved and the LightningChart UWP application can be configured to run on all supported architectures (x86, x64, ARM, ARM64).
SampleDataBlockSeries
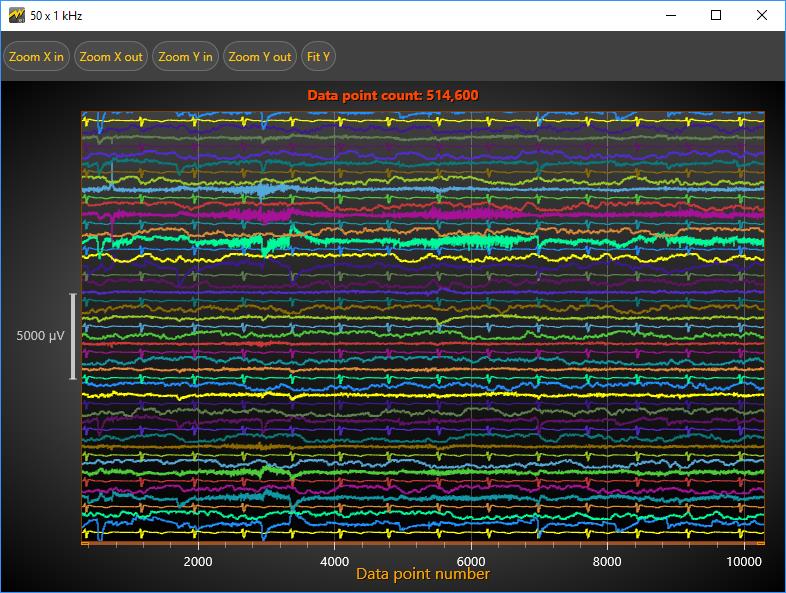
This advanced line series was first introduced in the LightningChart .NET 10.1 release. The SampleDataBlockSeries is a fully optimized line series for real-time applications. Now, in this release, we have improved the performance and stability of SampleDataBlockSeries.
Other Improvements & Features
In this new release, LightningChart .NET offers further improvements such as:
- Better support for DPI awareness and per-monitor awareness.
- A new half doughnut/donut chart has been added.
- A new feature that allows canceling rectangle zooming in ViewXY, ViewPolar, and ViewSmith by pressing Esc-key.
- Annotation behavior and appearance were improved.
- Two new additional technical indicators have been added to the TradingChart visualization.
The interactive examples demo app has new examples: LiDAR, Half-donut, N-body simulation.
See the official release changelog for all the details!
See more news
LightningChart .NET v.12.6.1
LightningChart .NET v.12.6.1 is out now!Features of LightningChart® .NET version 12.6.1In this release we added new features, made several improvements and fixed dozens of errors. We upgraded target framework (from .NET 8.0 to 10.0), added Universal-Data-Parser...
Trend Lines in Trading
Trend lines are among the simplest yet most powerful tools in technical analysis. They help traders visualize market direction, identify potential support and resistance levels, and make more informed trading decisions. Despite their simplicity, trend lines remain a...
Announcement: Baumer as LightningChart customer
Enabling High-Performance Visualization of Industrial Sensor Data with LightningChartDiscover how Baumer uses LightningChart to configure and visualize data from a wide variety of industrial sensors and create responsive, data-rich visualization...
Best Python Charting Library in 2026
Python's charting ecosystem is large, overlapping, and regularly misunderstood. Most comparison guides stop at Matplotlib, Plotly, and Seaborn. This one goes further: it covers what happens when your datasets grow large, your update rates increase, or your chart types...



If you have any questions, feel free to contact us!