LightningChart® .NET Performance Test Results:
SampleDataBlockSeries VS SampleDataSeries
Introduction to the Test: video demonstration
SampleDataBlockSeries is a super-fast line series introduced in the release of LightningChart .NET v.10.1.1. In this line series, the data is stored as memory blocks that dispose of the old data and append new data, easier on memory and CPU.
Since LightningChart v.1, there have been SampleDataSeries with a linear memory array. Both series types are made for fixed-interval data monitoring, used typically in waveform visualization, e.g., medical monitoring (ECG/EKG, EEG, EMG, ExG), vibration monitoring, telemetric and data logger systems, and the audio engineering industry.
SampleDataBlockSeries rendering scientific data visualization algorithms were designed to take better benefit from GPU computation power, freeing up more CPU resources for other processes and tasks.
In the next video, you can take a look at SampleDataBlockSeries:
High-Performance Test Application

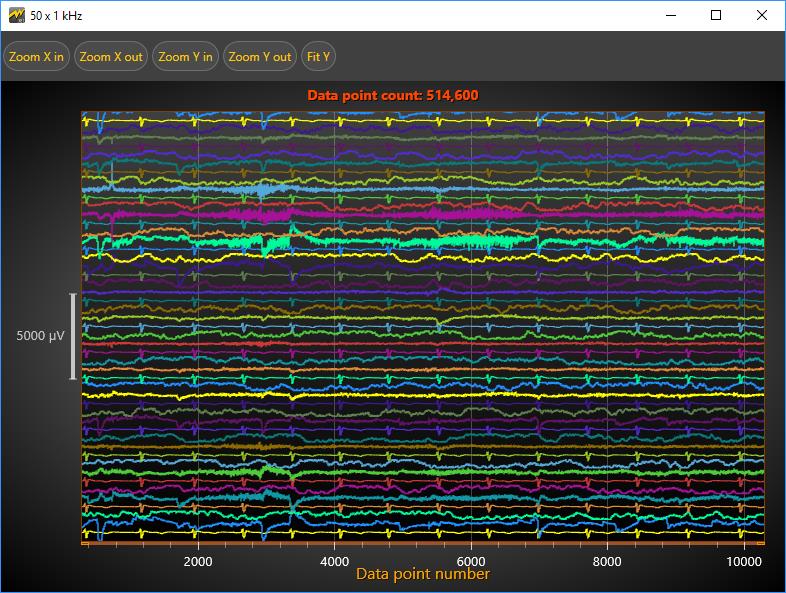
The data read from a .CSV file consisted of real ECG, EEG, and then random data every 3rd series.
The chart windows can be set to the ‘Sweeping’ real-time scrolling mode:


Device Hardware & Operating System Specifications

Performance Test Legend
The test was performed in two modes:
- CPU-saving mode
- High-FPS mode
Criteria Measured
FPS
RAM Consumption
CPU Load
Standard Deviation
Delay in Refreshes
Outcomes & Results of the Test
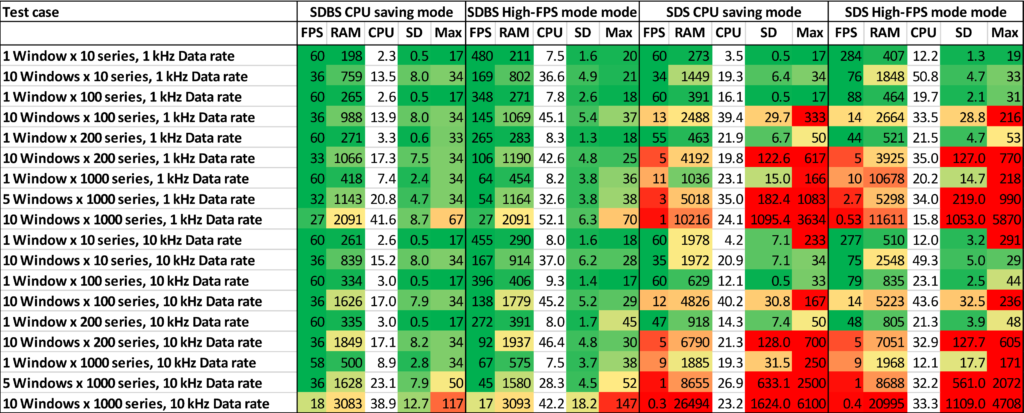
The test results were collected in the next table and each cell was colored based on their meaning for the specific parameter.
Green = Good. Yellow = satisfactory. Red = struggling
Analysis of the Test Results
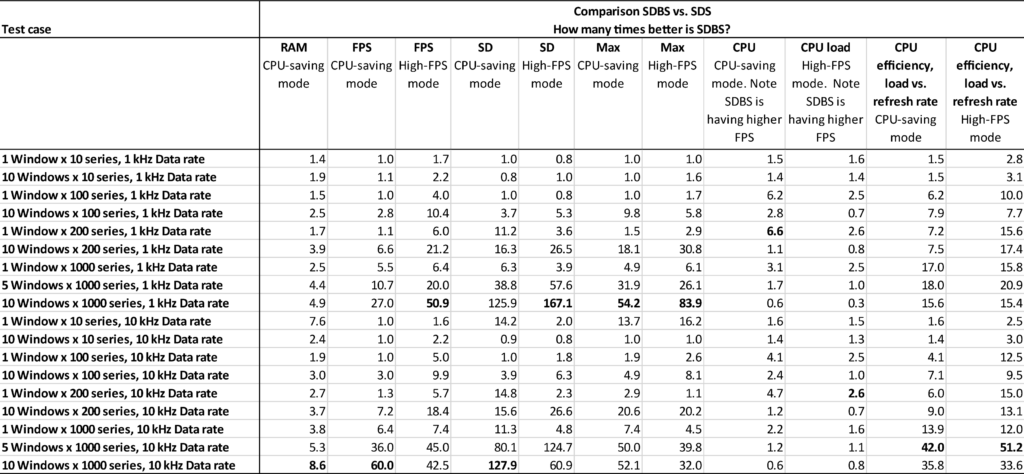
However, by looking at the following table based on the test results, it is possible to compare how many times the SampleDataBlockSeries are better than the SampleDataSeries.
- In RAM consumption, up to 8.6 times better.
- In FPS (CPU-saving mode), up to 60 times better.
- In FPS (High-FPS mode), up to 51 times better.
- In Standard deviation of refresh intervals (CPU-saving mode), up to 128 times better.
- In Standard deviation of refresh intervals (High-FPS mode), up to 167 times better.
- In longest refresh interval durations (CPU-saving mode), up to 54 times better.
- In longest refresh interval durations (High-FPS mode), up to 84 times better.
Commonly in all tests, the CPU load is lower than with the SampleDataSeries, yet keeping the refresh rate higher. Finally, we can calculate how many times more CPU efficient SampleDataBlockSeries is when we relate it to the FPS rate.
- In CPU-saving mode, CPU efficiency is up to 42 times better.
- In High-FPS mode, CPU efficiency is up to 51 times better.
Additional Test & Its Results
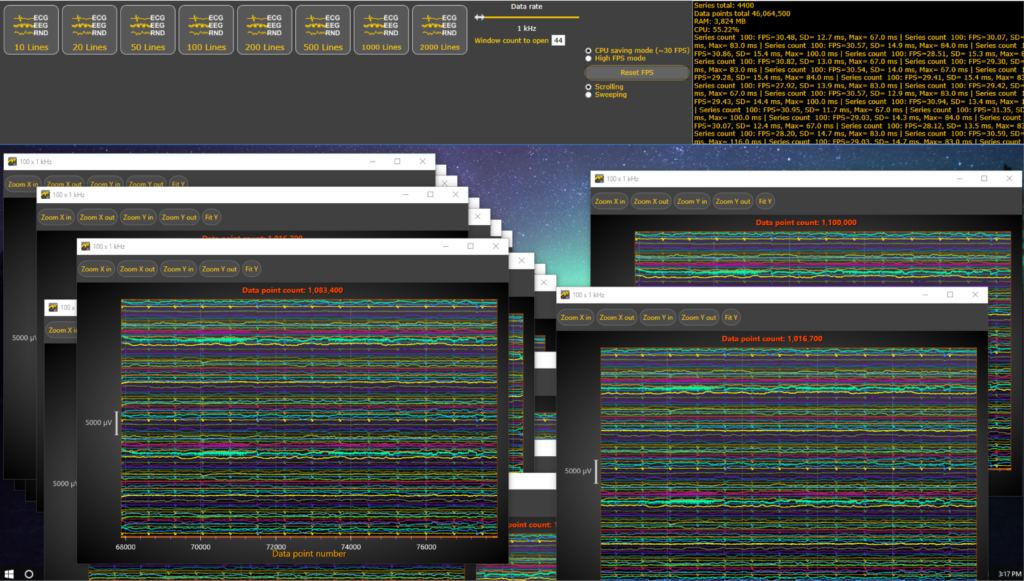
For SampleDataBlockSeries, we can open simultaneously 44 windows.

For SampleDataSeries, we can only open 4 windows simultaneously.

Further Performance Information
Conclusion of the Test
With very low variations in refresh intervals, it provides a smooth monitoring experience which is much better than SampleDataSeries.
Additionally, the SampleDataBlockSeries uses less RAM and CPU resources, provides a higher FPS rate and a significantly better responsiveness to user interactions.


