









LightningChart JS v.3.3.0 has been released!
Announcing the new performance improvements, UI features, & chart types of LightningChart for JS!
We’re introducing 5 new powerful JS charts!
In this new version, we’ve included several new charts as a Dynamic Dashboard example that allows users to dynamically add/remove charts from a view to perform interactive analyses on different data sources. We’ve also included:
1. Geospatial Map Chart
Based on a background map picture with a heatmap laid over it. Find this chart in our interactive examples.
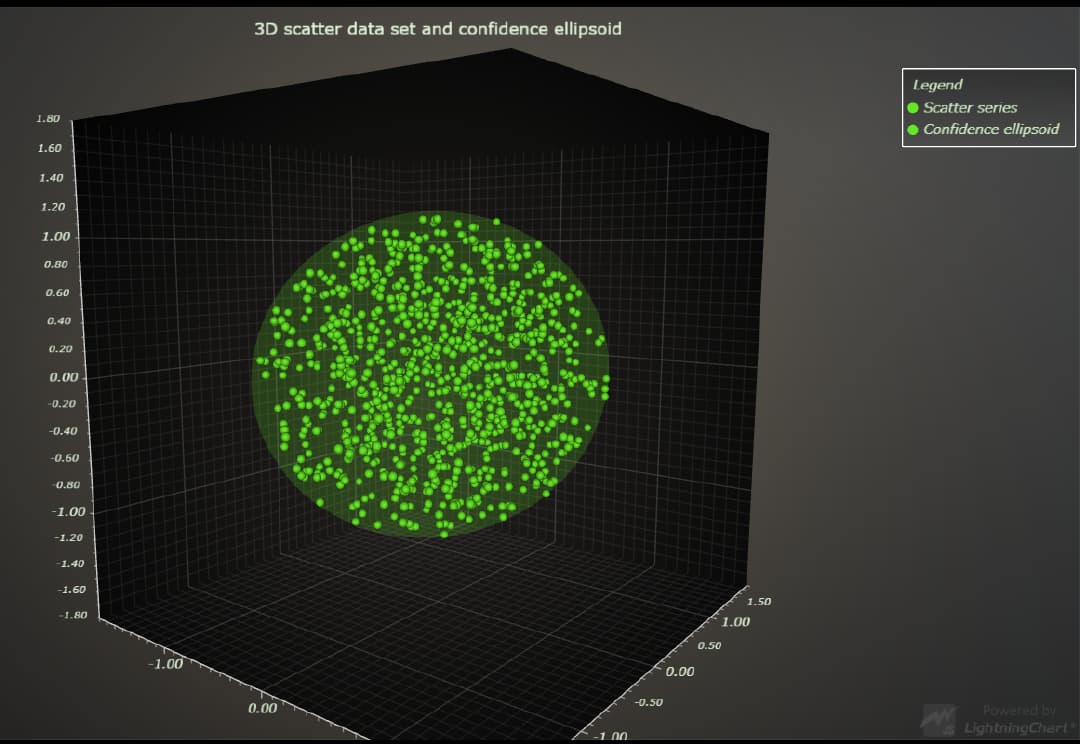
2. Ellipsoid 3D Chart
Frequently used in statistics, the 3D Ellipse chart is helpful in outliers detection.
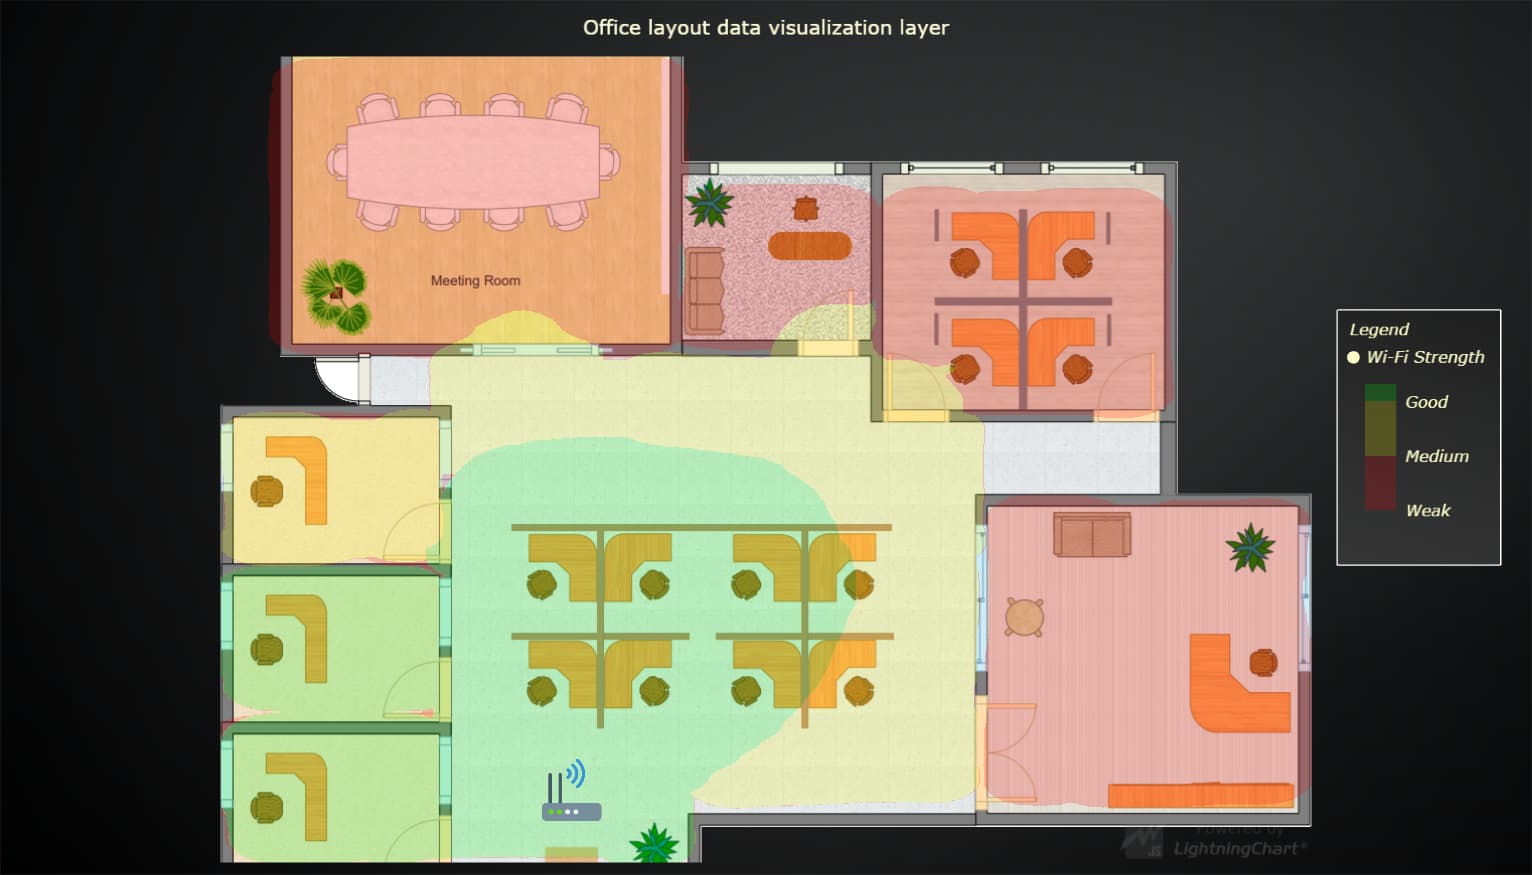
3. Office Wi-Fi Strength Chart
This Office Wi-Fi Strength chart demonstrates how users can load external images and create new visualizations. For instance, this is an office premise that illustrates the Wi-Fi strength.
4. Temperature Anomaly Chart
This is a visualization of a Temperature anomaly index and Atmospheric Carbon Dioxide in parts per million. This chart has two Y axes since it displays two trends in the same time range but with different values.
5. Surface Charts
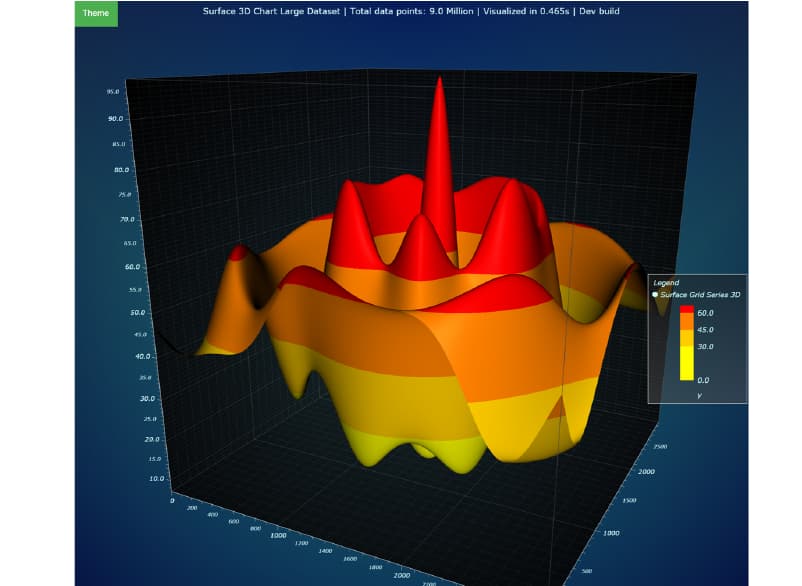
The new Surface chart include intensity surface grid chart, 2D and 3D audio spectrogram chart, chunked surface grid chart, 3D surface grid chart, and surface partial invalidation chart.

Continuously working on performance improvements
We continued to improve the current performance of LightningChart JS heatmaps and some remarkable results are:
- For static heatmaps, the rendering capacity goes from 1.2 billion data points to 5.6 billion!
- The loading speed has increased by 250%!
- The empty heatmap loading speed increased by 10x.
- The overall performance for refreshing and appending heatmaps has significantly improved as well.
Read more about JS heatmaps performance
Additionally, we carried out a new performance comparison for Surface grid charts, here’s a preview of the results:
- Loading 4M data points in Static Surface charts, takes only 152 ms.
- Continuously updating 4M data points in Refreshing Surface charts, consumes only 15.5% of CPU resources at a refresh rate of 10.0 Hz.
- In Appending Surface charts, LightningChart JS is officially the first JavaScript chart in the world to support real-time 3D spectrograms.
LightningChart JS is compatible with WebGL2
WebGL is key in the success of LightningChart and its high-performance rendering capabilities and we’re happy to announce that LightningChart JS v3.3.0 is fully compatible with WebGL 2, the latest version of the web graphics library.
Additionally, LightningChart JS v3.3.0 introduces the Image Fill Styles where you’ll be able to add custom background images or videos. This update also introduces new and more powerful features for visualizing 3D surfaces.
See all the features that LightningChart JS v3.3.0 can add up to your projects:
See more news
LightningChart .NET v.12.6.1
LightningChart .NET v.12.6.1 is out now!Features of LightningChart® .NET version 12.6.1In this release we added new features, made several improvements and fixed dozens of errors. We upgraded target framework (from .NET 8.0 to 10.0), added Universal-Data-Parser...
Trend Lines in Trading
Trend lines are among the simplest yet most powerful tools in technical analysis. They help traders visualize market direction, identify potential support and resistance levels, and make more informed trading decisions. Despite their simplicity, trend lines remain a...
Announcement: Baumer as LightningChart customer
Enabling High-Performance Visualization of Industrial Sensor Data with LightningChartDiscover how Baumer uses LightningChart to configure and visualize data from a wide variety of industrial sensors and create responsive, data-rich visualization...
Best Python Charting Library in 2026
Python's charting ecosystem is large, overlapping, and regularly misunderstood. Most comparison guides stop at Matplotlib, Plotly, and Seaborn. This one goes further: it covers what happens when your datasets grow large, your update rates increase, or your chart types...



If you have any questions, feel free to contact us!



©LightningChart Ltd 2026. All rights reserved.