






Announcing LightningChart JS v.8.2
Introducing new product features, visual quality, performance, and dev experience improvements.
New Product Features
LightningChart JS v.8.2 introduces new product features. Here’s an overview:
Linear Gauge Chart
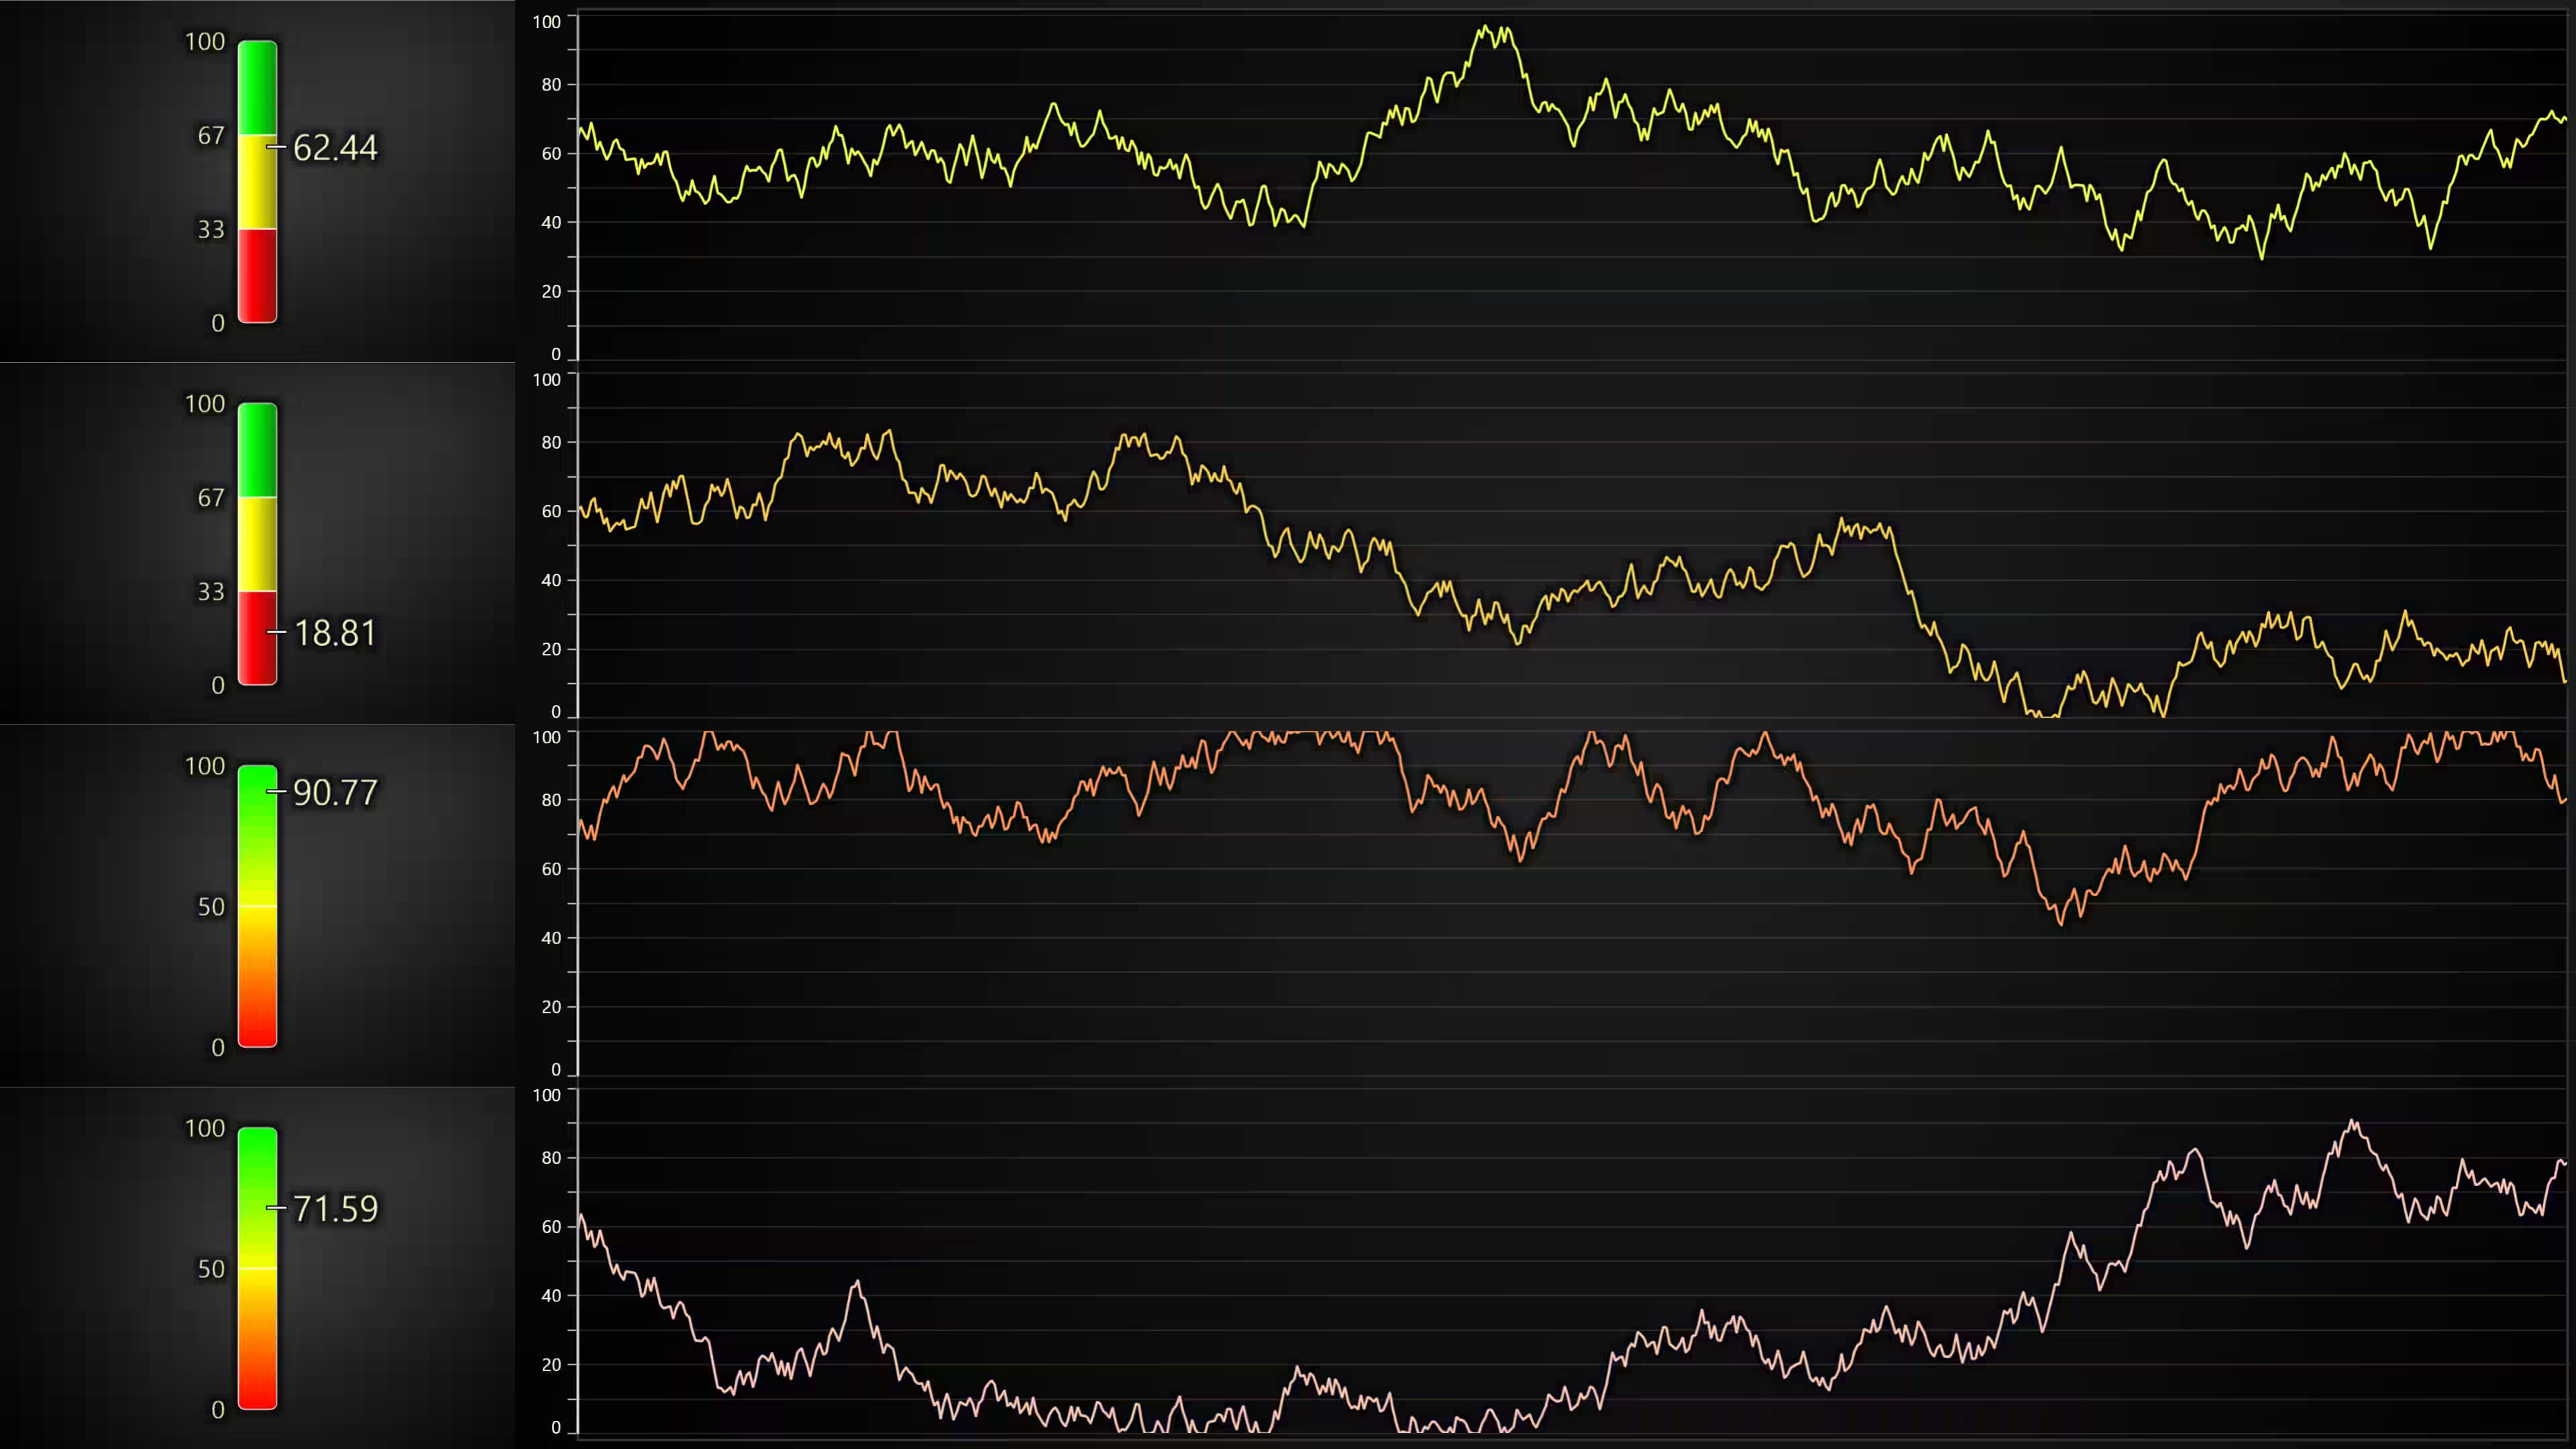
In this 8.2 release, LightningChart JS introduces a new linear gauges chart type featuring real-time data updates, interpolated and non-interpolated color steps, vertical and horizontal alignments, with the ability to display current values, and custom icons.
Render transformations for XY series
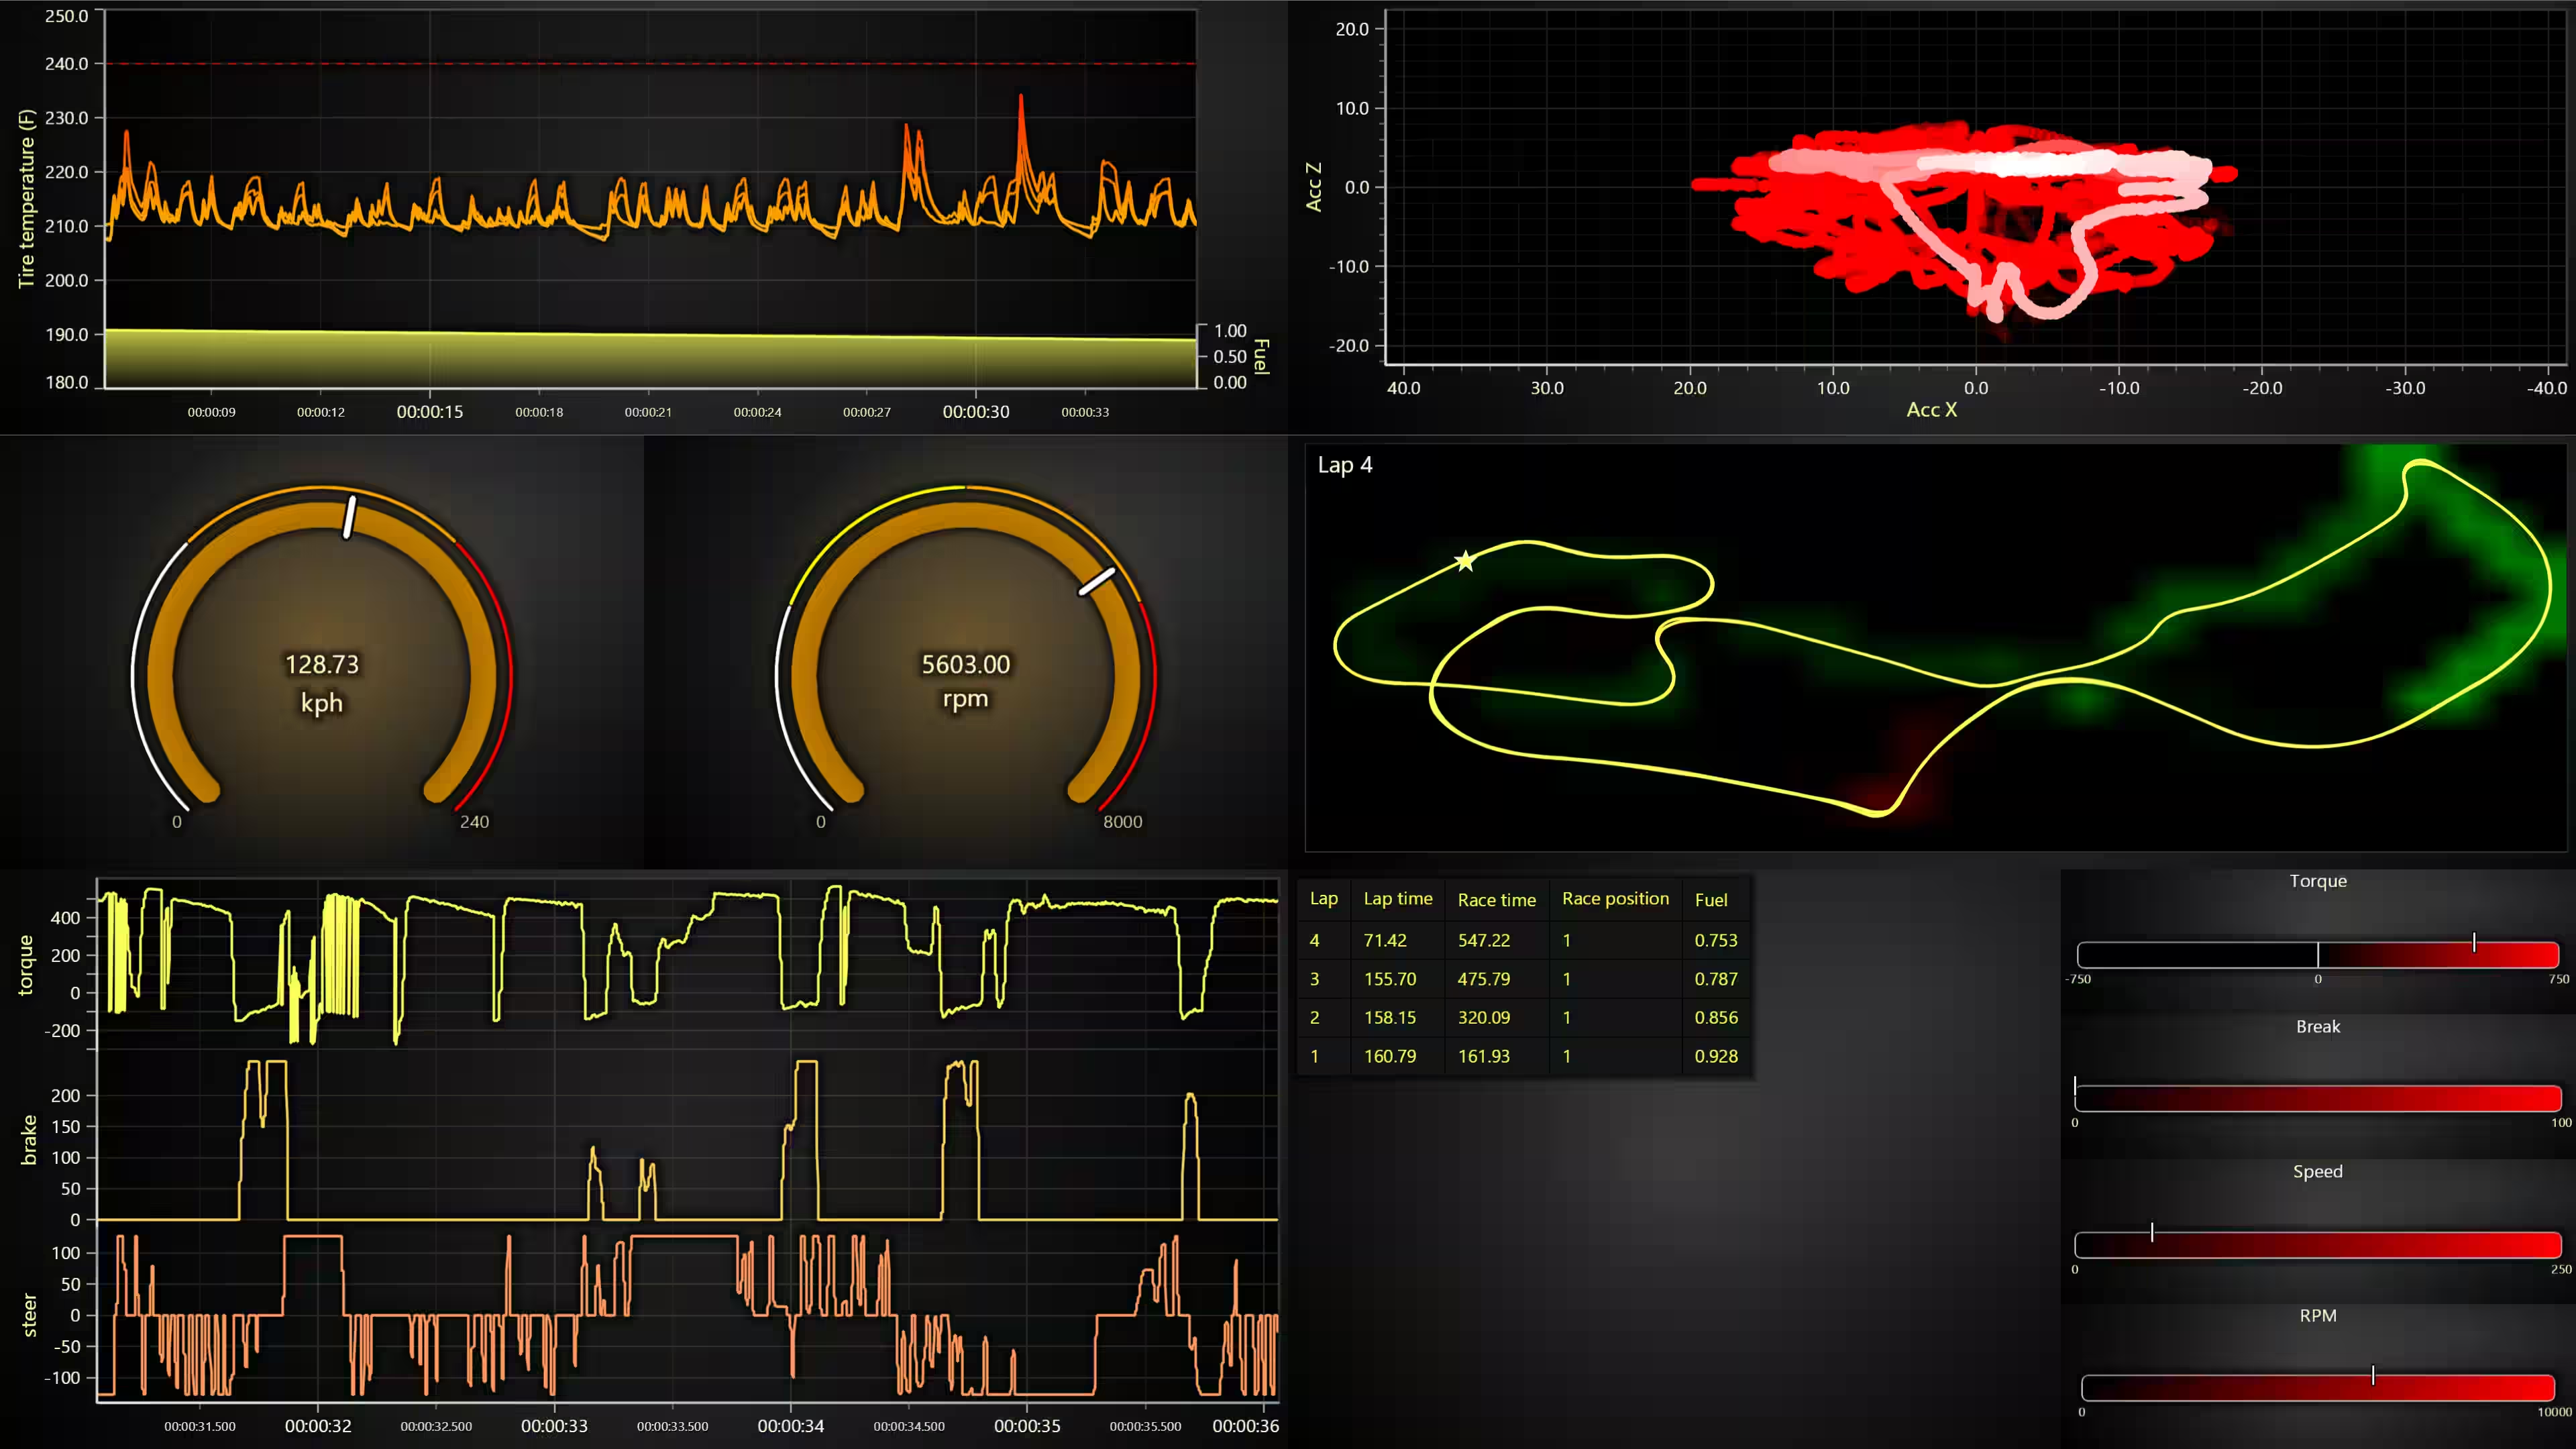
LightningChart JS 8.2 introduces a new API that allows arbitrary affine transformations for XY series. What this means is that the user application code can freely transform already existing data by offsetting and/or scaling it.
This operation is extremely efficient and does not require any re-preparation of data. Arbitrary affine transformations are useful for cases like oscilloscopes.
lineSeries.setRenderTransform({
    x: { offset: 0, scaling: 1 },
    y: { offset: 100, scaling: 10 }
})
API for custom tick placement
This feature was inspired by a use case that allows the user to take full control of where the axis ticks are placed. Axis ticks could already be placed manually using Axis.addCustomTick(), but this is very inconvenient when having to adjust to different zoom ranges, and there are also some performance concerns.
This API also allows specifying tick positions separately between major & minor tick levels.
axis.setTickStrategy(AxisTickStrategies.Numeric, (strategy) => strategy
    .setCustomTickPlacement((info) => [
        { position: 0 },
        { position: 1000 },
        { position: 2000 },
    ])
)
High-precision 3D axes
- easily displaying timestamped data even when zoomed far in
- displaying large or small numbers
const chart3D = lc.Chart3D({
    defaultAxisX: { type: 'linear-highPrecision' }
})
Visual Quality Improvements
In this release, we are improving the sensitivity configuration of the XY points visibility. This feature was inspired by a use case that could allow configuring how early or how late points are displayed when zooming into XY axes. By default, the points are not displayed until the user zooms in so far that the points would not overlap.
// Example, reduce sensitivity to make points appear later than normally when zooming
series.setPointDisplayBehavior({ sensitivity: 0.5 })
Performance Improvements
This version introduces the capability to temporarily pause chart updates. This performance improvement API is intended for use cases where a chart exists in the application but is not currently visible, or when you specifically want to stop it from processing updates until a later time.
chart.setPauseRendering(true)Developer Experience Improvements
LightningChart JS 8.2 paid special attention to training reference materials for AI and LLMs. We have seen how LLMs are trying to find their place in software development. However, LLMs are inherently poor at working with specific 3rd party libraries, such as LightningChart JS, because their training data is a mix of new and old versions, and they tend to mix APIs from different libraries. For this purpose, we now manage agent-ready references for using LightningChart JS.
How to use?
Simply load our LLM-optimized documentation files to your project and add a single prompt rule for your agents:
You MUST always use the local files lcjs-docs-llms.txt and lcjs-api-llms.txt as the only sources of truth for all matters regarding how to use LightningChart JS library / lcjsWe tested this approach with Claude code (Opus 4.5, Sonnet 4.5). To download these files and read about the latest tips of how to use LightningChart JS with LLMs, visit our dedicated LC JS – AI documentation.
Non-numeric data property storage in DataSetXY
Previously, DataSetXY could only store numeric data, and for normal cases, this is not a problem. However, sometimes users’ data points also include string / boolean information. This improvement allows storing them alongside numeric data, which makes it easy to access them in cursor formatting, readback, solve nearest, or interactions with series.
const series = chart
    .addLineSeries({
        schema: {
            x: { pattern: 'progressive' },
            y: { pattern: null },
            extra: { nonNumeric: true },
        },
    })
    .appendSamples({
        x: [0, 1, 2, 3, 4],
        y: [0, 10, 5, 8, 9],
        extra: ['a', 'b', 'c', 'd', 'e'],
    })
    .setCursorFormattingOverride((hit, before) => {
        return [...before, ['Extra', '', String(hit.sample['extra'])]]
    })
New Chart Examples
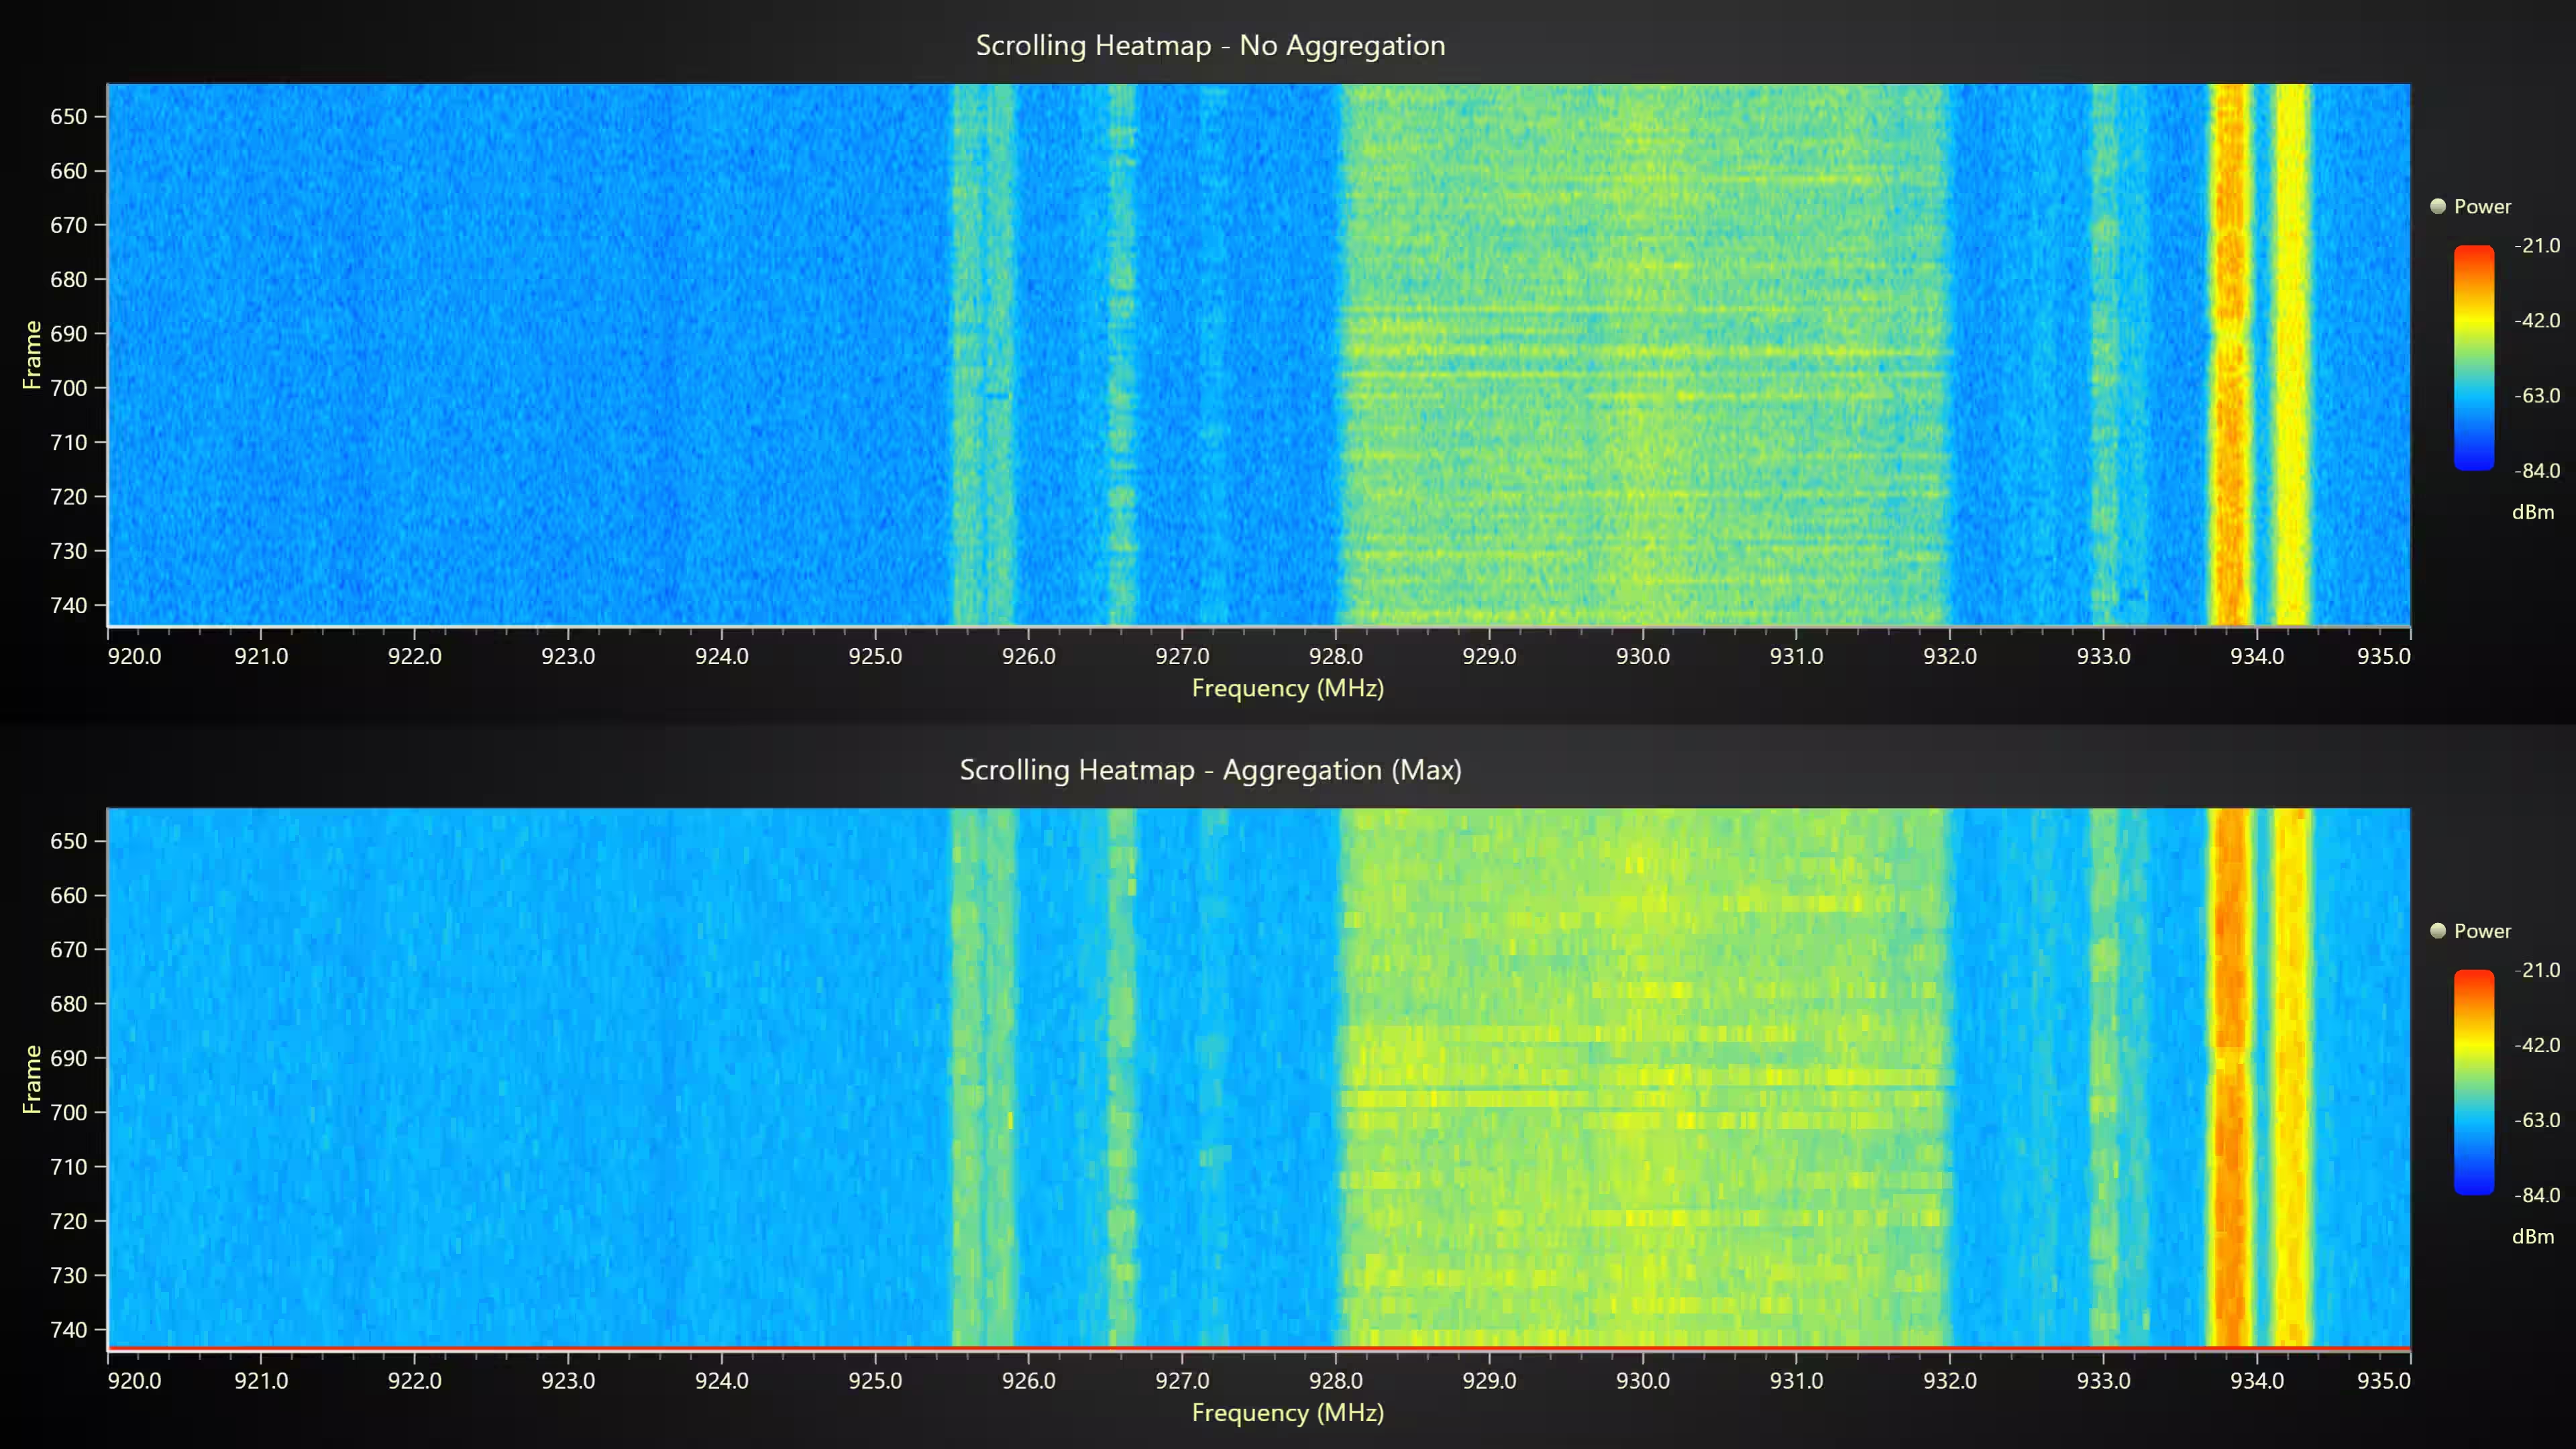
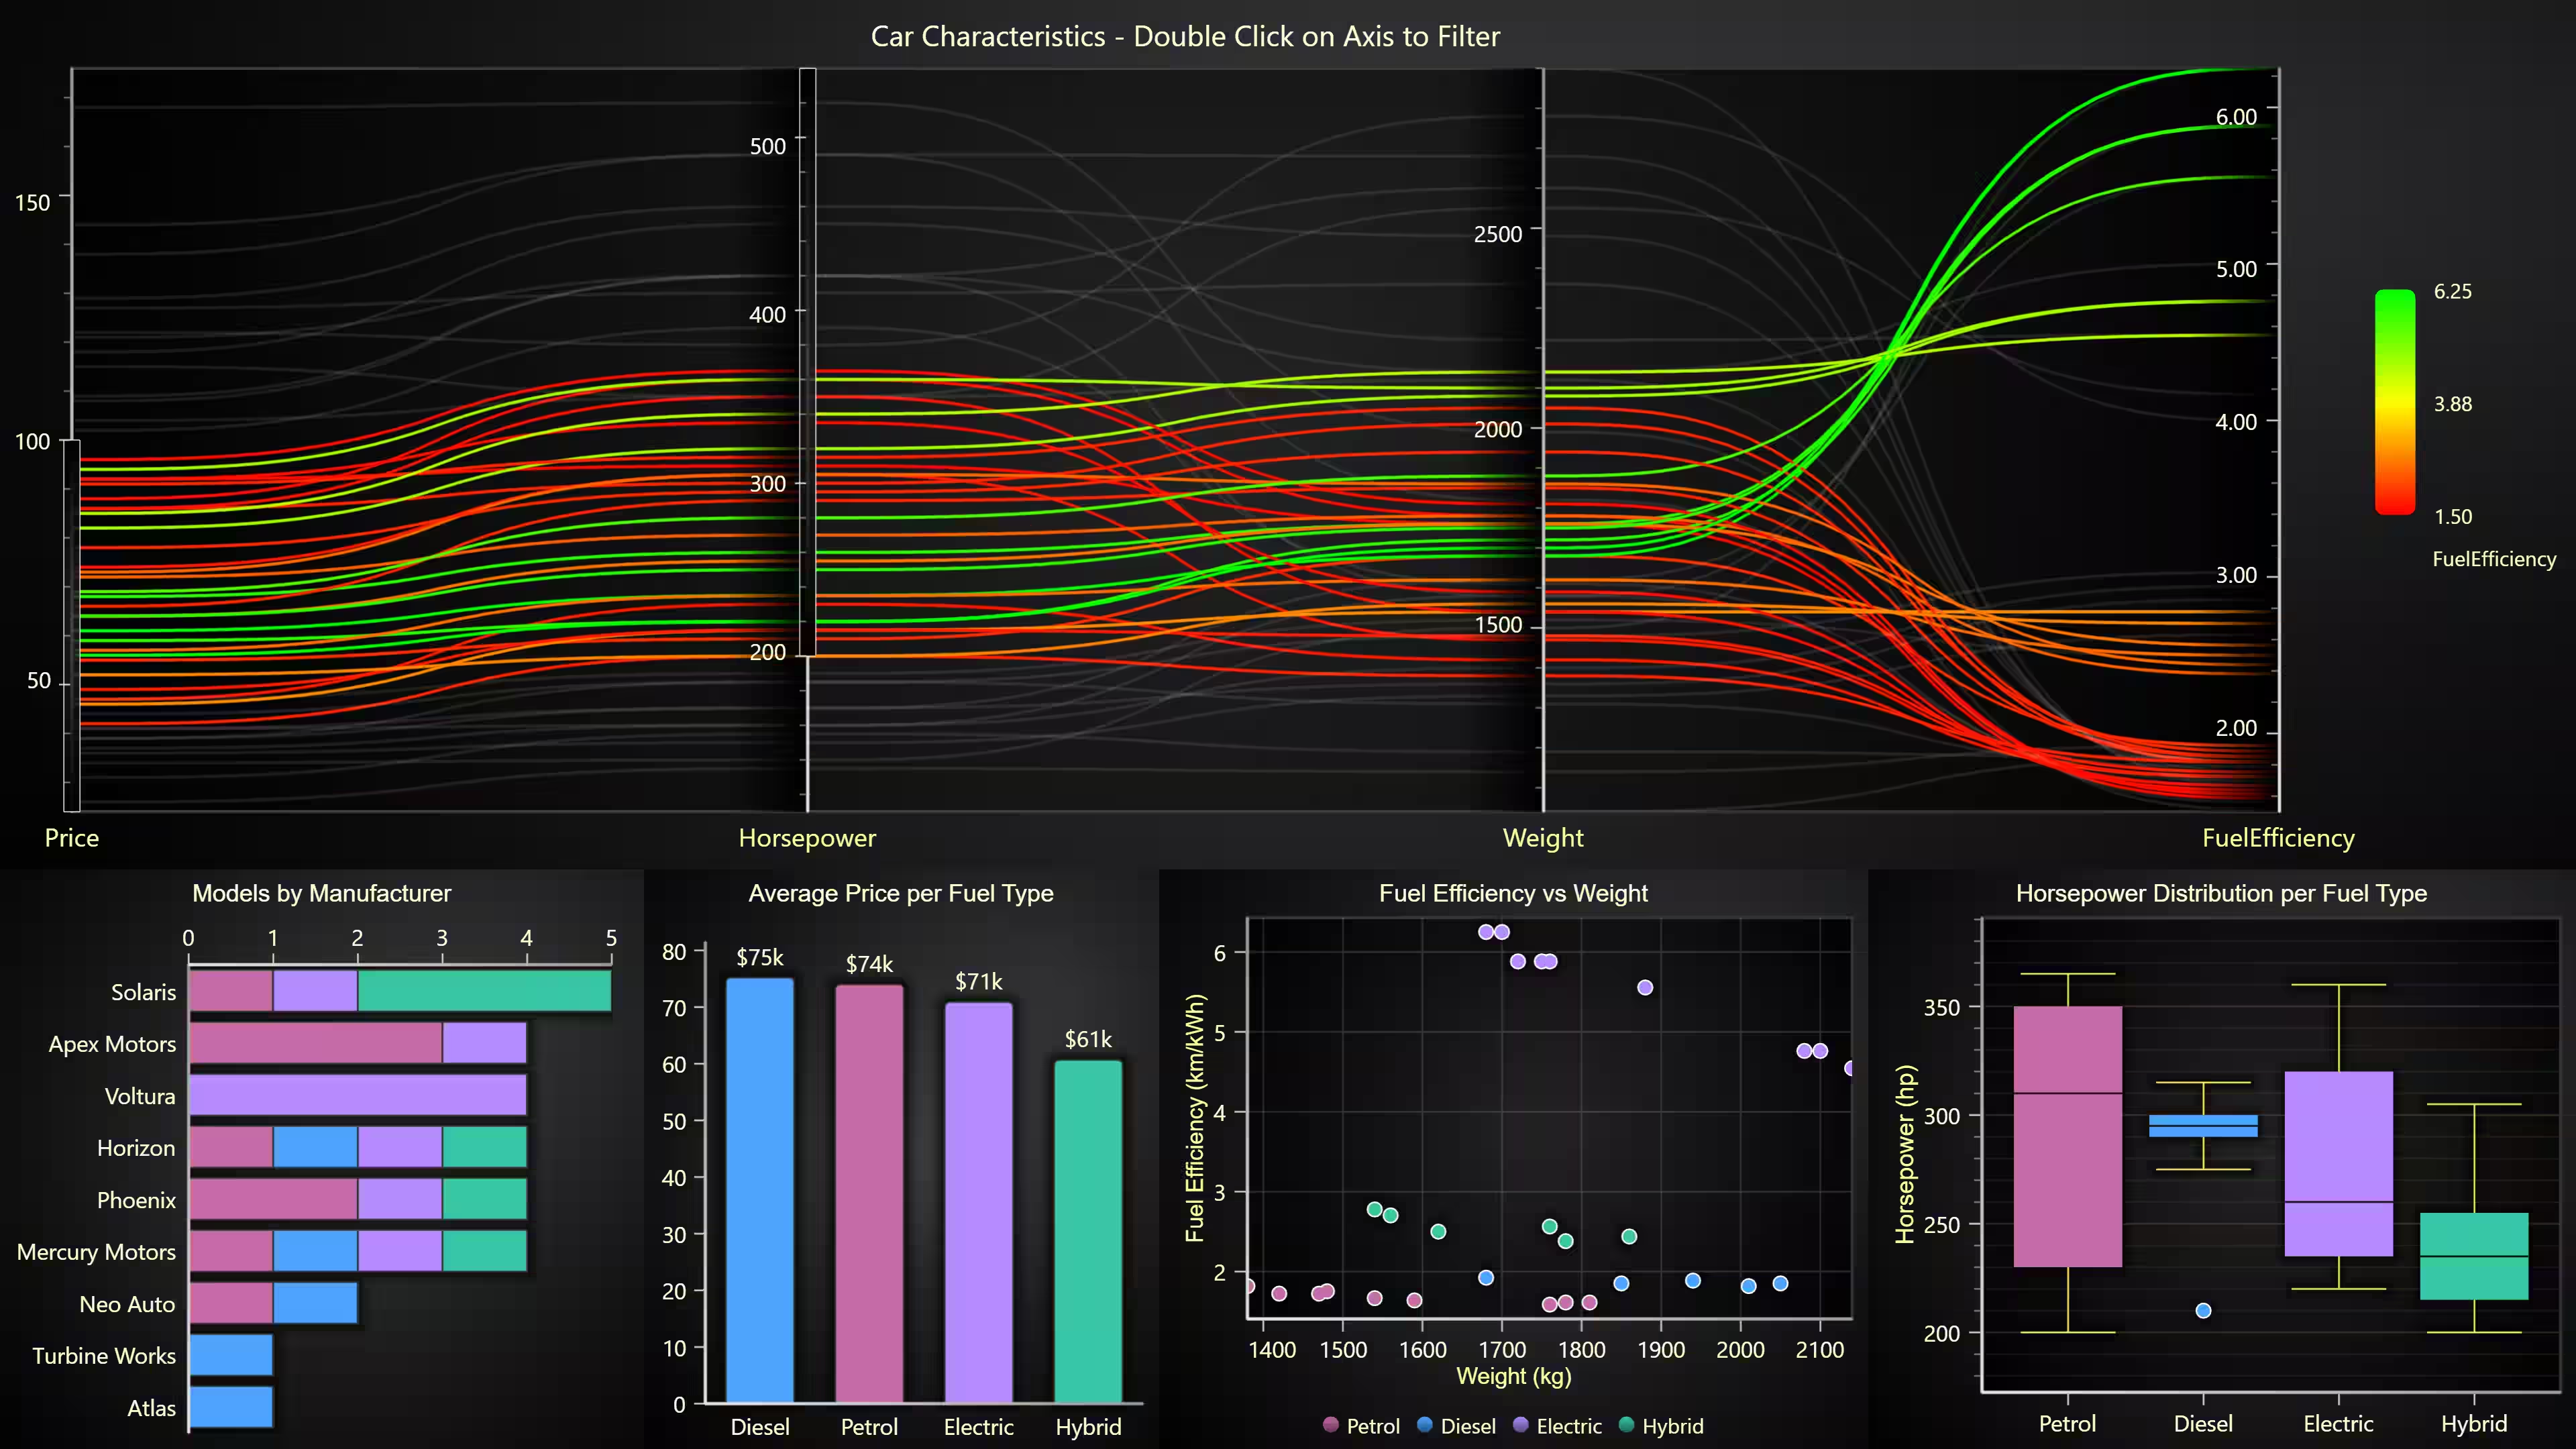
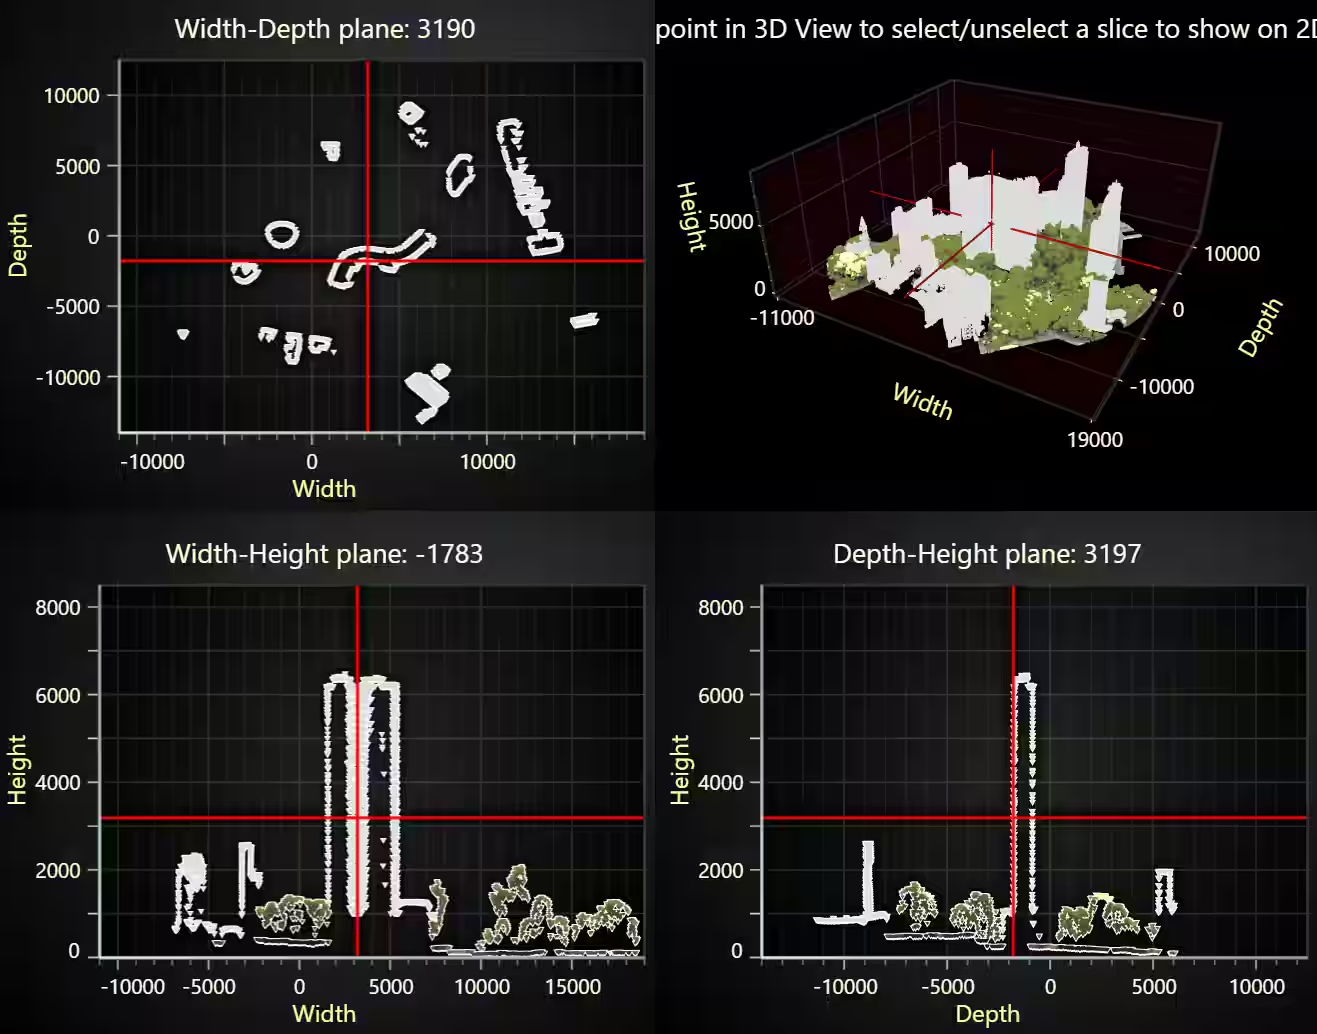
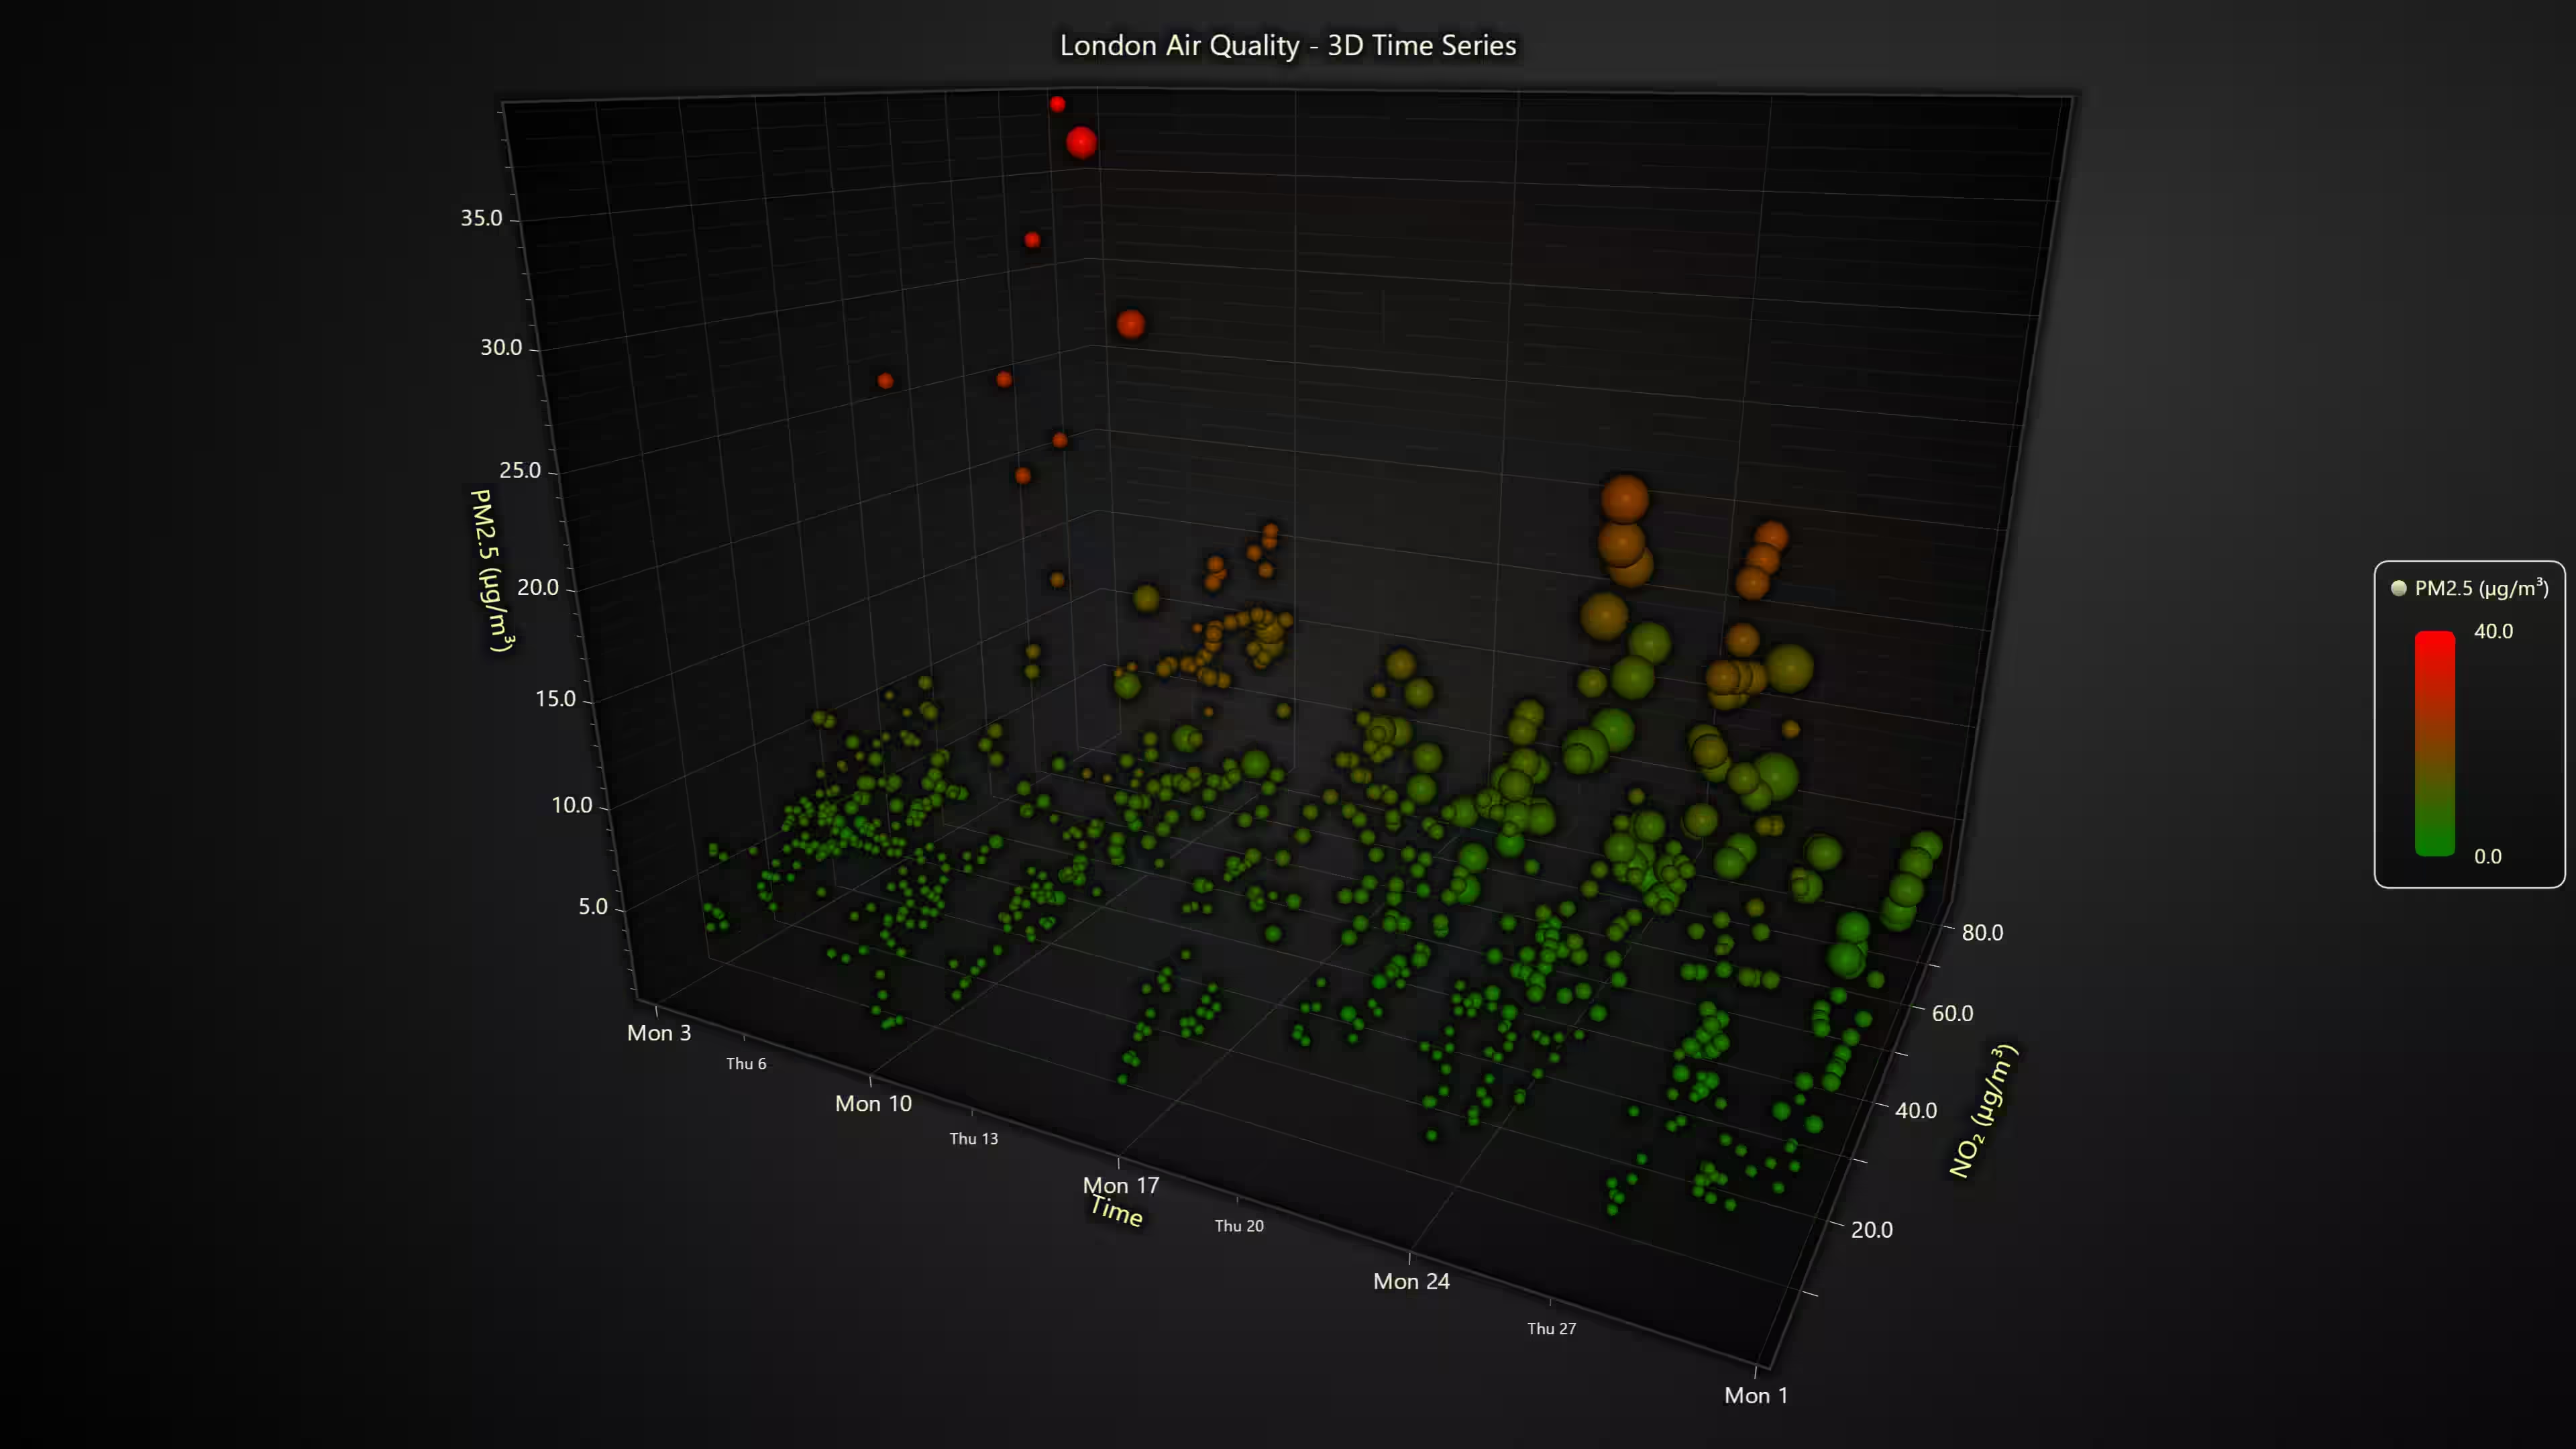
This release introduces six new chart examples:
Get started with LightningChart JS v.8.2
To learn more about this release, visit the documentation.
See more news
Best Telerik Charts Alternative in 2026: GPU Performance for WPF, WinForms, and Web
Telerik from Progress is a comprehensive UI component suite covering WPF, WinForms, ASP.NET, Blazor, and JavaScript. The charting components: RadChartView for WPF and WinForms, and Kendo UI Charts for web and Blazor, arrive bundled with the suite purchase. For teams...
Streaming Data Visualization with WebSockets (2026): The Complete Tutorial
Every WebSocket tutorial on the internet shows the same thing: a server sends a random number every second, a chart updates. It works. The demo looks great. Then you deploy to production, your IoT sensors push 800 updates per second across twelve channels, and the...
Best ScottPlot Alternative in 2026: GPU Rendering, 3D Charts, Cross-Language Support
ScottPlot is genuinely excellent for what it is: a free, MIT-licensed, actively developed .NET plotting library with an honest focus on interactive large-dataset display. The GDI+ rasterized renderer — which draws the entire chart as a pixel bitmap rather than...
Using Fibonacci Tools in Trading: A Practical Guide for Market Analysis
Using Fibonacci Tools in Trading: A Practical Guide for Market AnalysisTechnical traders rely on various tools to identify potential support, resistance, and price targets. Among the most widely used are Fibonacci tools, which are based on the mathematical sequence...





If you have any questions, feel free to contact us!
©LightningChart Ltd 2026. All rights reserved.