


LightningChart JS v.7.1 has been released!
The v.7.1 release includes new product features, improved developer experience, and more.
New Product Features
LightningChart JS v.7.1 introduces new product features. Here’s an overview:
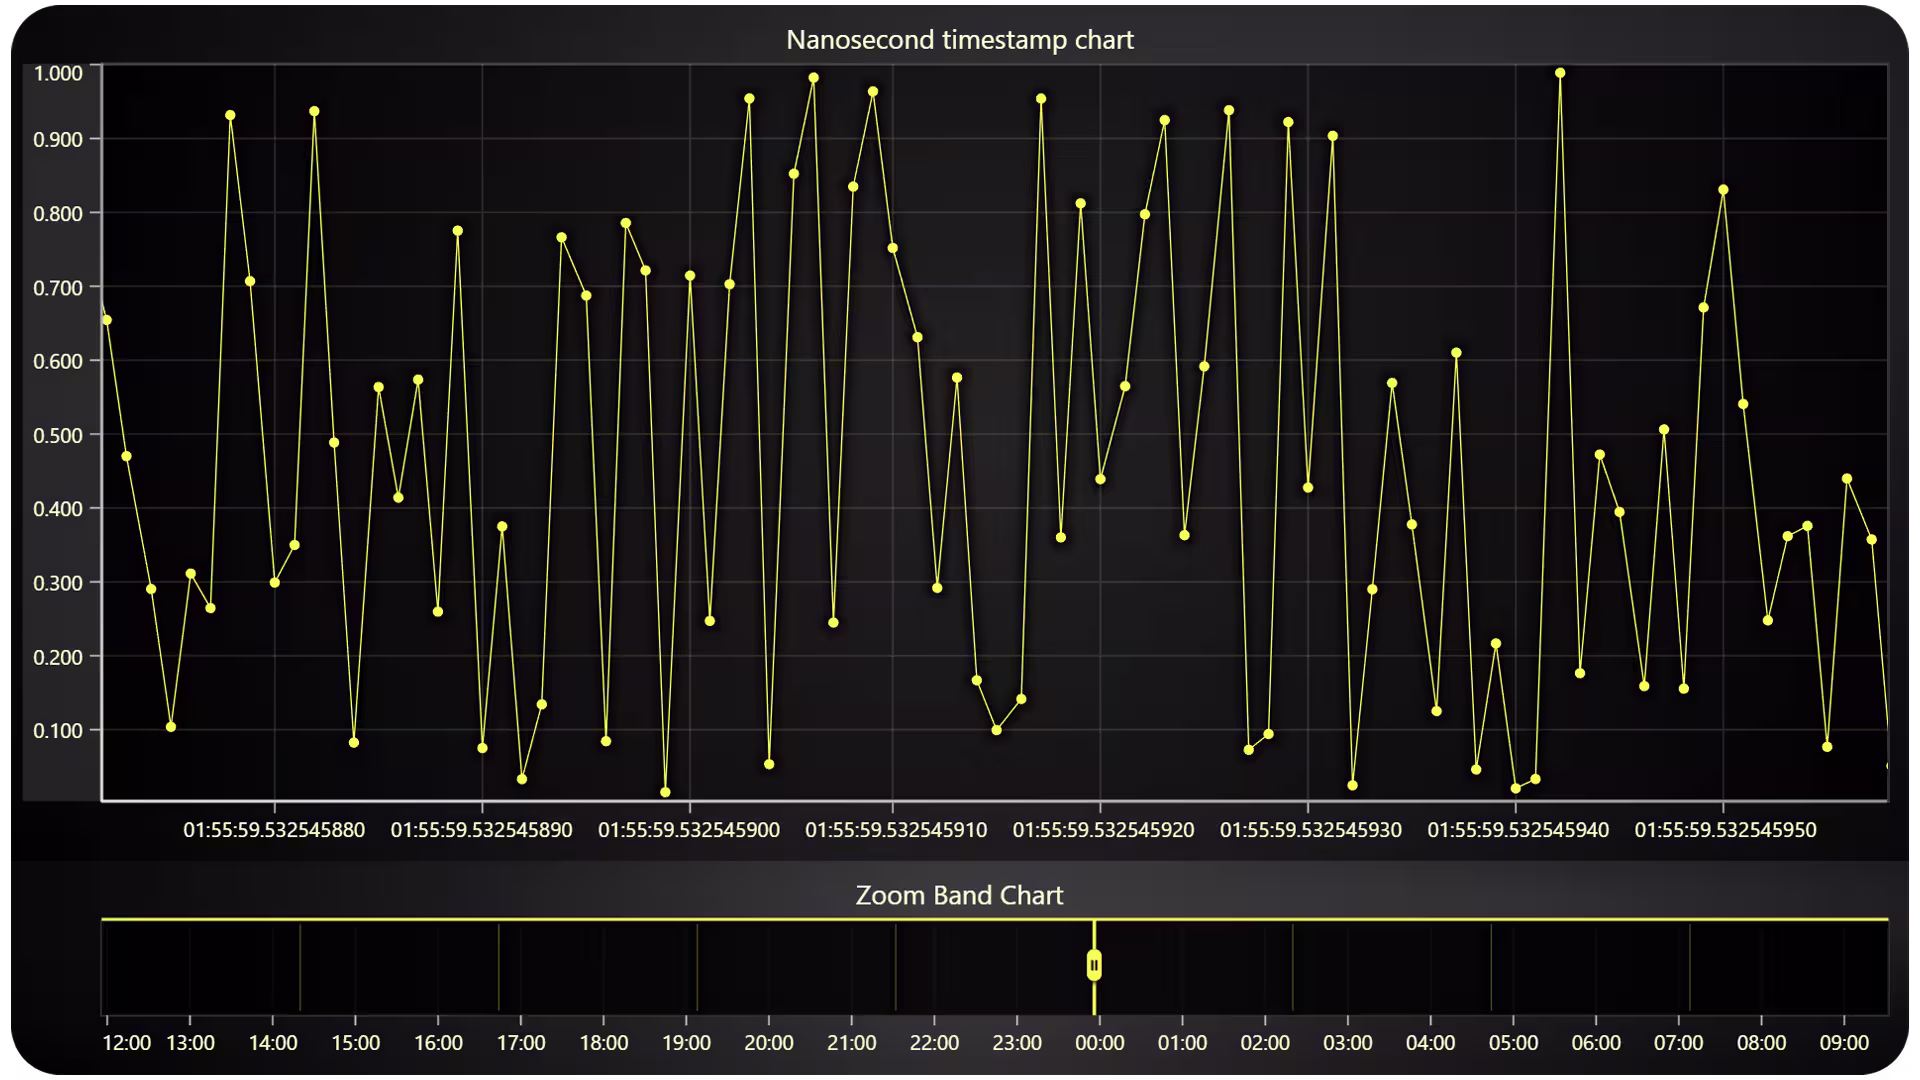
Nanosecond Timestamp Support
Version 7.1 introduces enhanced Date-Time axis capabilities with nanosecond support. Users can now zoom to micro and nanosecond levels for detailed time-based data analysis, surpassing previous millisecond limitations.
Nanosecond timestamps should typically be provided as BigInt64. This enhancement positions LightningChart JS as a leading web charting library with explicitly mentioned nanosecond timestamp support. Read more about nanosecond timestamps.
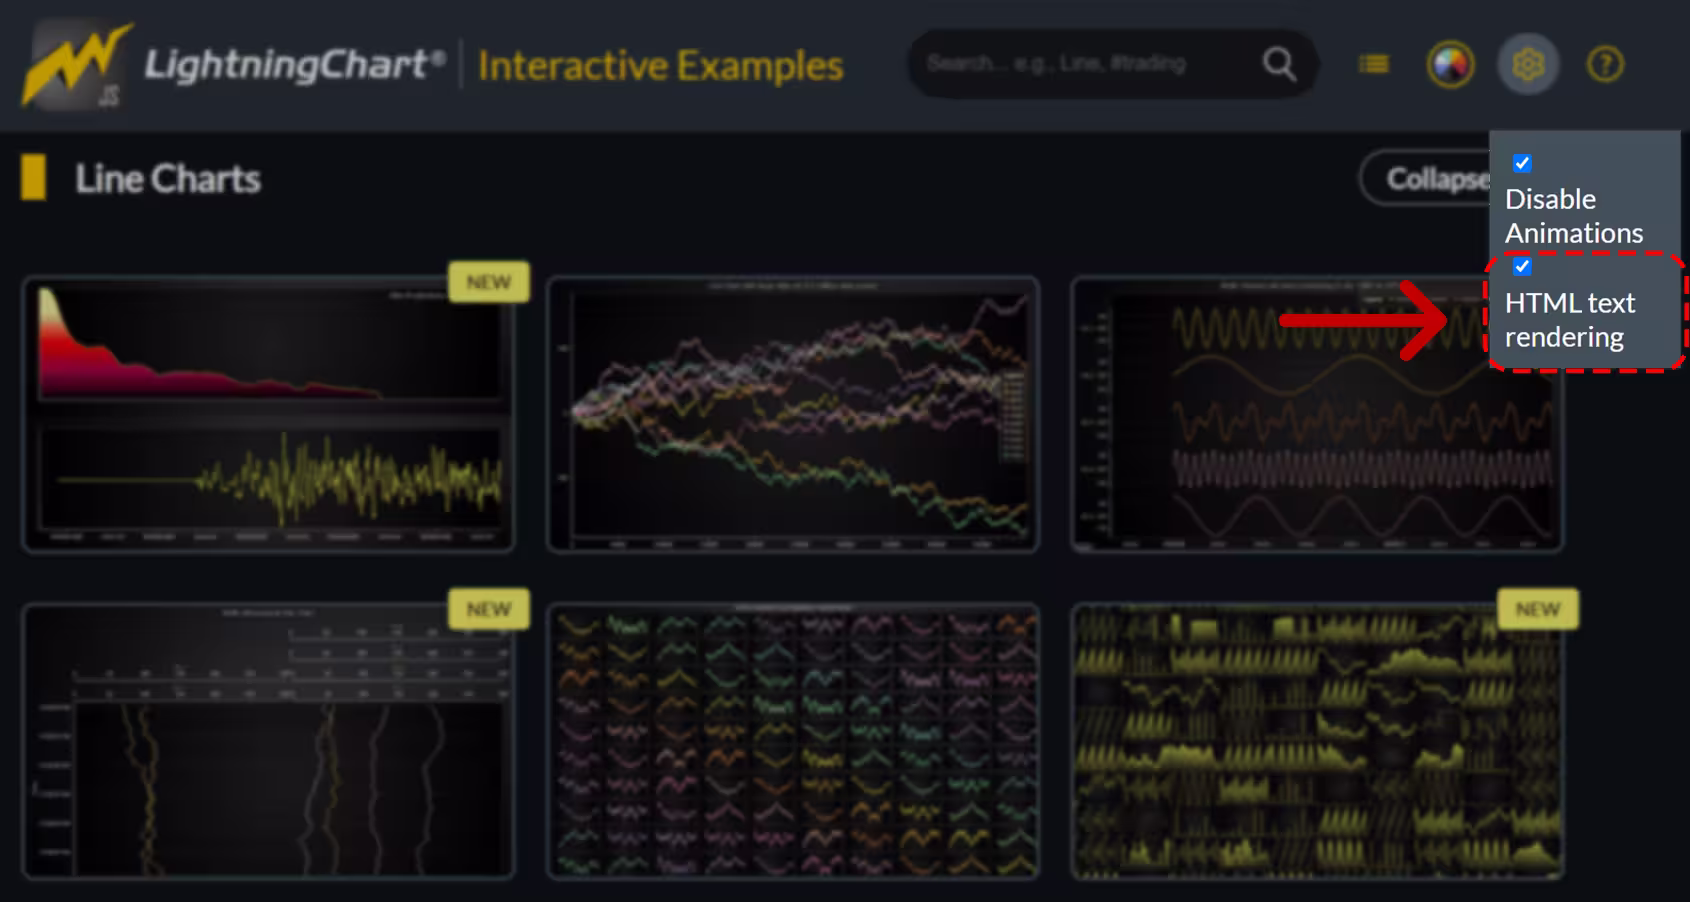
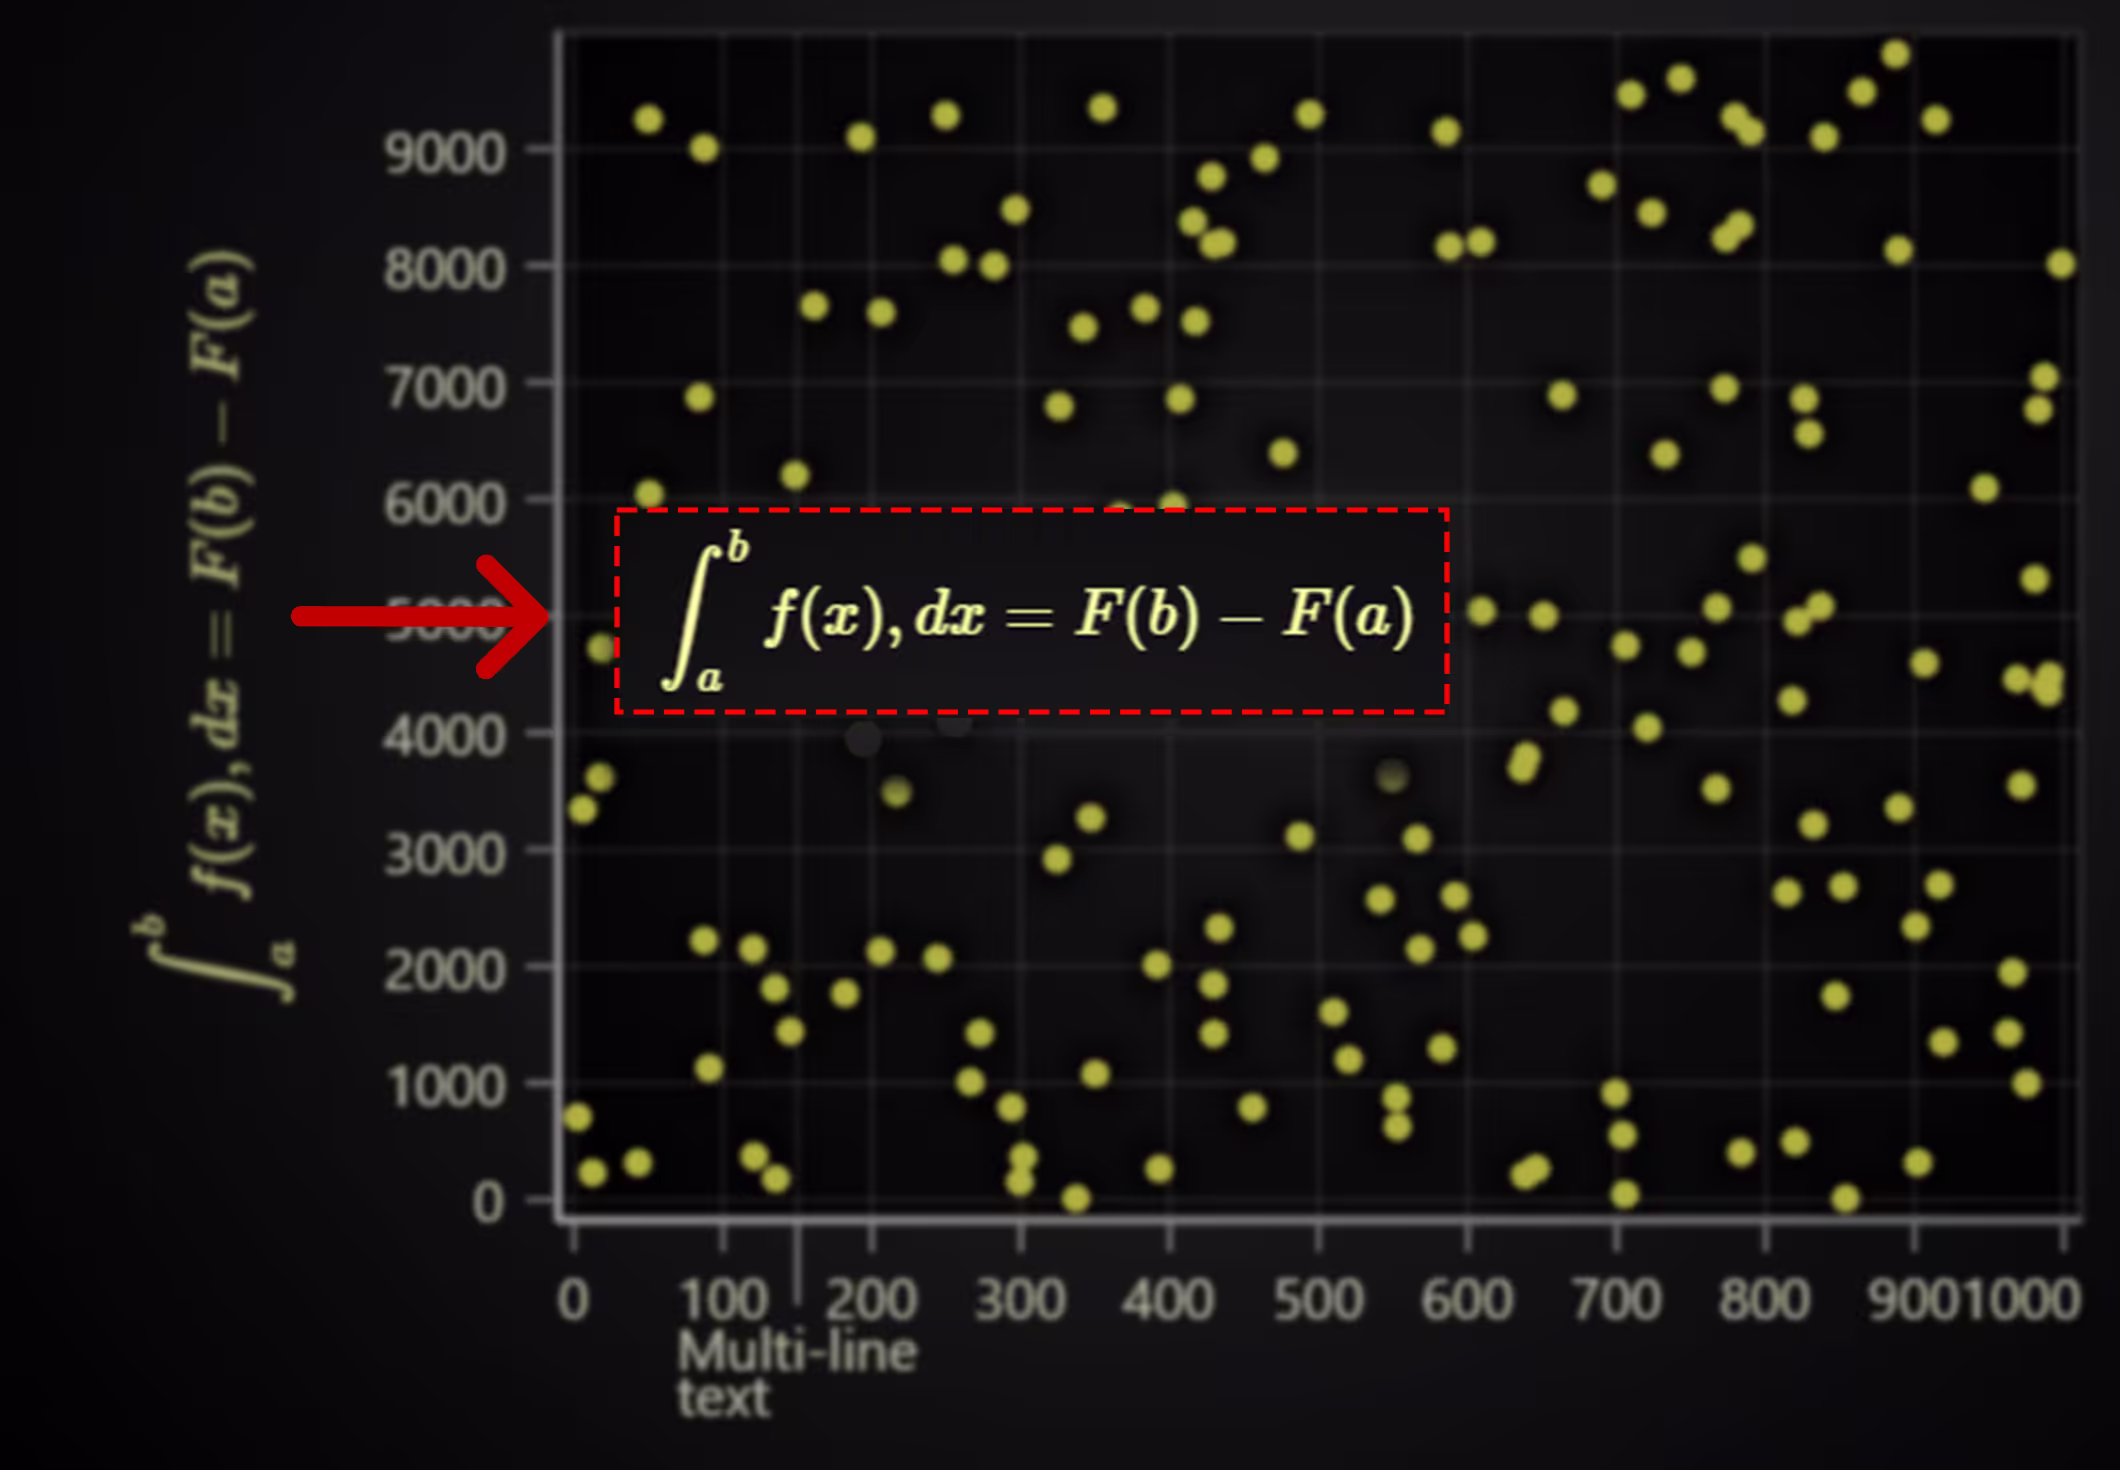
HTML Text Rendering
Version 7.1 introduces an option for HTML text rendering. This alternative to the default WebGL rendering enhances text sharpness and enables the display of advanced text formats such as LaTeX and multi-line text. Note that using HTML text rendering may impact overall performance compared to WebGL rendering. Read more about this feature.
Real-time scrolling axis
Version 7.1 introduces a new scrolling mode for axes, specifically optimized for batched data updates (e.g., data arriving every few seconds). This complements the existing scrolling mode designed for high-frequency data streams, providing smoother scrolling behavior for less frequent data arrivals.
chart.axisX.setScrollStrategy(
  AxisScrollStrategies.scrolling({
    realTime: true,
  })
),
New axis fitting modes
Version 7.1 introduces new fitting modes for axes, offering more control over how the axis scales to data. Some of these new fitting modes include:
- Top (Default): Fits the axis to display all data within the current visible range, consistent with previous behavior.
- Center: Fits the axis against the entire dataset, maintaining a stationary value axis.
- Bottom: Anchors the axis to a specific start value (e.g., 0) and fits the end against the entire dataset.
These new modes are implemented with extensive configuration options to accommodate diverse automatic axis behaviors based on user requirements.
Developer Experience Improvements
Version 7.1 introduces a new utility function that simplifies retrieving the data extents associated with any specific axis. This provides a convenient way to programmatically determine the minimum and maximum values of the data currently linked to an axis.
chart.axisX.getSeriesDataRange() // { min: number, max: number } | undefinedTheme up/down scaling. Version 7.1 introduces a new scaleTheme API. This quality-of-life function allows for symmetrical scaling of all visual elements within a chart, including font sizes, paddings, tick lengths, and button sizes.
This is particularly useful for adapting charts to different screen sizes, such as mobile layouts, without altering the chart’s overall dimensions within the user interface.
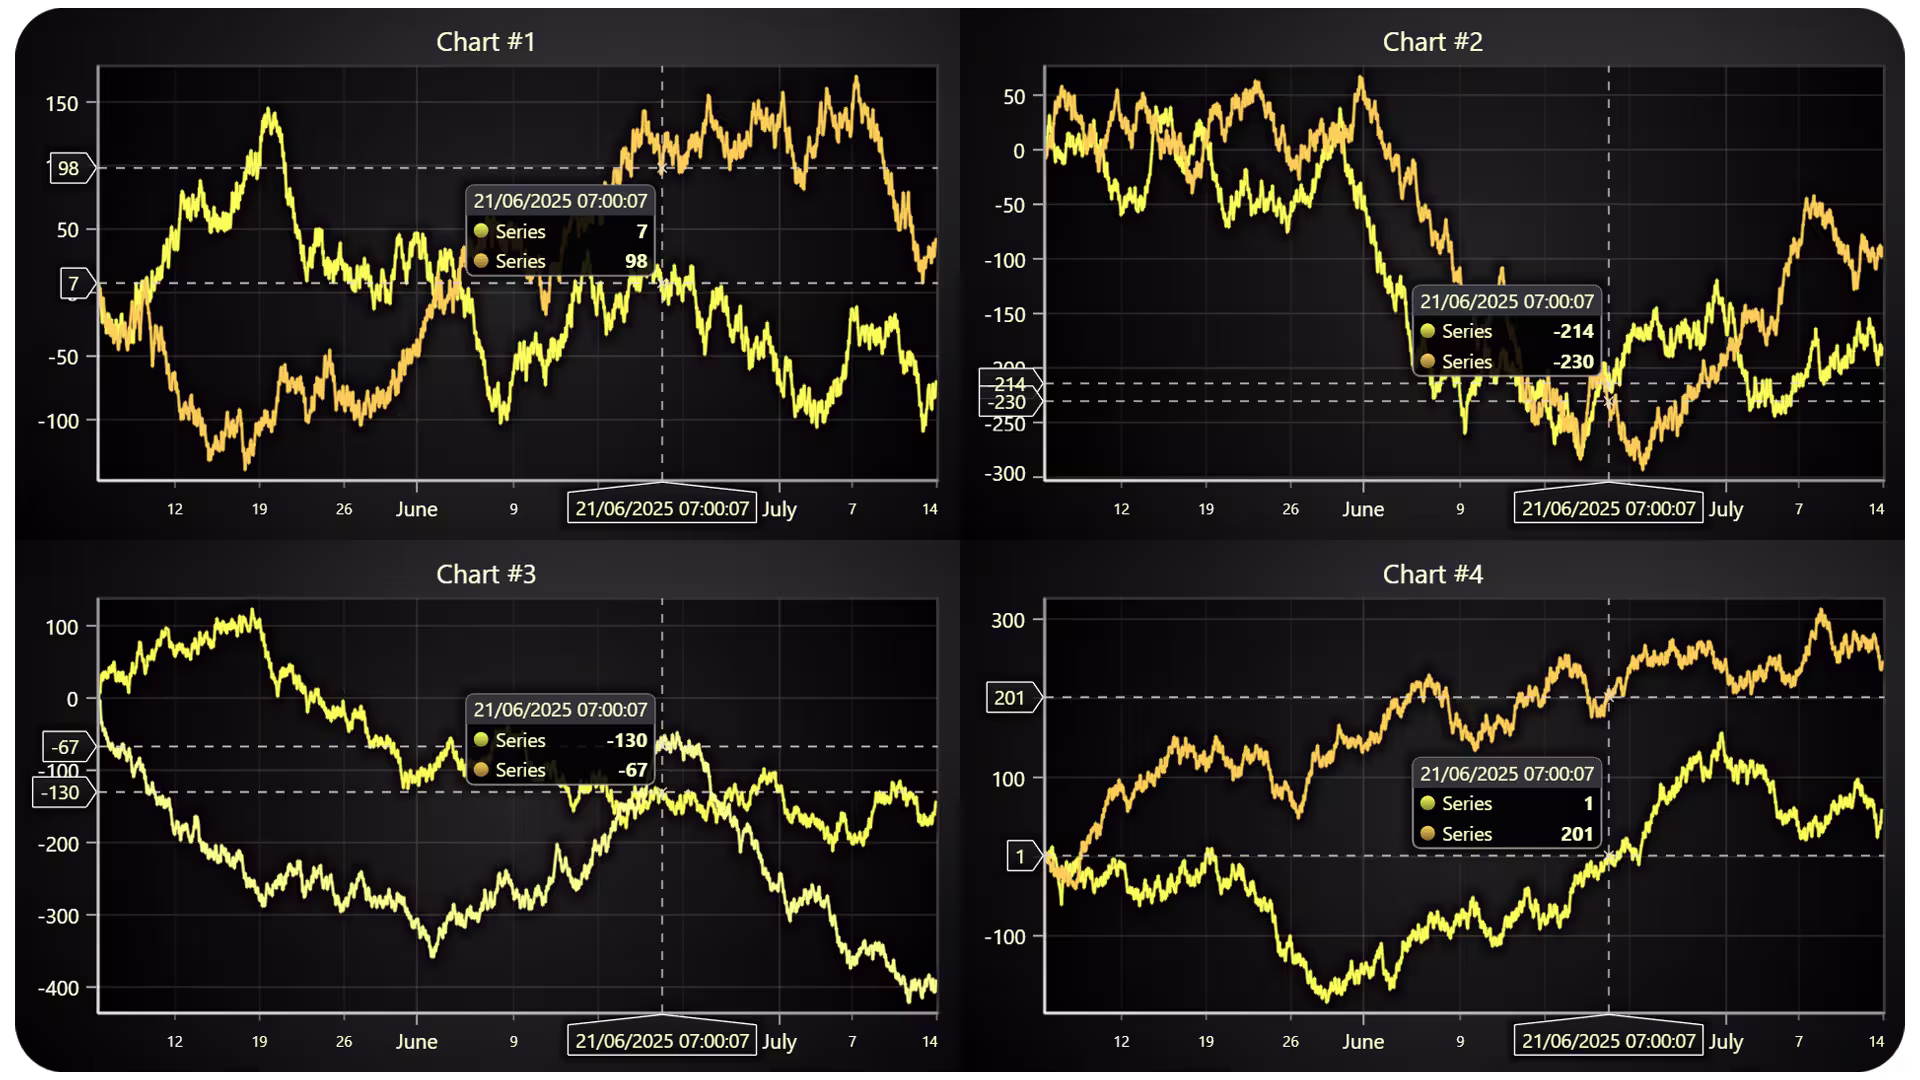
New Chart Examples
Other improvements
Mobile Interactive Examples Improvements. Interactive Examples have a better mobile experience. For instance, the chart space usage is reduced when opened on a mobile divice, therefore, the majority of examples have a better fit into the view.
Get started with LightningChart JS v.7.1
LightningChart JS 7.1 is a backward-compatible release. For more information, you may consult the changelog.
See more news
The Head and Shoulders Pattern in Technical Analysis
The Head and Shoulders Pattern in Technical Analysis The Head and Shoulders Pattern in Technical Analysis The Head and Shoulders pattern is one of the most recognized and widely used chart patterns in technical analysis. It is considered a reliable reversal pattern...
Best Telerik Charts Alternative in 2026: GPU Performance for WPF, WinForms, and Web
Telerik from Progress is a comprehensive UI component suite covering WPF, WinForms, ASP.NET, Blazor, and JavaScript. The charting components: RadChartView for WPF and WinForms, and Kendo UI Charts for web and Blazor, arrive bundled with the suite purchase. For teams...
Streaming Data Visualization with WebSockets (2026): The Complete Tutorial
Every WebSocket tutorial on the internet shows the same thing: a server sends a random number every second, a chart updates. It works. The demo looks great. Then you deploy to production, your IoT sensors push 800 updates per second across twelve channels, and the...
Best ScottPlot Alternative in 2026: GPU Rendering, 3D Charts, Cross-Language Support
ScottPlot is genuinely excellent for what it is: a free, MIT-licensed, actively developed .NET plotting library with an honest focus on interactive large-dataset display. The GDI+ rasterized renderer — which draws the entire chart as a pixel bitmap rather than...


If you have any questions, feel free to contact us!
©LightningChart Ltd 2026. All rights reserved.