


LightningChart JS v.6.1 has been released!
The v.6.1 release includes new product features and developer experience improvements.
New Product Features
LightningChart JS v.6.1 introduces new chart types and features. Here’s an overview:
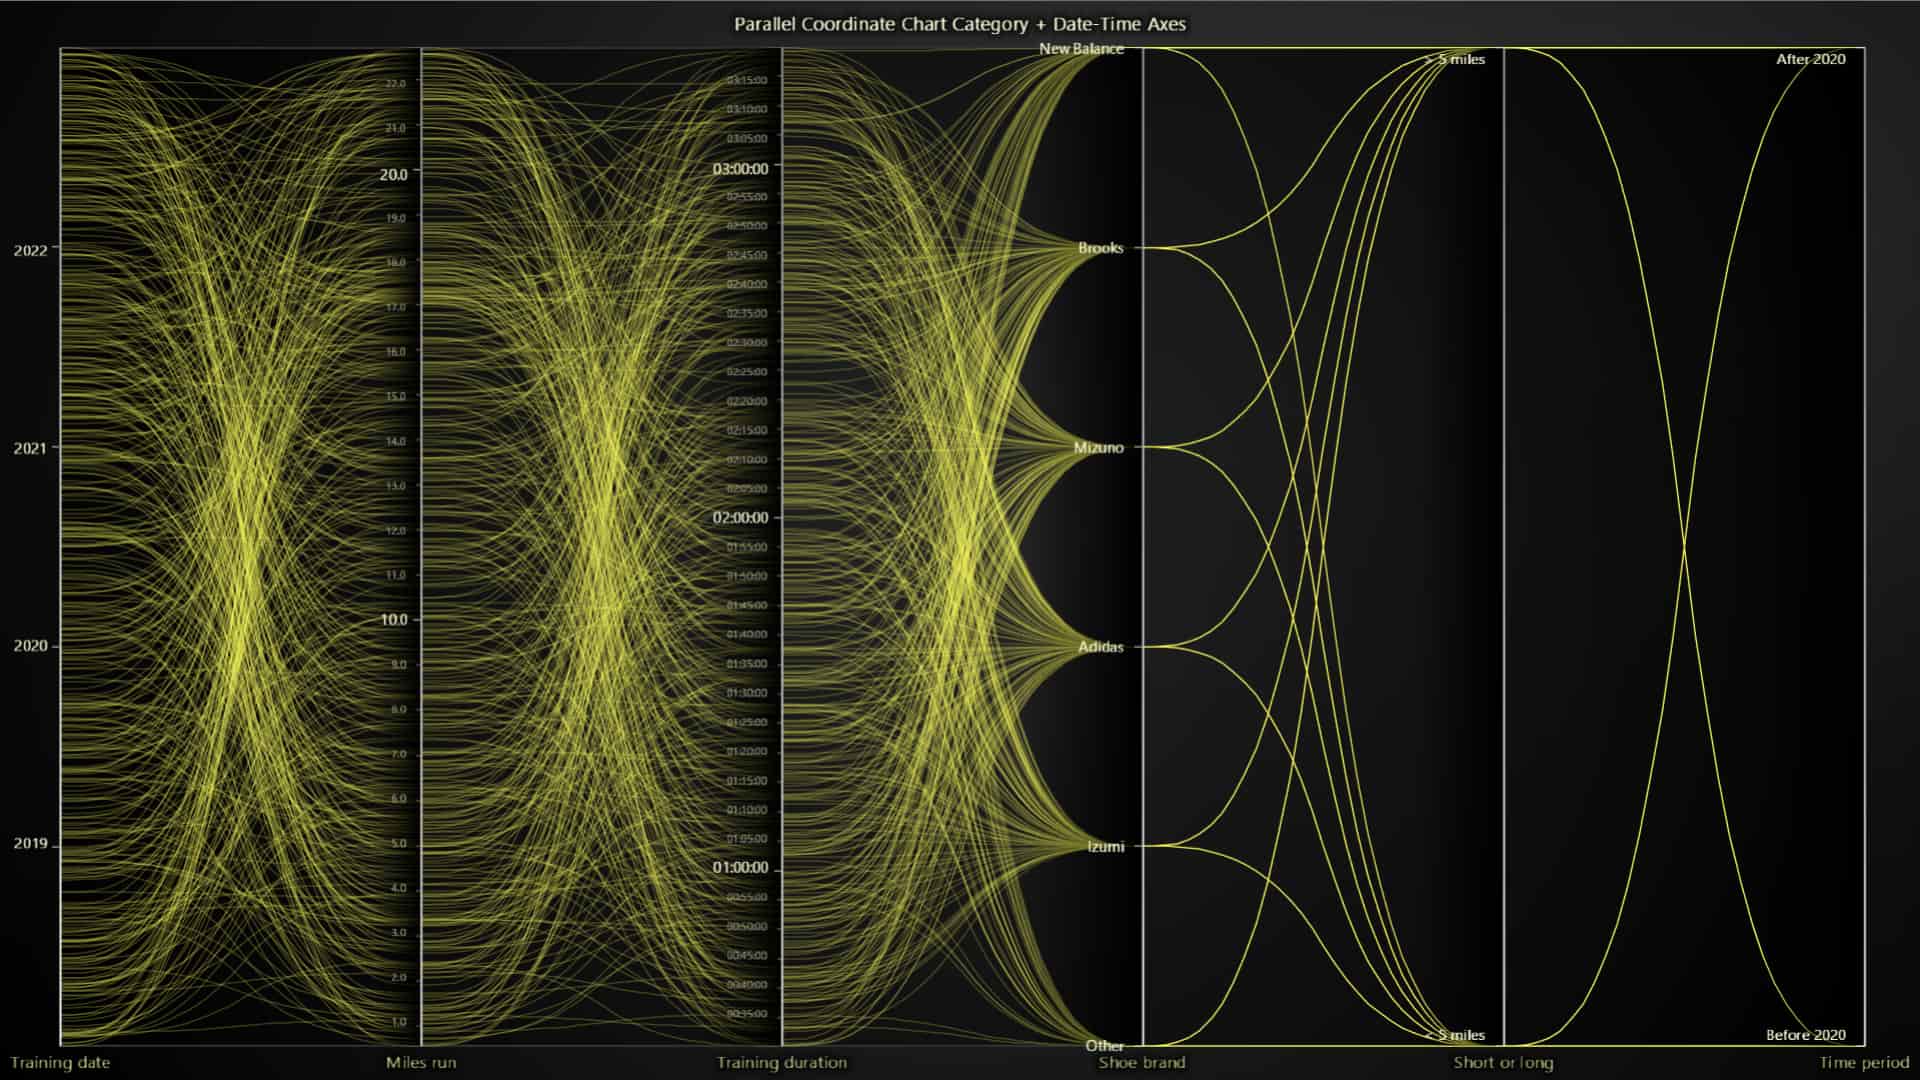
Parallel Coordinate Chart
This is a new chart type that is available to everyone with an active LCJS subscription. The Parallel Coordinate Chart is a widely known and specialized type of chart with powerful built-in data exploration interactions, including:
- Displaying large datasets above 100,000 series and more than 10 axes
- Supporting real-time data input with high stream rates
- Supporting coloring by values
- Can highlight series in value ranges using range selectors
- Supports intuitive data cursors


Orthographic 3D projections
The Orthographic view can now be enabled with chart3D.setProjection(‘orthographic’) as opposed to the default perspective projection.

Extended dashed line support

We have added wider support for the DashedLine style:
- RectangleFigure border
- PolygonFigure border
- EllipseFigure border
- BoxFigure border
- BarChart bar borders
- MapChart borders
- TreeMapChart borders
Quaternion rotation API for Mesh Model 3D

Mesh models can now be rotated with quaternions. Quaternions are a mathematical concept that allows for smooth and efficient 3D rotations of mesh models. Quaternions are especially useful in 3D graphics and computer simulations because they avoid some issues associated with traditional rotation methods like Euler angles, such as gimbal lock (a problem where you lose a degree of freedom in rotation). Previously only Euler angles were supported in LightningChart JS.
Developer Experience Improvements
Stepped axis scrolling
- A new
AxisScrollStrategies.fittingSteppedoption has been added. It fits the view to the data but, when data exceeds the current view, it expands the view by 2x instead of just enough to show the new points. This helps reduce visual distractions and is useful when the data range is unknown.
Fixes and small quality-of-life improvements
ChartXY.getAxes()now returns axes in the same order as they appear on the screen, useful for stacked axes.- Added a warning if
DataSetXYreceives strings instead of numbers. - Fixed a GPU driver issue on Apple Silicon M1/M2/M3, which affected high-precision axes.
Other Improvements & Chart Examples
Moving forward with new code XY features.
Point line area series now supports all of the same use cases as the previous XY series:
- ProgressiveY, RegressiveY, and RegressiveX data patterns
- Inverted axes
With this, we have deprecated the old XY features. Soon, they will be removed and every XY use case should move to using point line area series. Read more in the documentation.
We have added new chart examples based on the Parallel Coordinate chart. You can see them all in the Interactive Examples.


Get started with LightningChart JS v.6.1
All in all, LightningChart JS v.6.1 presents several new features, improvements, and chart types that enhance data application development, every previous release can be accessed in the changelog.
See more news
The Head and Shoulders Pattern in Technical Analysis
The Head and Shoulders Pattern in Technical Analysis The Head and Shoulders Pattern in Technical Analysis The Head and Shoulders pattern is one of the most recognized and widely used chart patterns in technical analysis. It is considered a reliable reversal pattern...
Best Telerik Charts Alternative in 2026: GPU Performance for WPF, WinForms, and Web
Telerik from Progress is a comprehensive UI component suite covering WPF, WinForms, ASP.NET, Blazor, and JavaScript. The charting components: RadChartView for WPF and WinForms, and Kendo UI Charts for web and Blazor, arrive bundled with the suite purchase. For teams...
Streaming Data Visualization with WebSockets (2026): The Complete Tutorial
Every WebSocket tutorial on the internet shows the same thing: a server sends a random number every second, a chart updates. It works. The demo looks great. Then you deploy to production, your IoT sensors push 800 updates per second across twelve channels, and the...
Best ScottPlot Alternative in 2026: GPU Rendering, 3D Charts, Cross-Language Support
ScottPlot is genuinely excellent for what it is: a free, MIT-licensed, actively developed .NET plotting library with an honest focus on interactive large-dataset display. The GDI+ rasterized renderer — which draws the entire chart as a pixel bitmap rather than...


If you have any questions, feel free to contact us!
©LightningChart Ltd 2026. All rights reserved.