News
LightningChart .NET v.10.5.1
LightningChart .NET v.10.5.1 has been released!DataCursor and 3D TransparencyRenderMode are now available.DataCursor enabled for all 3D, Polar, and Smith seriesIn earlier stages, LightningChart provided different tools that required users to write additional code in...
LightningChart JS v 4.1
LightningChart JS v.4.1 has been released!Adding new product features, visual quality and performance improvements, and more.Introducing dashed LinesWe've been listening closely to your feedback and are thrilled to announce that we're now introducing dashed line...
LightningChart .NET 10.4.1
LightningChart .NET v.10.4.1 has been released!New features, new custom controls, & performance improvementsDataCursor: new feature for automated data tracking in the chart.In previous versions, LightningChart .NET provided different tools to implement the data...
LightningChart JS v 4.0
LightningChart JS v.4.0.0 has been released!Beautiful charts, introducing the DataGrid component, new color Themes, and more.Beautiful ChartsWe know that data visualization goes beyond simply understanding data. As of today, DV has become a field with the freedom of...
LightningChart .NET: Changes in pricing on January 18th, 2023
LightningChart .NET: Changes in pricing on January 18th, 2023From January 18th, 2023, we will be adjusting our prices and there will be a price increase in our .NET charting library license in addition to new licensing types. The price changes will affect of...
Merry Christmas & Happy New Year!
Christmas tree developed with LightningChart® JSHappy Holidays!This Holiday Season, we find ourselves reflecting on all that has transpired in the past year. The end of the year brings no greater joy than the opportunity to express how grateful we are for our...
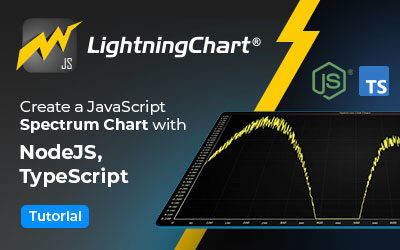
JavaScript Refreshing Spectrum Chart
JavaScript Refreshing Spectrum Chart Hello again! This time I bring a quick but helpful tutorial on how to create a JavaScript refreshing spectrum chart. A spectrum chart is commonly used in reading and plotting electromagnetic or radiation data. In today's...
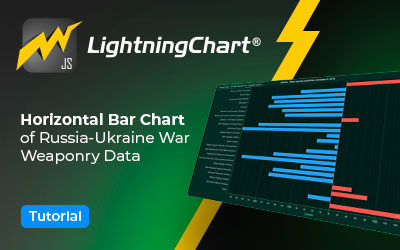
Horizontal Bar Chart of Russia-Ukraine War Weaponry Data
JavaScript Horizontal Bar Chart In this article, we aim to respectfully create a JavaScript horizontal bar chart that simulates the weaponry usage on recent war conflicts. While the data have been taken from Kaggle and seem to be accurate, data have also been...
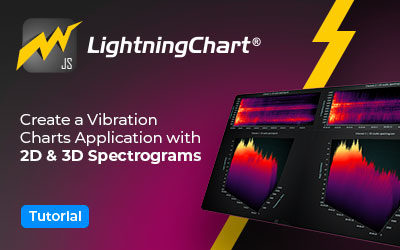
Create a vibration charts application with 2D & 3D spectrograms
JS Spectrogram ApplicationHello, in this article we will create a JS dashboard with 2D and 3D spectrogram charts. The purpose of creating this project is to explain how to create a vibration analysis application that allows us to check sound waves using 2D and 3D...
Ionic app development
Beginning Ionic App Development with Capacitor, Angular & LightningChart JS [This is the second part of the article "Data Visualization with Ionic Capacitor, Angular & JS Charts (Part 1)"] Hi! In the previous article, we created an Angular app using the...
©LightningChart Ltd 2024. All rights reserved.