


Performance BenchmarkLightningChart .NET library performance results
PerformanceLightningChart® .NET library performance comparison with the world's 2nd fastest charting library
Latest performance results: October 7th, 2022
During the development of the LightningChart® .NET component, the primary focus has always been performance. Our dedicated team of developers aims to improve not only the chart’s rendering speed but also to ensure the highest quality charts and artifact-free data visualization.
Those objectives were set at the start of library development and we continue searching for ways how to improve the library’s performance while moving forward.
This is demonstrated by the recent development of a new type of line-series, SampleDataBlockSeries (introduced in v10.1.1), as well as other line-series improvements. It was released with 10.3.1.
To follow/benchmark our development we do a lot of testing/profiling internally. We are comparing the performance not only with the past version of the library but also with the closest competitor.
Below is the list of tests where we tried to create a demanding real-time application for various chart types and data.
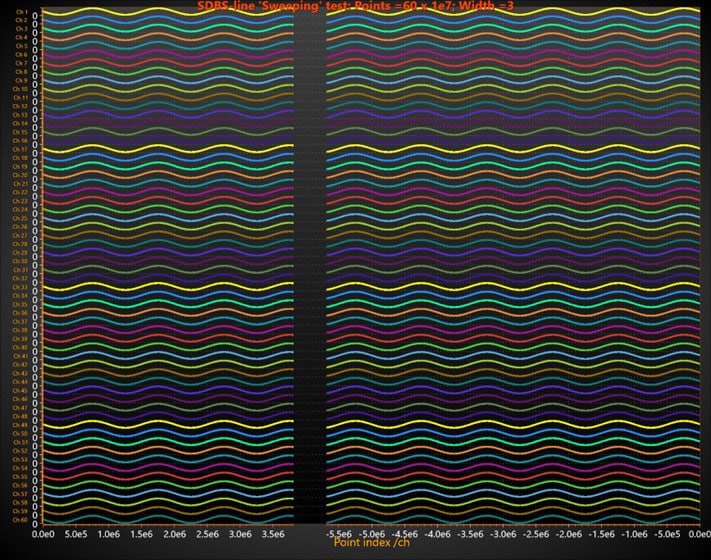
SampleDataBlockSeries
Real-time sweeping/scrolling line-series (SampleDataBlockSeries), fixed interval progressive data. Tested performance with a total visible point count from 1,000,000 to 1,000,000,000.
Result.
For both libraries, 16 samples ranging from 1,000,000 points to 1,000,000,000 points were tested. LightningChart’s FPS for 100,000,000 points was 272.8, 909.33x faster than the competitor’s FPS of 0.3.
The average FPS count for all 16 samples for LightningChart was 181.76, whereas the same for the competitor was 7.63. Note, while LightningChart could render 1 Bilion points at ~50FPS (on mid-range desktop PC), the competitor’s chart failed to render anything above 100,000,000 points.
Conclusion.
a) LightningChart, as compared to the closest competitor, is up to 900x faster (i.e. higher FPS), uses up to 6 times less memory, and provides much more smooth sweeping/scrolling (as measured by the standard deviation of rendering interval).
b) competitors use rendering options to boost speed (e.g. downsampling of data, low-quality rendering surface, etc.). This may make FPS comparable to LightningChart performance, BUT it introduces data distortions/artifacts and quality loss, which is unacceptable.
Scatter Point Chart
Real-time XY scatter point update/replace as fast as possible. Tested performance with a total visible point count from 10,000 to 10,000,000.

Results.
For both libraries, 20 samples ranging from 10,000 points to 10,000,000 points were tested. LightningChart’s FPS was 10.2 for 5,000,000 points, 102x faster than the competitor’s FPS of 0.1. The average FPS count for all 20 samples for LightningChart was 154.25, whereas the same for the competitor was 5.99.
Conclusion.
LightningChart is up to 100x faster (higher FPS) than its closest competitor in the Scatter Point Chart.
Polar Scatter Point Chart
Real-time Polar scatter point update/replace as fast as possible. Tested performance with a total visible point count from 10,000 to 1,000,000.

Result.
For both libraries, 18 samples ranging from 10,000 points to 1,000,000 points were tested. LightningChart’s FPS for 1,000,000 points was 4.3, 8.6x faster than the competitor’s FPS of 0.5. The average FPS count for all 18 samples for LightningChart was 53.19, whereas the same for the competitor was 18.40.
Conclusion.
LightningChart is up to 8x faster (higher FPS) than its closest competitor in Polar Scatter Point Chart.
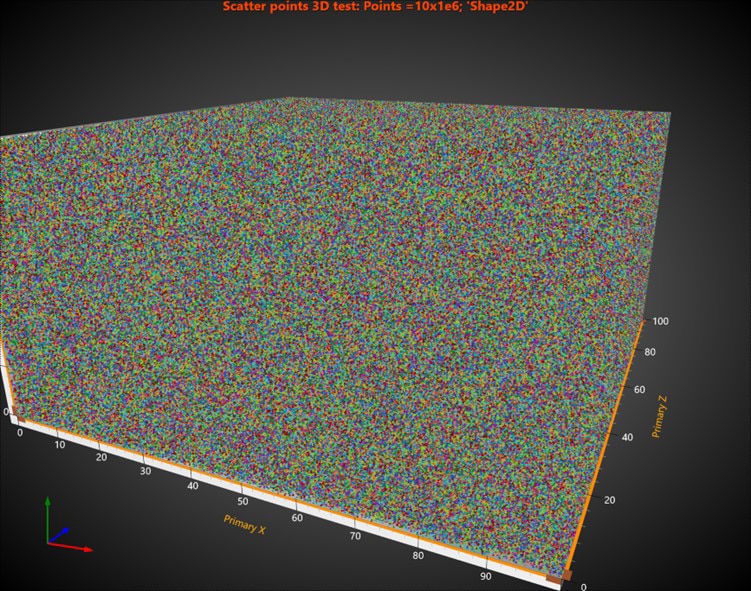
3D Scatter Point
Real-time 3D scatter point update/replace as fast as possible. Tested performance with a total visible point count from 10,000 to 100,000,000.
Result.
13 samples ranging from 10,000 points to 100,000,000 points were tested for both libraries. LightningChart’s FPS for 100,000,000 points was 3.2, 5.33x faster than the competitor’s FPS of 0.6.
It is also observed that for 2000 points LightningChart’s FPS was 276 while the competitor’s FPS was 371.8. The average FPS count for all 13 samples for LightningChart was 128.45, whereas the same for the competitor was 133.45.
Conclusion.
LightningChart is up to 5x faster (higher FPS) than its closest competitor for higher range points in 3D Scatter Point Chart while its competitor is 1.35X faster in lower range points.
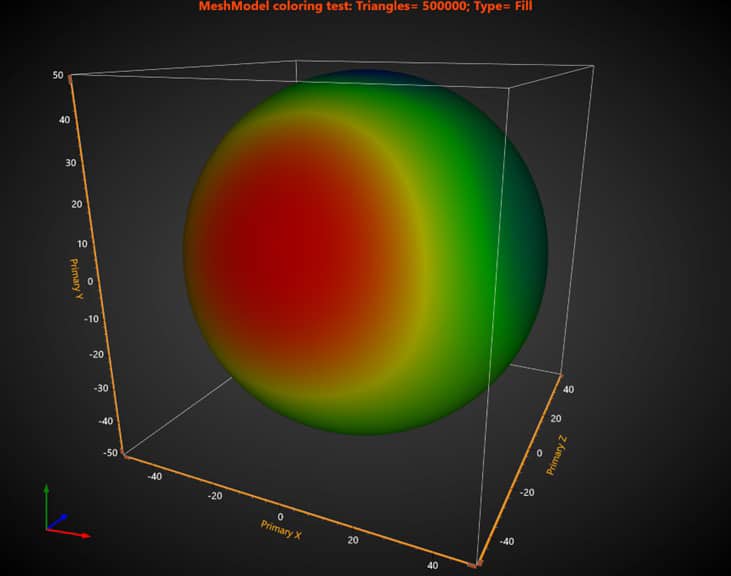
3D MeshModel
Real-time 3D triangulated surface (MeshModel) color (fill or/and wireframe) update as fast as possible. Tested performance with total visible triangles counts from 2,000 to 1,000,000.
Result.
18 samples ranging from 2,000 triangles to 1,000,000 triangles were tested for both libraries. LightningChart’s FPS for 500,000 triangles was 10.5, 13.13x faster than the competitor’s FPS of 0.8. The average FPS count for all 18 samples for LightningChart was 90.00, whereas the same for the competitor was 39.28.
Conclusion.
LightningChart is up to 13x faster (higher FPS) than its closest competitor for 3D MeshModel Charts.
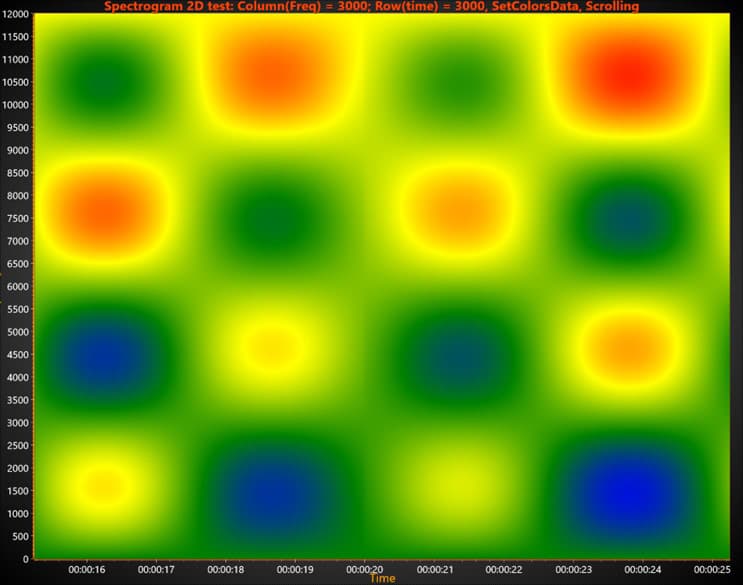
XY Heatmap – Spectrogram
Real-time XY heatmap/spectrogram test updates color as fast as possible. Tested performance for grid sizes from 100×500 to 16384 × 16384.
Result.
11 samples ranging from 100X500 grid size to 16384 X 16384 grid size were tested for both libraries. LightningChart’s FPS for 1000X1000 grid size was 217.1, 5.68X faster than the competitor’s FPS of 38.2. The average FPS count for all 18 samples for LightningChart was 73.50, whereas the same for the competitor was 33.95.
Conclusion.
LightningChart is up to 5x faster (higher FPS) than its closest competitor for XY Heatmap -Spectrogram.
LiteLineSeries
Real-time sweeping/scrolling line-series (LiteLineSeries), progressive but not fixed interval data. Tested performance with total visible point count from 1,000,000 to 600,000,000.

Results.
New LightningChart’s series (LiteLineSeries) as compared to the old (PointLineSeries) is up to 400 x faster (i.e. higher FPS), uses up to 13 x less memory, and much smoother sweeping/scrolling (as measured by the standard deviation of rendering interval).
LiteLineSeries use fewer resources (CPU and RAM) compared to PointLineSeries (which allows visualizing the order of magnitude of more points in the same PC).
LiteFreeformLineSeries
Real-time adding of new points to line-series (LiteFreeformLineSeries), while keeping the total point count the same (deleting from the start of an array).
New LightningChart’s series (LiteFreeformLineSeries) is compared the to old (FreeformPointLineSeries) (both have no restriction for the arrangement of x/y values). Tested performance with a total visible point count from 10,000 to 100,000,000.
Results.
New LightningChart’s series (LiteFreeformLineSeries) as compared to the old (FreeformPointLineSeries) is up to 7x faster (i.e. higher FPS), uses up to 4x less memory, and much incremental drawing (as measured by the standard deviation of rendering interval).
LiteFreeformLineSeries use fewer resources (CPU and RAM) compared to FreeformPointLineSeries (which allows visualizing the order of magnitude of more points in the same PC).
StockSeries
Real-time sweeping/scrolling line-series (StockSeries), progressive (but not fixed interval) data. Also made a zooming/panning test.
Tested performance with a total visible point count from 1,000 to 10,000,000. Compared to the same series in LightningChart v10.2.1.

Results.
Improved LightningChart’s series (StockSeries) has new Packing property (when it is set ON, data points will be grouped/packed to avoid overlap of rendering items (e.g. CandleStick)). With On/Off Packing in the new release as compared to the old (v10.2.1) StockSeries uses less memory and render faster.
In the new release, StockSeries is up to 10x faster (i.e. higher FPS), uses up to 10x less memory, and much smoother sweeping/scrolling (as measured by the standard deviation of rendering interval). With Packing = ‘On’ the StockSeries use fewer resources (CPU and RAM) (which allows visualizing the order of magnitude of more points in the same PC).
In addition, zooming and panning are much faster (up to 15x) and require less memory (up to 15x) in the new release.
Other latest improvements
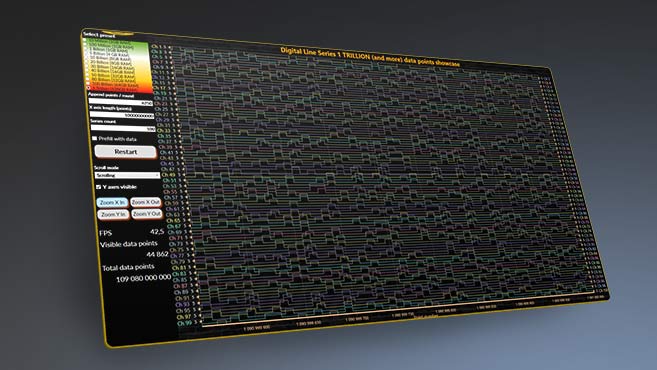
In addition to LiteLineSeries described in test #7, from v10.3.1 LightningChart .NET library has the following improvements:
- New DigitalLineSeries for binary data; 1 Trillion data points possible with 128 GB memory.
- New, dynamic color themes for the chart overall.
From all the above comparison results, it is confirmed that LightningChart is a market leader in high-performance, scientific, and medical .NET charts. We are always looking for ways to improve the LightningChart for different types of data and charts.
Thus, it is perfect for real-time monitoring which requires high-performance and low-latency charts. In addition, you can use it to present any scientific results, building highly interactive and modern reports of your scientific experiments.
LightningChart is by far the easiest to use, most feature-rich, powerful, and flexible .NET charting framework available.
Stay tuned for future releases!
See more about performance


If you have any questions, feel free to contact us!
©LightningChart Ltd 2026. All rights reserved.