


Blog
Xamarin Charts
Written by a human | Updated on April 14th, 2025What is Xamarin?Xamarin.Forms is a cross-platform UI toolkit that allows us to create user interfaces that can be shared across Android, iOS, and Windows apps. Forms are part of the Xamarin ecosystem, which is a set of tools and technologies for building mobile applications. 1. Cross-Platform...
Data Acquisition System Application
Written by a human | Updated on February 14th, 2026Data Acquisition System Application: Hi Speed DAQ ChartIn this article, we will be creating a Data Acquisition System application using a Hi-Speed DAQ chart and we will see how to add real-time source data. We will create a tool: the Hi-Speed chart which is fundamental in DAQ systems software...
React Line Chart
Written by a human | Updated on April 14th, 2025React Line ChartHi! We have been working on several articles related to React JS and LightningChart JS and today we will do a new exercise with a React line chart. As in the other articles, it will explain step by step how to create a React JS project from scratch. Remember that you can download the...
Geospatial Data Solutions
Written by a human | Updated on April 14th, 2025Digital Signal ProcessingIn today's data-driven world, businesses are constantly seeking innovative solutions to gain a competitive edge. One such solution that has gained significant traction is geospatial data solutions. Geospatial data solutions harness the power of location-based information to...
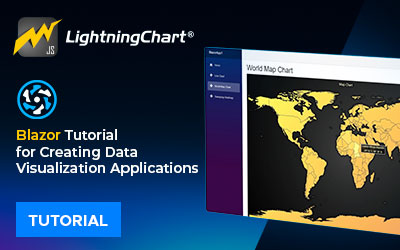
Blazor
Written by a human | Updated on April 14th, 2025What is Blazor?In this article, we'll do an exercise with Blazor and LightningChart JS. Blazor is a framework developed by Microsoft’s .NET team. The purpose of Blazor is to carry out single-page applications (SPA), making it much faster and easier to develop a web application. In my experience,...
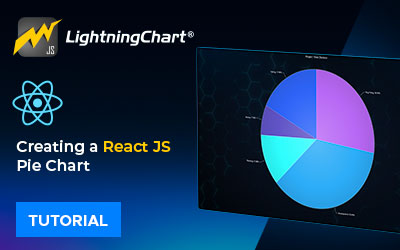
React JS Pie Chart
Written by a human | Updated on April 14th, 2025React JS Pie ChartHi, this is Omar again and we're back with React JS. For this exercise, we'll create a Pie chart, using LightningChart JS. As in previous React JS articles, we will first explain how to create a project from scratch. We'll also see how to install the LCJS library and implement a...
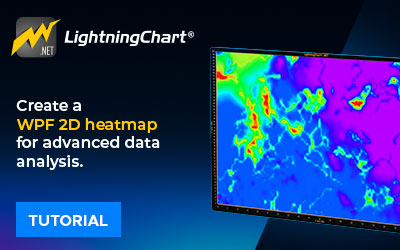
WPF 2d Heatmap
Written by a human | Updated on April 14th, 2025Introduction to WPF 2D heatmapsHi again! As part of my article tutorials for WPF data visualization, we will create a 2D heatmap using LightningChart .NET interactive examples tool. As you know, a heatmap is a graphical representation of data in which colors are used to represent different values....
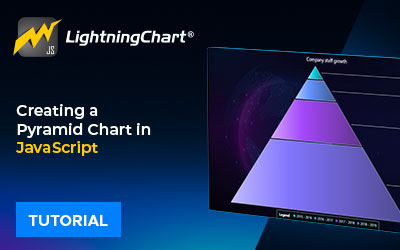
Creating a pyramid chart
Written by a human | Updated on April 14th, 2025Creating a pyramid chart in JSToday, we will be creating a Pyramid Chart using Lightning Chart JS and Node JS. A pyramid chart gets this name because the values are represented in semi-triangular sections until they form a pyramid. This pyramid chart offers a fairly easy-to-understand representation...
Area Chart
Written by a human | Updated on April 24th, 2025WPF Area ChartIn this article, we will make an Area Chart or Area graph using LightningChart .NET and interactive examples application. But… what is an Area Chart? An area chart is a combined line and bar chart. When we join the data points, we get this "spike" effect, leaving a threshold from the...

Crypto Dashboard with JavaScript
Written by a human | Updated on April 14th, 2025Introduction to Crypto DashboardsHello! If you've been following our latest articles, you'll see that LightningChart has recently introduced the DataGrid control for developing JavaScript applications. And this time, I bring an interesting tutorial on how to create a crypto dashboard using...


If you have any questions, feel free to contact us!
©LightningChart Ltd 2026. All rights reserved.