


Blog
Price Oscillator Part 1
Written by a human | Updated on April 22nd, 2025Price OscillatorsPrice oscillators use two moving averages to calculate the difference between the two data points. They usually use a shorter average and a longer average. Note that the longer the period, the slower the process will be to locate trends. In the case of price oscillators, when the...
Money Flow Oscillators
Written by a human | Updated on April 22nd, 2025Money Flow OscillatorsThis is the third part of the series on technical indicators for market analysis (trends, overbought, oversold, etc.). In the first two articles, we looked at Envelope Indicators and Moving Averages. These indicators work together and rely on the moving average to set high and...
XABCD Pattern
Written by a human | Updated on April 22nd, 2025Introduction to XABCD Pattern (Harmonic Pattern)XABCD Pattern, also known as Harmonic Pattern, is a trading drawing tool originally created by Harold McKinley Gartley. It is designed to highlight various patterns on the chart. These patterns consist of five separate points (XABCD) and four lines...
Ichimoku Cloud
Written by a human | Updated on April 22nd, 2025Introduction to Ichimoku CloudIchimoku Cloud is a technical indicator that consists of five separate indicator lines. The purpose of the indicator is to provide information about support and resistance levels. These resistance levels are points where demand matches the supply and prices stop falling...
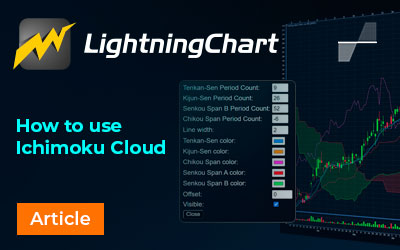
How to use Ichimoku Cloud
Written by a human | Updated on April 22nd, 2025How to use Ichimoku CloudThis article shows how to use Ichimoku Cloud and add and configure it in a trading chart application built with LightningChart for both .NET and JavaScript languages. Ichimoku Cloud is a technical indicator used in trading charts and provides information about the support...
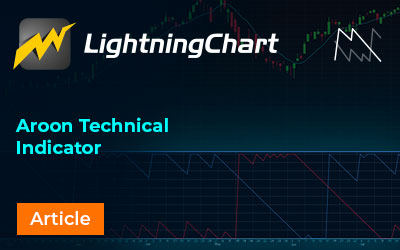
Aroon Technical Indicator
Written by a human | Updated on April 22nd, 2025Aroon Technical IndicatorThe Aroon technical indicator was developed by Tushar Chande in 1995. The Aroon technical indicator was designed to reveal if a stock is trending and to determine how strong that trend is. The idea is to measure how much time has elapsed since the highest or the lowest price...
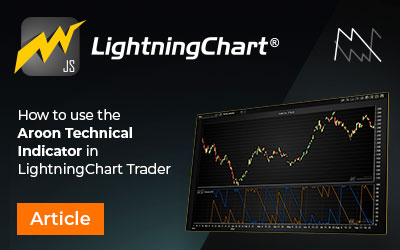
How to use Aroon
Written by a human | Updated on April 22nd, 2025How to use Aroon?Aroon technical indicator is used in trading charts and is designed to reveal if a stock is trending and to determine how strong that trend is. The Aroon technical indicator consists of two separate indicator lines: Aroon-Up measuring the uptrend and Aroon-Down measuring the...
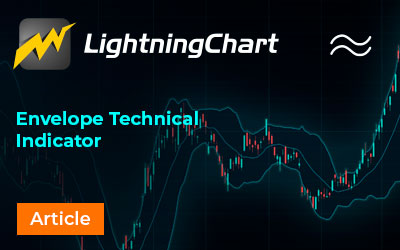
Envelope
Written by a human | Updated on April 22nd, 2025Envelope Technical IndicatorsHello! Today, we will review an interesting topic that I believe we should consider when performing stock trading and financial data analysis since it will allow us to understand the commercial behavior of financial markets. This will be the first in a series of articles...
WPF Bubble Chart
Written by a human | Updated on April 14th, 2025Introduction to WPF Bubble chartsIn today's article, we will create a WPF bubble chart with the help of LC .NET. These graphs show data points in the shape of a bubble and are positioned on a Cartesian plane X-axis and a Y-axis. The size of the bubbles indicates quantities or volumes, comparing them...
Industrial Telemetry
Written by a human | Updated on April 14th, 2025IntroductionIn today's rapidly evolving world, industries are increasingly relying on advanced technologies to optimize their operations. One such technology that has gained significant traction in recent years is industrial telemetry. Industrial telemetry refers to the process of collecting,...


If you have any questions, feel free to contact us!
©LightningChart Ltd 2026. All rights reserved.