LightningChart .NETEnvironmental Map with WPF
TutorialCreating a 2D Environmental Map with WPF
About Environmental Maps
Hello! Continuing with this series of world maps, today we will create an XY two-dimensional map, on which we will simulate environmental conditions. These types of maps show climate conditions and changes over a region of the world. It is very common to see them on news programs or programs dedicated to climate forecasting. In many cases, heat waves, cold waves, hurricanes, or rain are shown in the environmental maps.
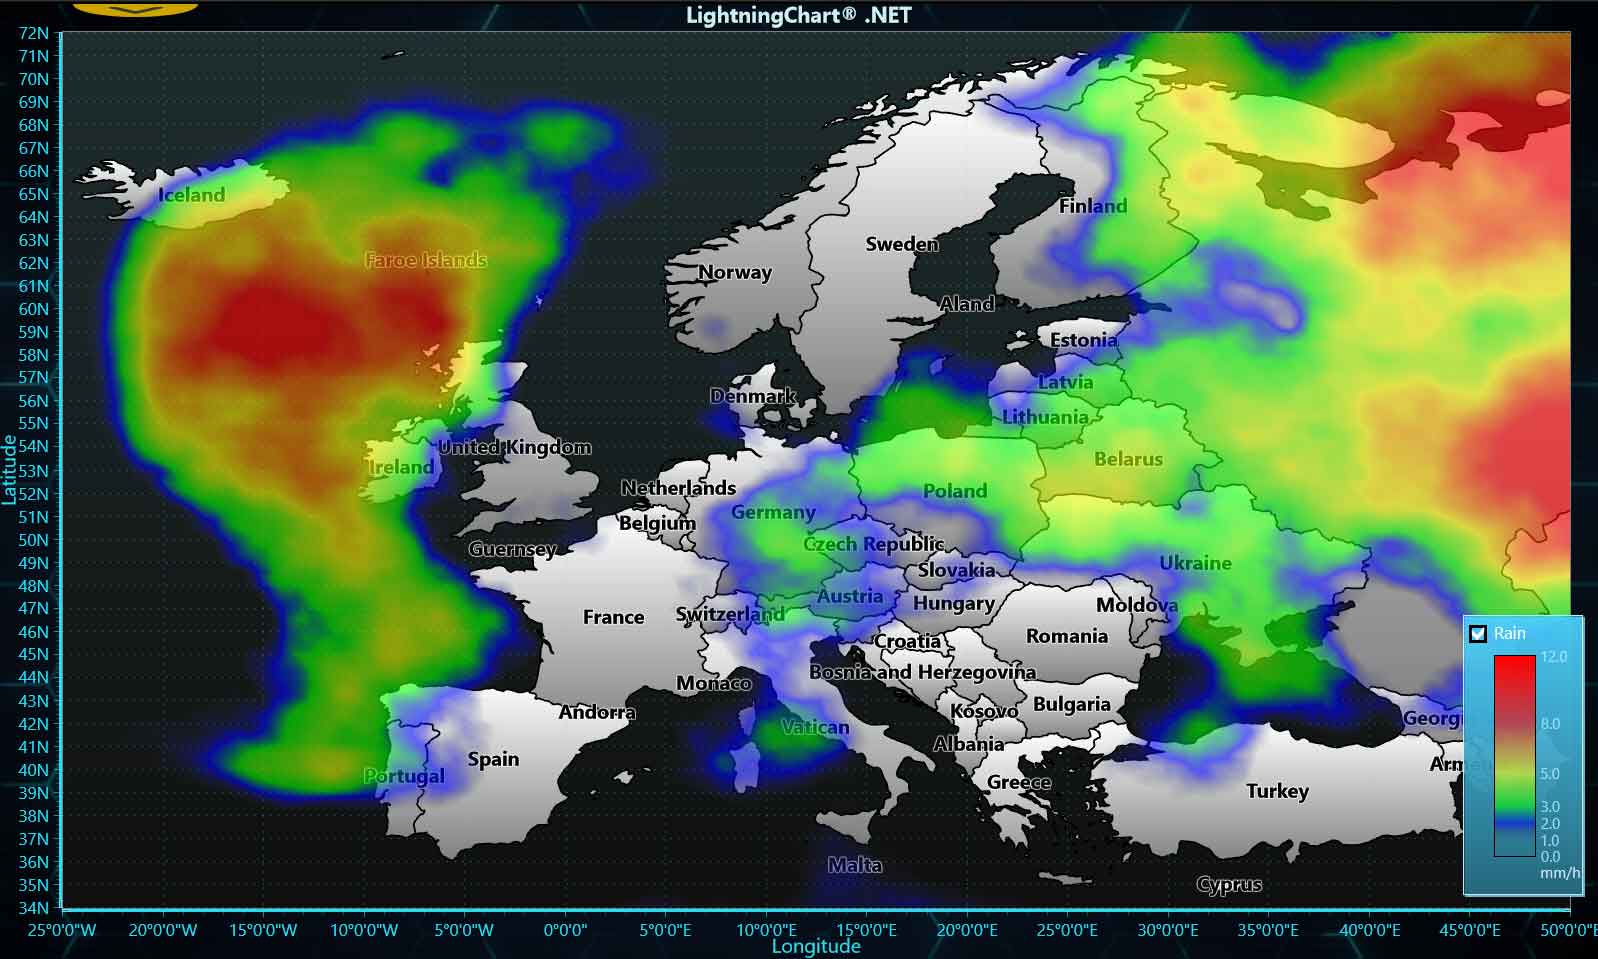
In this example, we will simulate rainfall and its intensity over the European continent. The measurement of rainfall, which is carried out using a rain gauge or a pluviograph, allows us to obtain information about its spatial characteristics, its frequency, and the amount precipitated over a specific place.
The amount of rain is measured in millimeters. One mm of rain is equal to 100 liters per square meter. In our legend box, we will create a rain meter per hour, which will help us identify the areas with the greatest amount of rainwater. That being said, let’s get started!
Project Overview
This Environmental Map simulates environmental data with geographical maps and the IntensityGridSeries of the ViewXY property.
Download the project to follow the tutorial
Local Setup
For this project, we need to take into count the following requirements to compile the project.
- OS: 32-bit or 64-bit Windows Vista or later, Windows Server 2008 R2 or later.
- DirectX: 9.0c (Shader model 3 and higher) or 11.0 compatible graphics adapter.
- Visual Studio: 2010-2019 for development, not required for deployment.
- Platform .NET Framework: installed version 4.0 or newer.
Now go to the next URL and download LightningChart .NET. You’ll then be redirected to a sign-in form where you’ll have to complete a simple sign-up process. When you’re done with the registration process, you’ll have access to your LightningChart account.
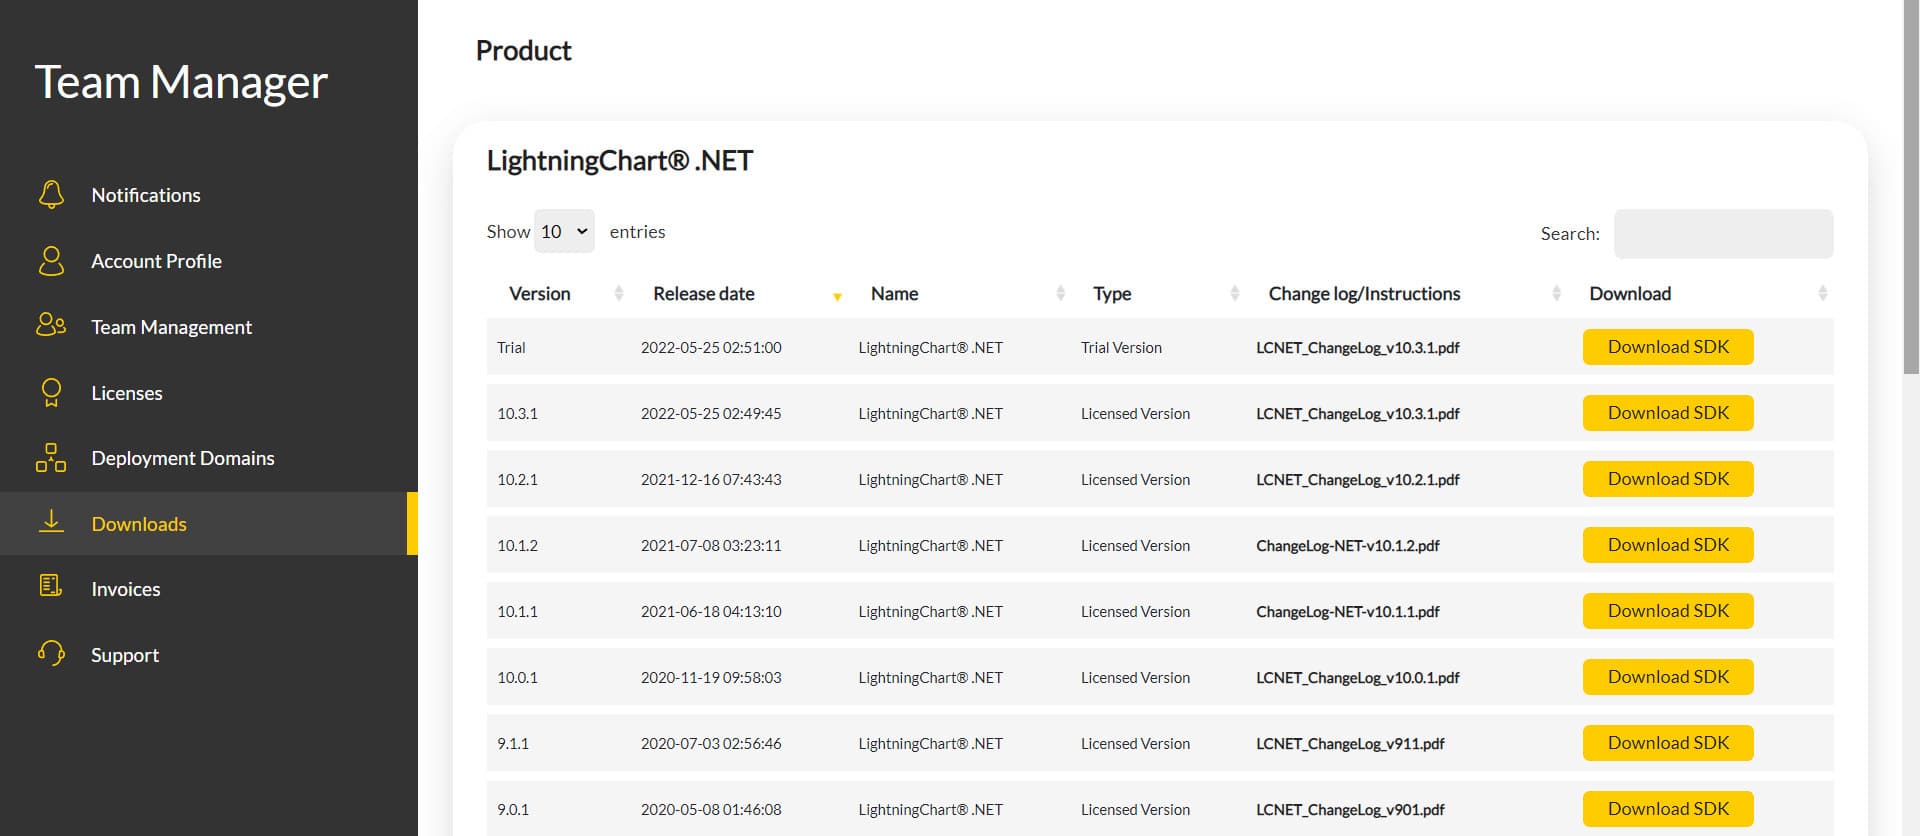
After you sign into your account, you will be able to download the SDK. This SDK will be a “free trial” version, but you will be able to use many important features for this weather data visualization tutorial. When you download the SDK, you’ll have a .exe file like this:

The installation will be a typical Windows process, so please continue with it until it is finished. After the installation, you will see the following programs:

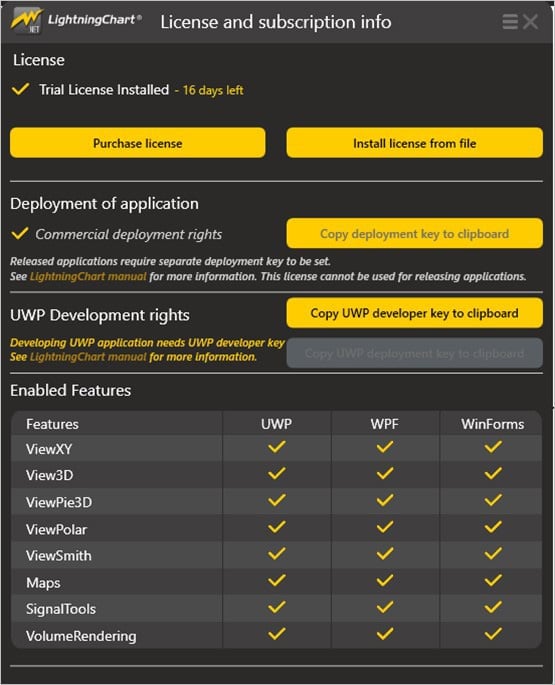
License Manager
In this application, you will see the purchase options. All the projects that you will create with this trial SDK, will be available for future developments with all features enabled.
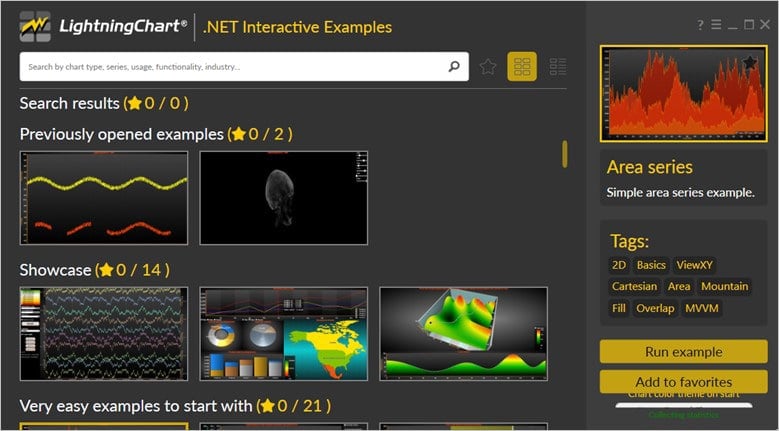
LightningChart .NET Interactive Examples
Now you can see 100+ interactive visualizations available for WPF, WinForms, and/or UWP.
Visual Studio Project
Now let’s work with Visual Studio. The main difference between using the LightningChart visualizer and Visual Studio is that we will be able to analyze and experiment with many features within the source code. In the LC visualizer, select the Environmental Data Chart and run the example:
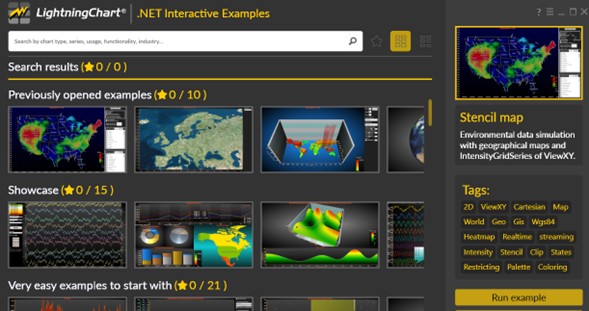
In the top-right zone of the windows, you will see the following options:
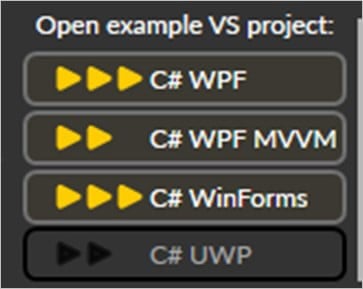
For the trial SDK, we will be able to use the WPF framework. After clicking the framework to use, we will need to specify a folder where the project will be created:
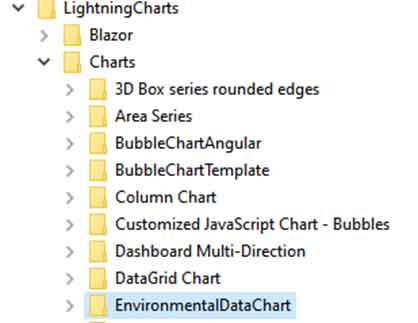
Finally, the WPF Environmental Map project will be created and Visual Studio will be opened and ready for executing the digital signal processing filters application.
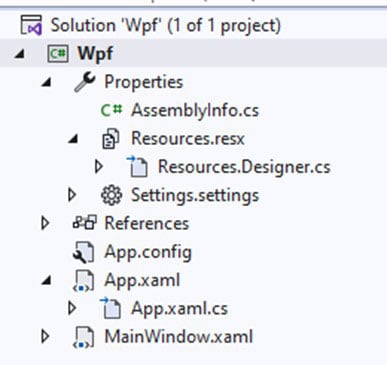
Code Review
The main code will be wrapped inside MainWindow.xaml.cs. Here we will find the code for UI controls.
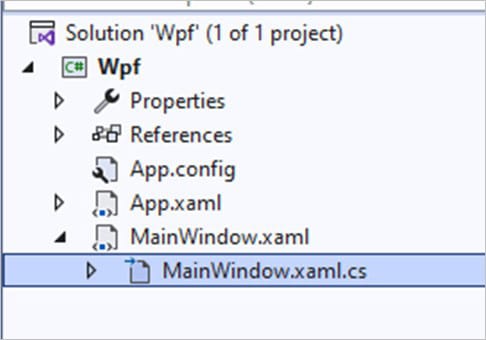
Inside the code, we will check two methods that will create the properties that we need to correctly draw the WPF Environmental Map. The interactive example is built with various user controls, to manipulate and change the visual properties of the chart. These controls are not required to generate this graph, so we will focus on the code responsible for generating the object.
MakeSourceData()
We will start with the InitializeComponent method. This will allow us to load our XAML template and access the objects within it.
InitializeComponent();
MakeSourceData();
Once the XAML component is loaded, we can start programming the environmental map instance. To work with images, manipulate them, and load them into our chart, we need to convert them into a bitmap.
Within the Resources folder of our project, you can find an image that will help us create the rain “clouds”. This image will be converted into a bitmap and we will extract the colors of the image using the tool GetPixelColors.
System.Drawing.Bitmap bitmapDataSource = new System.Drawing.Bitmap(Environment.CurrentDirectory + @"\Resources\EnvironmentalData200x150.png");

//Use fast method for getting pixel colors
System.Drawing.Color[,] aPixelColors = ChartTools.GetPixelColors(bitmapDataSource);
int width = aPixelColors.GetLength(0);
int iHeight = aPixelColors.GetLength(1);

//The data array has value range of 0...1
m_aEnvironmentalData = new double[width][];
for (int column = 0; column < width; column++)
{
    m_aEnvironmentalData[column] = new double[iHeight];

    for (int row = 0; row < iHeight; row++)
    {
        m_aEnvironmentalData[column][row] = (aPixelColors[column, row].R + aPixelColors[column, row].G
            + aPixelColors[column, row].B) / (3.0 * 255.0);
    }
}
This tool allows us to obtain the color of all the pixels at once instead of doing it for each pixel of the image. Finally, we will obtain all the values of our image by column and row, which will be stored in the variable m_aEnvironmentalData.
CreateChart()
The CreateChart method will construct the chart object, which will be displayed within an XAML frame. We need to create a LightningChart-type object. This constructor will allow us to create an instance of a chart, specify the type of chart, and access different properties.
_chart = new LightningChart
{
    ChartName = "Environmental data chart"
};
_BeginUpdate
The BeginUpdate function will allow us to stop drawing the chart, which will allow us to set up the properties that we want to customize. As long as the update is not closed, the chart will not show the changes we make, this will help with the performance of the chart construction.
_chart.BeginUpdate();Chart Type
We need to specify the active chart view or the type of chart that will be created. In this case, we use the XY view. There are several types of views:
- XY
- 3D
- Pie3D
- Polar
- Smith
_chart.ActiveView = ActiveView.ViewXY;Now we will load the map through the markdown documentation (MD) file, which you can find in the Maps folder of our project. The extracted object will be assigned to the Maps property of the XY chart.
string path = Environment.CurrentDirectory + @"\Maps\" + DefaultMap + ".md";
if (path != "")
{
    _chart.ViewXY.Maps.Path = System.IO.Path.GetDirectoryName(path);
}
The geographic vector data is stored in LightningChart map files, with a .md extension. LightningChart is delivered with a set of map files. The X-Axis is used for Longitude, and the Y-axis for latitude. The map coordinates are decimal degrees, with latitude origin at the equator and longitude origin at Greenwich, U.K.
Environmental Series
Now we will begin to create our legend box that will show the intensity colors per mm of rain. We need to configure an IntensityGridSeries to render environmental data over the environmental map.
IntensityGridSeries environmentalSeries = new IntensityGridSeries(_chart.ViewXY, _chart.ViewXY.XAxes[0], _chart.ViewXY.YAxes[0]);
environmentalSeries.Title.Text = "Rain";
environmentalSeries.FullInterpolation = (bool)checkBoxFullInterpolation.IsChecked;
environmentalSeries.Optimization = IntensitySeriesOptimization.DynamicValuesData;
environmentalSeries.AllowUserInteraction = false; //Disable mouse interaction to make DynamicValuesData optimization effective.
environmentalSeries.LegendBoxUnits = "mm/h";
environmentalSeries.LegendBoxValuesFormat = "0.0";
environmentalSeries.SetRangesXY(-25, 50, 34, 72);
environmentalSeries.Data = new IntensityPoint[m_aEnvironmentalData.GetLength(0), m_aEnvironmentalData.GetLength(1)];
The IntensityGridSeries class needs three parameters to work:
- The owner or parent object that requires it.
- X-axis.
- Y-axis.
Within the properties, we can find some focus on process optimization.
- FullInterpolation: Enable the
FullInterpolationproperty to use an enhanced interpolation method in the fill. Note that it will cause more CPU and GPU usage. By using full interpolation, the fill quality is better but can be seen only when the data array size is quite small.
- Optimization: Use
DynamicValuesDatato update only the Value fields of the data array. You can use theIntensityPointstructures and call theInvalidateValuesDataOnlymethod to update the chart. This way, the update is much faster as the geometry of the series is not recalculated. This is only intended to be used in applications where the data X and Y values of the nodes stay in the same place, for example in thermal imaging solutions.
- SetRanges: Sets X and Y ranges at the same time. Very CPU-efficient way compared to separately setting RangeMinX, RangeMaxX, RangeMinY, and RangeMaxY properties.
Add Data
To add data, we need to set the values we mapped before to the data property. Adding the environmentalSeries to the chart:
_chart.ViewXY.IntensityGridSeries.Add(environmentalSeries);Configuring Axis
We can access each axis of the environmental map chart by simply specifying which axis we want. With this, we can assign properties such as range, value type, and title:
// Configure x-axis.
_chart.ViewXY.XAxes[0].SetRange(-25, 50);
_chart.ViewXY.XAxes[0].ValueType = AxisValueType.MapCoordsDegMinSecNESW;
_chart.ViewXY.XAxes[0].Title.Text = "Longitude";

// Configure y-axis.
_chart.ViewXY.YAxes[0].SetRange(34, 72);
_chart.ViewXY.YAxes[0].ValueType = AxisValueType.MapCoordsDegNESW;
_chart.ViewXY.YAxes[0].Title.Text = "Latitude";
Don’t allow mouse panning:
_chart.ViewXY.ZoomPanOptions.DevicePrimaryButtonAction = UserInteractiveDeviceButtonAction.Zoom;
_chart.ViewXY.ZoomPanOptions.DeviceSecondaryButtonAction = UserInteractiveDeviceButtonAction.None;
Set fit operation to revert to initial scales:
_chart.ViewXY.ZoomPanOptions.RightToLeftZoomAction = RightToLeftZoomActionXY.RevertAxisRanges;
_chart.ViewXY.XAxes[0].RangeRevertMinimum = -25;
_chart.ViewXY.XAxes[0].RangeRevertMaximum = 50;
_chart.ViewXY.YAxes[0].RangeRevertMinimum = 34;
_chart.ViewXY.YAxes[0].RangeRevertMaximum = 72;

_chart.Loaded += _chart_Loaded;MapCoordsDegMinSecNESW:
The geographical environmental map coordinates presentation in degrees, arc minutes, and arc seconds, with N, E, S, W indications. Example: 40°2’13″N 9°58’2″W
MapCoordsDegNESW:
Geographical map coordinate presentation in degrees decimals, with N, E, S, W indication. Example: 40.446195N 79.948862W
LegendBox Colors
Before finishing the environmental map chart configuration, we must assign the colors to the legend box, for this we will use the ValueRangePalette object.
ValueRangePalette palette = new ValueRangePalette(sgs);
palette.Steps.Clear();
palette.Steps.Add(new PaletteStep(palette, Colors. Lime, 10000000)); palette.Steps.Add(new PaletteStep(palette, Colors. Yellow, 50000000)); palette.Steps.Add(new PaletteStep(palette, Colors. Red, 500000000)); palette.Type = PaletteType.Gradient;
sgs.ContourPalette = palette;
m_palette = palette;
With the Value Range Palette property, define color steps to color values. You can use ValueRangePalette to:
- Fill
- Wireframe
- Contour lines
Each step has a height value and corresponding color. The palette is defined with the MinValue, Type, and Steps properties. There are two options:
- Uniform and Gradient.
- Minimum Value: -50
- Type: Uniform
- Steps:
- Steps[0]: Maximum value: -10, Color: Blue
- Steps[1]: Maximum value: 10, Color: Teal
- Steps[2]: Maximum value: 25, Color: Green
- Steps[3]: Maximum value: 35, Color: Yellow
- Steps[4]: Maximum value: 60, Color: Red
- Steps[5]: Maximum value: 100, Color: White
Values below the first step value are colored with the first step color.
_chart.EndUpdate();
gridChart.Children.Add(_chart);
Finally, we finish updating the environmental map chart and add it to the XAML grid to be shown to the user. We could summarize the code in the following steps:
- We extract the values from a data source.
- We convert the map image into a bitmap, to obtain values such as the color of its pixels.
- We use the IntensityGridSeries class to create and calculate the intensity levels of the data and represent them in a legend box.
- We configure the axes.
- We configure the color palettes based on the intensity values.
- We add the chart object to the XAML grid so that it is shown to the user.
Conclusion
We are close to finishing this series of articles related to world maps. As in previous articles, we can find tools provided by LightningChart .NET, to generate calculations, extract values from an image, and represent it on a map. Once you can manipulate an image, it is possible to apply colors and gradients based on the intensity of the pixels.
To draw a map, we only need to have a data source (In this case an md file) and assign it to the environmental map property of the chart. It sounds quite complex, but LC .NET makes the process much easier thanks to the tools explained above. As always, I recommend staying tuned for upcoming LightningChart .Net articles and video tutorials.
Thank you so much, bye!

