


Android3 JavaScript charts in Android Studio with LightningChart JS
TutorialLearn how to use JavaScript charts in Android and create a line, bar, and candlestick chart Android app
Written by a human | Updated on April 11th, 2025
JavaScript Charts in Android Studio
Hi again, this time I’ll talk again about data visualization mobile apps with Android… JavaScript is a powerful tool for creating interactive and dynamic visualizations and with the help of Android Studio, you can easily integrate these charts into your mobile application.
In this tutorial, we’ll cover the basics of using JavaScript charts in Android charts. We’ll also see how to easily integrate these charts into an Android app that you can run on your phone, just like any other app.
Project Overview
In this article, we will create an Android application with Android Studio and LightningChart JS (IIFE). If you’re not yet familiar with Android Studio, this exercise could help you. Also, you will be able to download the entire project and follow the tutorial.
For this application, we will create the following JavaScript charts in Android Studio:
In this article, we will create an Android application with Android Studio and LightningChart JS (IIFE).
If you’re not yet familiar with Android Studio, this exercise could help you.
Also, you will be able to download the entire project and follow the tutorial.
For this application, we will create the following JavaScript charts in Android Studio:

 Download the project to follow the tutorial
Setting Up Android Studio
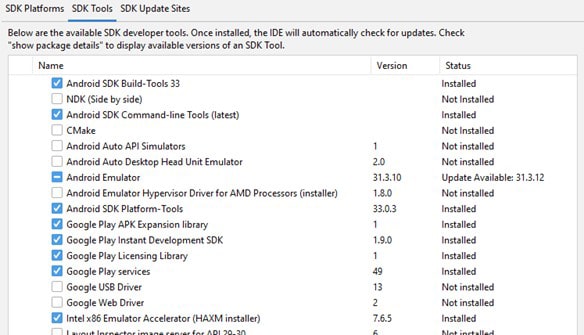
Android Studio is a free IDE, so you will have the opportunity to work with it on Windows, macOS, and Linux. You can download Android Studio here. The installation is very easy, it’s a typical “next” window, but if you want to see the official Android documentation, you can get it from here. Finally, go to the SDK manager and install the latest platforms for android:

You can install all the platforms you need, but I recommend having the latest ones because it will be a requirement in case you want to publish your Android charts app in the Google Play console. To finish setting up Android Studio, install the SDK Tools for Android. You can download the tools that I show or choose the tools you need.
Java SDK
Gradle
Gradle is a build automation tool for multi-language software development. So, Gradle will be very important for mobile applications. You can get and see the installation documentation from here. The Gradle installation is basically copying the source files to the specified paths.
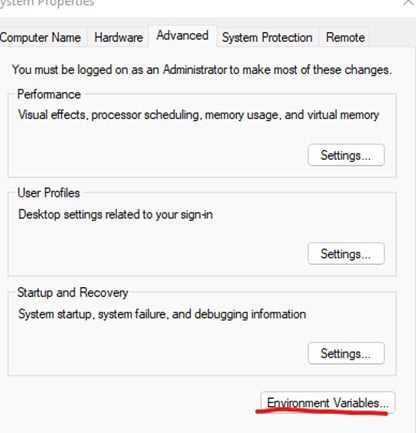
Environment Variables
It will be necessary to create the environment variables for Android Studio, Java SDK, and Gradle. You can go directly to the environment variables by typing those words in the windows menu:
It will be necessary to create the environment variables for Android Studio, Java SDK, and Gradle.
You can go directly to the environment variables by typing those words in the windows menu:

Then, click on the [Environment Variables] button:
Now you just need to add the variables with the path for the android SDK:

Now, go to the System Variables section and edit the [Path] variable:
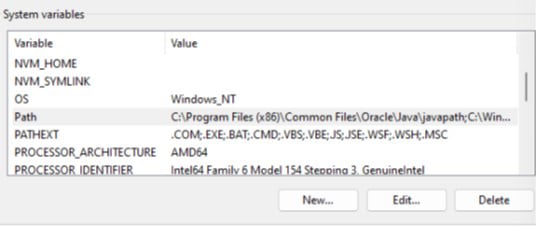
Finally, just add the path for Java and the path for Gradle and proceed to code in Android Studio:

Android Project
When you open the app folder in the Android studio, you will see a tree like the following. I will now explain folder by folder and the relationship between the classes and the HTML files.
When you open the app folder in the Android studio, you will see a tree like the following.
I will now explain folder by folder and the relationship between the classes and the HTML files.

Manifests – AndroidManifest.xml
Every app project must have an AndroidManifest.xml file at the root of the project source set. The manifest file describes essential information about your app to the Android build tools, the Android operating system, and Google Play.
Every app project must have an AndroidManifest.xml file at the root of the project source set.
The manifest file describes essential information about your app to the Android build tools, the Android operating system, and Google Play.
<application
        android:requestLegacyExternalStorage="true"
        android:allowBackup="true"
        android:icon="@mipmap/ic_launcher"
        android:label="@string/app_name"
        android:roundIcon="@mipmap/ic_launcher_round"
        android:supportsRtl="true"
        android:theme="@style/AppTheme">
        <activity android:name=".BarChart" android:exported="false"></activity>
        <activity android:name=".CandlestickChart" android:exported="false"></activity>
        <activity android:name=".LineChart" android:exported="false"></activity>
        <activity android:name=".MainActivity" android:exported="true">
            <intent-filter>
                <action android:name="android.intent.action.MAIN" />

                <category android:name="android.intent.category.LAUNCHER" />
            </intent-filter>
        </activity>
    </application>
Inside the manifest, we need to specify the classes that will render a window inside our application. If you go to the java/lightningChart folder, you will see some files/classes with the same name that we have in the android manifest.
Those names should match each class that we create and want to render. The manifest file is a very important file, in the future, you will use this file to specify many settings, for example, deep linking properties.
Inside the manifest, we need to specify the classes that will render a window inside our application.
If you go to the java/lightningChart folder, you will see some files/classes with the same name that we have in the android manifest.
Those names should match each class that we create and want to render.
The manifest file is a very important file, in the future, you will use this file to specify many settings, for example, deep linking properties.
Java / LightningChart

Inside each file, we can create functions to validate, modify or create elements to be shown in the window. By default, you will find the [onCreate] function:
Inside each file, we can create functions to validate, modify or create elements to be shown in the window.
By default, you will find the [onCreate] function:
protected void onCreate(Bundle savedInstanceState) {
        super.onCreate(savedInstanceState);

        setContentView(R.layout.activity_chart_display);
        final Bundle bundle = getIntent().getExtras();

        webView = findViewById(R.id.chartDisplayWebView);
        webView.getSettings().setJavaScriptEnabled(true);
        webView.loadUrl("file:///android_asset/BarChart.html");
}
The WebView component permits the integration of web content into your activity layout, albeit with certain limitations compared to complete web browsers. If you require more extensive UI control and advanced configuration options to incorporate web pages into a custom app environment, a WebView proves advantageous.
The [onCreate] method, will be called when the activity is created.
In other words, when we click on a button that references a specific action, the [onCreate] method will be called, inside this method we can load an HTML file (this file can work as a UI).
We are accessing the HTML as a “view” for this “controller”, using the Android [WebView] class.
The WebView component permits the integration of web content into your activity layout, albeit with certain limitations compared to complete web browsers.
If you require more extensive UI control and advanced configuration options to incorporate web pages into a custom app environment, a WebView proves advantageous.
Java / LightningChart / MainActivity
The MainActivity will work as our [main()] method. This component is the first screen to appear when the user launches the app. From this file, we will declare the methods that will execute our activities. These methods can be executed by pressing a UI object:
The MainActivity will work as our [main()] method. This component is the first screen to appear when the user launches the app.
From this file, we will declare the methods that will execute our activities.
These methods can be executed by pressing a UI object:
public void createLineChart(View view) {
        Intent intent = new Intent(packageContext this, LineChart.class);
        Bundle bundle = new Bundle();
        bundle.putBoolean("useRandom", true);
        intent.putExtras(bundle);
        startActivity(intent);
    }
Layout
When creating a new project, we will find some XML files inside the Layout folder:
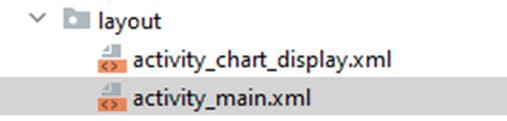
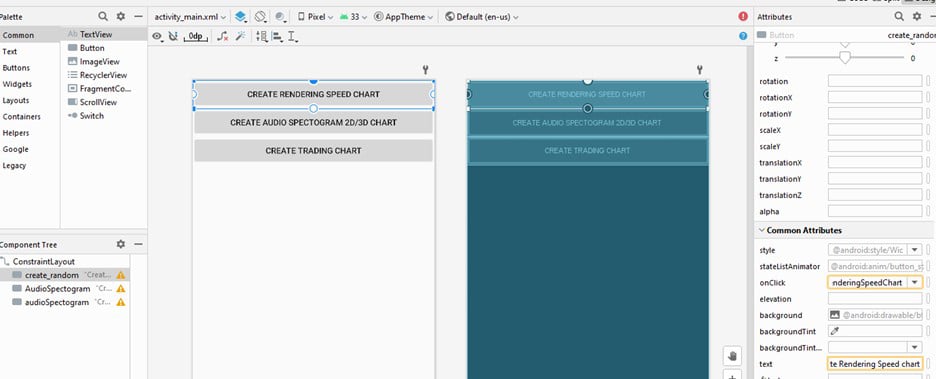
The activity_main.xml will work as a default interface and it will be related to our MainActivity class. If you open the file, you will see a designer that contains the buttons for each chart.
The activity_main.xml will work as a default interface and it will be related to our MainActivity class.
If you open the file, you will see a designer that contains the buttons for each chart:
Here you can add UI controls. If you click on each button, you will see the properties panel at the right of the window. In the [text] property, you can set the text to be displayed in the application.
In the [onClick] property, you can specify the name of the method that will call an activity. This method should be located in the MainActivity class.
Here you can add UI controls. If you click on each button, you will see the properties panel at the right of the window.
In the [text] property, you can set the text to be displayed in the application.
In the [onClick] property, you can specify the name of the method that will call an activity.
This method should be located in the MainActivity class.
Assets Folder
In this folder, you will find the HTML files that will be loaded for the process. The IIFE.js files contain all the functions and properties needed to create LC JS charts. The xydata.iife.js file contains the classes to create XY charts, this is required for the Candlestick chart.
In this folder, you will find the HTML files that will be loaded for the process.
The IIFE.js files contain all the functions and properties needed to create LC JS charts.
The xydata.iife.js file contains the classes to create XY charts, this is required for the Candlestick chart.

Bar Chart
Here you can consult the base code of the bar chart we’ll be creating today. Lightning Charts JS can work as embedded code, wrapped within script tags:
<script src="lcjs.iife.js"></script>

<!--Actual chart related script tag-->
Extracting the required classes for the bar chart
// Extract required parts from LightningChartJS.
const {
    lightningChart,
    emptyLine,
    AutoCursorModes,
    UIOrigins,
    LegendBoxBuilders,
    AxisScrollStrategies,
    AxisTickStrategies,
    UIElementBuilders,
    Themes,
} = lcjs
Configuring the properties
An interface must be created for the bar chart, encompassing all its relevant properties. Here we are specifying the sizes for all the vertical bars:
let barChart
{
    barChart = (options) => {
        const figureThickness = 10
        const figureGap = figureThickness * 0.25
        const groupGap = figureGap * 3.0
        const groups = []
        const categories = []
Configuring the axes:
For this chart, is necessary to configure the axes and chart object. In the chart object, we will specify global properties such as title, page padding, and mouse behaviors.
const chart = lc
            .ChartXY(options)
            .setTitle('Grouped Bars (Employee Count)')
            .setAutoCursorMode(AutoCursorModes.onHover)
            // Disable mouse interactions (e.g. zooming and panning) of plotting area
            .setMouseInteractions(false)
            // Temporary fix for library-side bug. Remove after fixed.
            .setPadding({ bottom: 30 })

        // X-axis of the series
        const axisX = chart
            .getDefaultAxisX()
            .setMouseInteractions(false)
            .setScrollStrategy(undefined)
            // Disable default ticks.
            .setTickStrategy(AxisTickStrategies.Empty)

        // Y-axis of the series
        const axisY = chart
            .getDefaultAxisY()
            .setMouseInteractions(false)
            .setTitle('Number of Employees')
            .setInterval({ start: 0, end: 70, stopAxisAfter: false })
            .setScrollStrategy(AxisScrollStrategies.fitting)
Creating objects and modifying cursor properties in a chart
To create an object that refers to a specific axis, we will use the function [getDefaultAxisX -Y] and add some properties. The [setAutoCursor] function allows to modify of the visual properties of the cursor over the chart.
chart.setAutoCursor((cursor) =>
            cursor
                .setPointMarkerVisible(false)
                .setTickMarkerXVisible(false)
                .setTickMarkerYVisible(false)
                .setGridStrokeXStyle(emptyLine)
                .setGridStrokeYStyle(emptyLine)
                .setResultTable((table) => {
                    table.setOrigin(UIOrigins.CenterBottom)
                }),
        )
Function for creating cursor-enabled rectangle series with row data
The following function creates a Rectangle series for each category which adds the cursor functionality to it. In the function, we are adding the name of the department and the number of employees. Those values will be added as row data inside the vertical line.
Function for creating cursor-enabled rectangle series with row data
The following function creates a Rectangle series for each category which adds the cursor functionality to it.
In the function, we are adding the name of the department and the number of employees. Those values will be added as row data inside the vertical line.
const createSeriesForCategory = (category) => {
            const series = chart.addRectangleSeries().setDefaultStyle((rect) => rect.setStrokeStyle(emptyLine))
            // Change how marker displays its information.
            series.setCursorResultTableFormatter((builder, series, figure) => {
                // Find cached entry for the figure.
                let entry = {
                    name: category.name,
                    value: category.data[category.figures.indexOf(figure)],
                }
                // Parse result table content from values of 'entry'.
                return builder.addRow('Department:', entry.name).addRow('# of employees:', String(entry.value))
            })
            return series
        }
Legend Box behavior property
In the following property, we can specify the behavior of those values as a “legend box”:
const legendBox = chart
            .addLegendBox(LegendBoxBuilders.VerticalLegendBox)
            // Dispose example UI elements automatically if they take too much space. This is to avoid bad UI on mobile / etc. devices.
            .setAutoDispose({
                type: 'max-width',
                maxWidth: 0.2,
            })
            .setTitle('Department')
Redrawing bar chart based on group and category values
The following function redraws the bar chart based on values of groups and categories
const redraw = () => {
            let x = 0
            for (let groupIndex = 0; groupIndex < groups.length; groupIndex++) {
                const group = groups[groupIndex]
                const xStart = x
                for (const category of categories) {
                    const value = category.data[groupIndex]
                    if (value !== undefined) {
                        // Position figure of respective value.
                        const figure = category.figures[groupIndex]
                        figure.setDimensions({
                            x,
                            y: 0,
                            width: figureThickness,
                            height: value,
                        })
                        // Figure gap
                        x += figureThickness + figureGap
                    }
                }
                // Position CustomTick
                group.tick.setValue((xStart + x - figureGap) / 2)

                // Group gap
                x += groupGap
            }
            axisX.setInterval({ start: -(groupGap + figureGap), end: x, stopAxisAfter: false })
        }
Adding groups and categories to bar chart
We have to add groups and categories. For each category, we will draw a bar using the redraw function. Finally, the barChart object will provide categories and groups.
const addCategory = (entry) => {
            // Each category has its own series.
            const series = createSeriesForCategory(entry).setName(entry.name)
            entry.figures = entry.data.map((value) => series.add({ x: 0, y: 0, width: 0, height: 0 }))
            legendBox.add(series)
            categories.push(entry)
            redraw()
        }
        // Return public methods of a bar chart interface.
        return {
            addCategory,
            addGroups,
        }
Bar chart with groups and categories
To finish, we can specify the theme (UI) to our chart and add the categories and data to this object.
const chart = barChart({
    theme: Themes.turquoiseHexagon,
})

// Add groups
chart.addGroups(['Finland', 'Germany', 'UK'])

// Add categories of bars
const categories = ['Engineers', 'Sales', 'Marketing']
const data = [
    [48, 27, 24],
    [19, 40, 14],
    [33, 33, 62],
]
data.forEach((data, i) =>
    chart.addCategory({
        name: categories[i],
        data,
    }),
)
Candlestick Chart
Here’s the code for the candlestick chart we’ll be creating. LightningChart JS can work as embedded code, wrapped within script tags:
<script src="lcjs.iife.js"></script>
<!--Actual chart related script tag-->
<script>
Candlestick chart classes
Extracting the required classes for the chart:
const { lightningChart, AxisTickStrategies, OHLCFigures, emptyLine, AxisScrollStrategies, Themes } = lcjs

const { createOHLCGenerator } = xydata
DateTime
Assigning a default DateTime origin for the axis:
const dateOrigin = new Date(2018, 0, 1)Creating the chart object
We can specify what UI theme we want for the chart. The container property will point to an HTML object. This HTML object will be a DIV that will render the chart.
const chart = lightningChart().ChartXY({
    theme: Themes.turquoiseHexagon,
    container: 'target'
})
TickStrategy
We can set properties to the X and Y axes by using the getDefaultAxis() function. In this case, we need to specify the strategy. The time strategy needs a date origin value. This value was created at the beginning, so we just need to send this as a parameter.
TickStrategy
We can set properties to the X and Y axes by using the getDefaultAxis() function. In this case, we need to specify the strategy.
The time strategy needs a date origin value. This value was created at the beginning, so we just need to send this as a parameter.
chart.getDefaultAxisX().setTickStrategy(AxisTickStrategies.DateTime, (tickStrategy) => tickStrategy.setDateOrigin(dateOrigin))Y-axis properties
As we can see, we are adding properties in a similar way as we did for the X-axis. The expansion scroll strategy will scroll to fit the Series that is out of view but it won’t shrink even if there is empty space (like “fitting” does).
Y-axis properties
As we can see, we are adding properties in a similar way as we did for the X-axis.
The expansion scroll strategy will scroll to fit the Series that is out of view but it won’t shrink even if there is empty space (like “fitting” does).
chart
    .getDefaultAxisY()
    .setTitle('USD')
    .setInterval({ start: 90, end: 110, stopAxisAfter: false })
    .setScrollStrategy(AxisScrollStrategies.expansion)
Chart data
To create the Candlestick figures, we need to use the OHLCSeries. This series type is used for visualizing trading figures.
const series = chart.addOHLCSeries({ positiveFigure: OHLCFigures.Candlestick })Generating random data
Creating random data and adding the values to the series:
const dataSpan = 10 * 24 * 60 * 60 * 1000
const dataFrequency = 1000 * 60
createOHLCGenerator()
    .setNumberOfPoints(dataSpan / dataFrequency)
    .setDataFrequency(dataFrequency)
    .setStart(100)
    .generate()
    .toPromise()
    .then((data) => {
        series.add(data)
    })
Line Chart
Finally, for the Android charts app, we’ll be adding a line chart. Remember that LightningChart JS can work as an embedded code wrapped within script tags.
<script src="lcjs.iife.js"></script>
<!--Actual chart related script tag-->
<script>
Extracting classes
const { lightningChart, AxisTickStrategies, Themes } = lcjsDateTime
Assigning a default DateTime origin for the axis:
const dateOrigin = new Date(2018, 0, 1)Chart object
We can specify the UI theme we want for the chart. The container property will point to an HTML object. This HTML object will be a DIV that will render the chart.
const chart = lightningChart().ChartXY({
    theme: Themes.turquoiseHexagon,
    container: 'target'
})
Tick Strategy
To customize the X and Y axes in a graph, we can use the getDefaultAxis() function. However, we need to specify which strategy to use. If we choose the time strategy, we will also need to provide a date origin value. Fortunately, this value was already created at the beginning, so we can simply send it as a parameter when setting the properties of the axis.
Tick Strategy
To customize the X and Y axes in a graph, we can use the getDefaultAxis() function. However, we need to specify which strategy to use.
If we choose the time strategy, we will also need to provide a date origin value.
Fortunately, this value was already created at the beginning, so we can simply send it as a parameter when setting the properties of the axis.
chart.getDefaultAxisX().setTickStrategy(AxisTickStrategies.DateTime, (tickStrategy) => tickStrategy.setDateOrigin(dateOrigin))Chart title
chart
    .setPadding({
        right: 50,
    })
    .setTitle('Diesel and Gasoline Price Comparison')
Data Array
Here’s a sample of the array for both diesel and gasoline variables.
const diesel = [
    { x: 0, y: 1.52 },
    { x: 1, y: 1.52 },
    { x: 2, y: 1.52 },
    { x: 3, y: 1.58 },
const gasoline = [
{ x: 0, y: 1.35 },
{ x: 1, y: 1.35 },
{ x: 2, y: 1.35 },
{ x: 3, y: 1.35 },LineSeries object
const lineSeries = chart.addLineSeries().setName('Diesel')

const lineSeries2 = chart.addLineSeries().setName('Gasoline')
LineSeries values
The X values are multiplied by dataFrequency to set the values properly on the X-Axis.
const dataFrequency = 1000 * 60 * 60 * 24
lineSeries2.add(diesel.map((point) => ({ x: point.x * dataFrequency, y: point.y })))
lineSeries.add(gasoline.map((point) => ({ x: point.x * dataFrequency, y: point.y })))
Set title and interval values to the Y axis
chart.getDefaultAxisY().setTitle('$/litre').setInterval({ start: 0, end: 3, stopAxisAfter: true })Adding the legend box to the chart
const legend = chart
    .addLegendBox()
    // Dispose example UI elements automatically if they take too much space. This is to avoid bad UI on mobile / etc. devices.
    .setAutoDispose({
        type: 'max-width',
        maxWidth: 0.3,
    })

// Add Chart to LegendBox.
legend.add(chart)
Running the App
There are two ways to execute the application:
- Using an android emulator
- Connecting a real android device to the pc.
The android emulator could be the fastest option, but you will need to have enough RAM memory and Disk space.
To configure a virtual device, go to tools->Device Manager-> Create Device:

Then just select the device you need, download, and install it. But if you have an Android device, I recommend using it… emulators can slow down your computer and you won’t have all the capabilities to test. Also, some features may not work properly in the emulator.
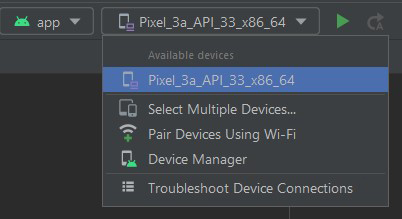
If you want to use a real device, you will have to activate the developer options on your phone. After that, connect your phone to your PC, and the Android Studio will set your device as a “Physical Device”. You can connect your physical phone to Android studio by selecting either of the options available in the drop-down list, e.g., using Wi-Fi:
Then just select the device you need, download, and install it.
But if you have an Android device, I recommend using it… emulators can slow down your computer and you won’t have all the capabilities to test.
Also, some features may not work properly in the emulator.
If you want to use a real device, you will have to activate the developer options on your phone.
After that, connect your phone to your PC, and the Android Studio will set your device as a “Physical Device”.
You can connect your physical phone to Android studio by selecting either of the options available in the drop-down list, e.g., using Wi-Fi:
On your phone, go to Developer Options > Wireless Debugging > Pair Using QR/pairing code and search for “Wireless Debug”. From there, you can connect your phone over the Wi-Fi by pairing it with Android Studio using the QR code in Android studio or the pairing code.
Your Android Studio application project will launch on your phone just like any other app. Here is the final result. I’m using a Samsung device and as you can see, the android charting application runs smoothly.
On your phone, go to Developer Options > Wireless Debugging > Pair Using QR/pairing code and search for “Wireless Debug”.
From there, you can connect your phone over the Wi-Fi by pairing it with Android Studio using the QR code in Android studio or the pairing code.
Your Android Studio application project will launch on your phone just like any other app.
Here is the final result. I’m using a Samsung device and as you can see, the android charting application runs smoothly.
For additional information about using JavaScript charts in Android with LightningChart JS, visit the GitHub repository.
Conclusion
Previously, we talked about starting charting app development in Android and heavily focused on configuring the Android environment. Although this time I still explained how to set up your project, this time we review 3 different JavaScript charts in Android.
Bar charts, line charts, and candlestick charts are simple and easy to interpret. Therefore, you can expect that around your Android developer career, you’ll need to create an application that requires any of those charts.
However, LightningChart JS offers a great variety of JavaScript charts that can be used in Android. Some are more specialized and perfect for science while others are easier to interpret by anyone. I really hope you can use this tutorial to create great Android charting applications and if any doubt, just send me a DM on LinkedIn
See you in the next article. – Omar
Although this time I still explained how to set up your project, this time we review 3 different JavaScript charts in Android.
Bar charts, line charts, and candlestick charts are simple and easy to interpret.
Therefore, you can expect that around your Android developer career, you’ll need to create an application that requires any of those charts.
However, LightningChart JS offers a great variety of JavaScript charts that can be used in Android.
Some are more specialized and perfect for science while others are easier to interpret by anyone. I
really hope you can use this tutorial to create great Android charting applications and if any doubt, just send me a DM on LinkedIn
See you in the next article.
– Omar

Omar Urbano
Software Engineer
Continue learning with LightningChart
Cleaning Memory Resources Correctly
Cleaning Memory Resources Correctly
High-Performance WPF Charts : The Truth
What about manufacturers’ claims about Fastest rendering charts? There are a lot of false marketing terms used in the industry, so we are going to tell the truth, based on facts that anyone can reproduce and verify.
No Results Found
The page you requested could not be found. Try refining your search, or use the navigation above to locate the post.


If you have any questions, feel free to contact us!
©LightningChart Ltd 2026. All rights reserved.