JavaScript Candlestick Chart
Also known as Japanese Candlestick Chart
Please note that using LightningChart JS for Trading use cases requires a special license agreement.
For more information, please contact us.
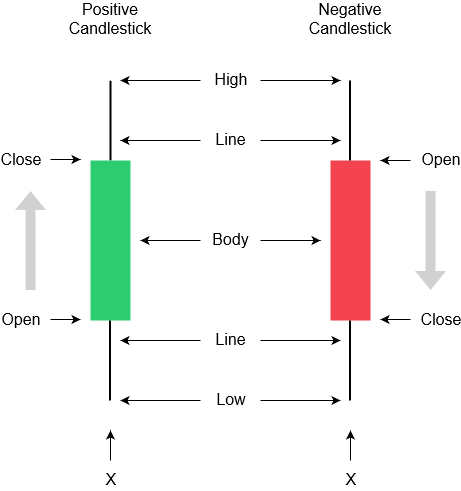
This example shows basic implementation of candlestick chart using OHLCSeries. This type of chart is used as a trading tool to visualize price movements. A candlestick figure can represent multiple recorded values, which are packed into 4 values (open, high, low and close). This makes it useful for dynamically displaying data from longer intervals as well as shorter.
OHLCSeries are created using ChartXY method.
const chart = lightningChart().ChartXY()
// Method for adding OHLCSeries takes one argument: seriesConstructor.
const ohlcSeries = chart.addOHLCSeries(
    // Specify type of figure used
    { seriesConstructor: OHLCFigures.Candlestick },
)
OHLCSeries accept data in the form of interface 'XOHLC':
const xohlc = [
    // X-position
    0,
    // Opening Y-value
    100,
    // Highest Y-value
    200,
    // Lowest Y-value
    50,
    // Closing Y-value
    75,
]
// Add new segment to series.
ohlcSeries.add(xohlc)
add() can be called with a single XOHLC-object or with an array of them.
Anatomy of a candlestick figure
Candlesticks are formed from two parts: Body and Lines. Both of these can be individually styled.