


Quasar JSCreate an Impressive Chart Application with Quasar JS
TutorialA performance-oriented JS framework with mobile and desktop compatiblity
Written by a human | Updated on April 9th, 2025
What is Quasar JS?
Hello!
In this article, we will create a basic application using the Quasar JS framework. In this application, we will load three charts from the LC JS Library. But before we start, it would be great to know a bit about what Quasar JS is. Some time ago, we worked with another similar framework (Electron JS), and with that framework, we were able to create and compile a desktop application using a Node JS project.
Well… with Quasar we can do the same but with some capabilities of other technologies such as Cordova or Ionic Capacitor… in other words… mobile applications. Another good thing is that Quasar is a framework based on Vue JS… so if you don’t know this framework, this would be a good introduction but if you’re already familiar with it, check our Vue data visualization template. If you need more details about Quasar, you can refer to their official Quasar website… but here I will mention some of the features.
Quasar JS Features
- A Vue.js framework
- You can be sure that your web and apps will get the latest modern UI
- Support cross-platform desktop and mobile compatibility including Safari for iOS.
- Best-in-class support for each build mode (SPA, SSR, PWA, Mobile app, Desktop app & Browser Extension) and the best developer experience through tight integration with their own developed CLI.
- You can easily customize it using CSS and expand functionalities with JavaScript
- It’s a high-performance-oriented framework
- It automatically removes “dead code” (tree-shakable)
- The good thing about Quasar JS is their tech support community on their forum and Discord
- Has a regular release cycle inclusive of new features
- It usually gets frequent updates based on its community requests
- Handles the whole development experience (including even creating your app’s icons and splash screens)
Before I finish this introduction, I would say that this project is my first experience learning how to use Quasar JS. I have been working for the last 2 years with Cordova and Ionic Capacitor, and I felt more comfortable with Quasar… it took me like 5 hours to learn and play with the look and feel.
The development reminds me of the classic Visual Studio MVC projects, using Bootstrap and JavaScript functions in the front end. Additionally, you can find LightningChart’s repository for Quasar charts on GitHub. Well… Let’s get started!
 Download the project to follow the tutorial
Video Project
The next video shows the final result made with Quasar JS and LightningChart JS. Is an application featuring three different chart types:
You’ll see that the interface is optimized for the end-user and is of a fast response. Each of the charts that you see has different characteristics but all are high-performance-oriented processing millions of data points in real time.
Learn more about Quasar JS and LightningChart JS in our GitHub repository.
Configuring the Template
- Please, download the template that is provided in this article.
- You will see a file tree like this one:
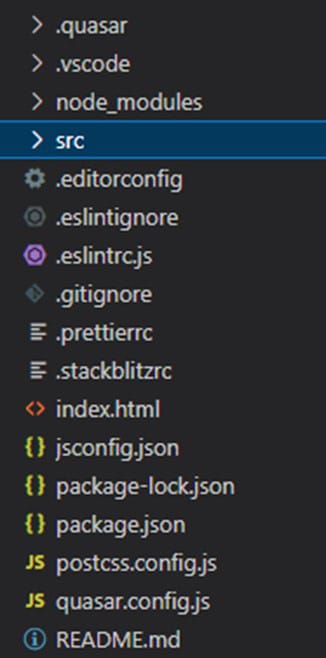
- Open a new terminal in Visual Studio Code
- As usual in a NodeJS project, you’ll have to run the NPM Install command.
The lightning Chart JS library is included in the package.json file, so this will be ready for use after the NPM install.
Project Content
I will explain the content of the project and the logic of how it works… the code is very easy to understand, so I think you won’t have issues.
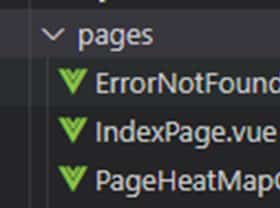
Pages folder
- This folder contains some Vue files. A Vue looks very similar to a standard HTML page… for example, we will have the script section, some HTML Tags, and the Style section.
The main change on a Vue file would be the name of the HTML tags… these tags are related to the Vue.js libraries. See more about Vue.js Single-File Components (SFCs) here.
If you open the indexPage.vue, you will see an almost empty template… this is because we don’t need to show anything on the “initial” page.
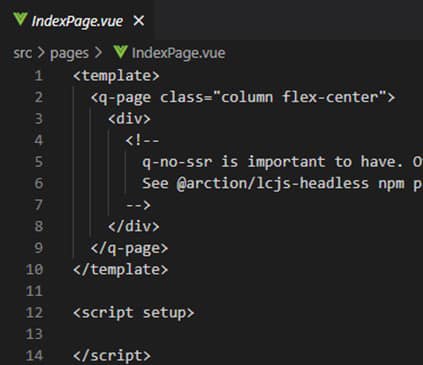
But, if we open any chart page, we will see a little difference:

We are importing a component… the components have (encapsulated) our JavaScript code… in this case, our LightningCharts. The way to import a component is very simple: the same way as we import a JSON file. The imported component can be called an “HTML” tag… in this case <Chart1/>.
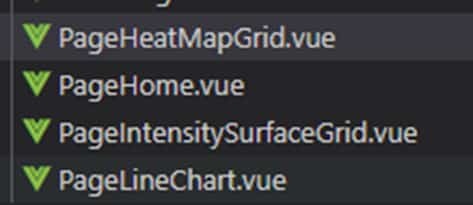
- PageHeatMapGrid = contains the page template for the Heatmap Grid page.
- PageHome = contains the initial template that will be shown when the app starts.
- PageIntensitySurfaceGrid = contains the page template for the Surface Grid chart.
- PageLineChart = contains the page template for the Line Chart code.
Components
Here we will have all our Vue instances… basically, the logic layer for our project.
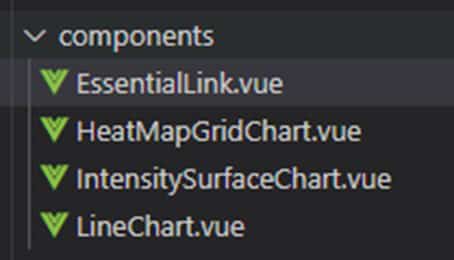
- HeatMapGrid = contains the Heat Map Grid chart code.
- EssentialLink = contains the template and Vue properties for the application’s hamburger menu.
- IntensitySurfaceGrid = contains the Intensity Surface Grid chart code.
- LineChart = contains the Line Chart code.
If you checked our previous articles, the code in those files will be familiar to you. If you need a detailed example of those charts, here are the articles of them:
Now I’ll do a quick explanation of the code structure.
Template Section:
<template>
  <div style="height: 500px" ref="el"></div>
  <button @click="setData">Set Data</button>
</template>
Inside this tag, you will be able to work with HTML and CSS properties. If you want a specific size of your chart or a background color, you can define it in this section.
- Script Section: Inside this section, we will put all our JS code for the chart.
- Export hook: This refers to the root instance of Vue from which the rest of the application descends. We can leave all the imports and global variables out of this section.
import { createWaterDropDataGenerator } from '@arction/xydata';

const HEATMAP_COLUMNS = 1024;
const HEATMAP_ROWS = 1024;

export default {
  data() {
    this.dashboard = null;
    this.heatmapSeries2D = null;
    return {};
  },
methods: {- Mounted hook:
This hook is part of the lifecycle process in Vue. I would say that Mounted would be the most common hook here. Vue calls this hook when the component is added to the DOM. Inside this hook, we will see all the calculations, properties, and instances for the chart.
mounted() {
    // Initialize empty Dashboard and charts.
    this.dashboard = lightningChart()
      .Dashboard({
        numberOfColumns: 1,
        numberOfRows: 1,
        theme: Themes.dark,
        container: this.$refs.el,
      });

    const chart2D = this.dashboard
      .createChartXY({
        columnIndex: 0,
        rowIndex: 0,
      })
.setTitle('Generating test data ...');- Unmounted hook: With the unmounted hook, we can specify the object to be removed from the DOM based on a condition. The dashboard object will contain the generated chart.
unmounted() {
    dashboard.dispose();
  },
};- Layout: The Main Layout file will contain all the loaded pages in our application. Also, here we will have the header, footer, and menu objects.
Header:
<q-header elevated>
      <q-toolbar>
        <q-btn
          flat
          dense
          round
          icon="menu"
          aria-label="Menu"
          @click="toggleLeftDrawer"
        />
Menu:
<q-drawer v-model="leftDrawerOpen" show-if-above bordered  style="background-color:white;border: 0">
      <q-list>
        <q-item-label header style="background-color:black;color:white">Menu</q-item-label>

        <EssentialLink
          v-for="link in essentialLinks"
          :key="link.title"
          v-bind = "link"
        />
      </q-list>
    </q-drawer>
The Quasar drawer is basically the side bar, this can be used in the left or right. To construct dynamically the menu, we will use the “EssentialLink” component.
Router-View:
<q-page-container>
      <router-view v-slot="{ Component }">
        <keep-alive>
          <component :is="Component" />
        </keep-alive>
  </router-view>
Inside this tag will show all the components executed by the router component. The keep-alive component will allow us to cache all the component instances when we switch between multiple components.
EssentialLinks:
<script>
import { defineComponent, ref } from 'vue';
import EssentialLink from 'components/EssentialLink.vue';

const linksList = [
  {
    title: 'home',
    caption: 'LightningChart',
    icon: 'ti-home',
    to: '/PageHome'
  },
  {
    title: 'Line Chart',
    caption: 'LightningChart JS',
    icon: 'ti-bar-chart',
    to: '/PageLineChart'
  },
Inside this array object, we will specify the properties of each element in the menu. The “to:” property should be the same specified path in the router component.
Route Component:
const routes = [
  {
    path: '/',
    component: () => import('layouts/MainLayout.vue'),
    children: [
      { path: '', component: () => import('pages/IndexPage.vue') },
      { path: '/PageLineChart', component: () => import('pages/PageLineChart.vue') },
      { path: '/PageHeatMapGrid', component: () => import('pages/PageHeatMapGrid.vue') },
      { path: '/PageIntensitySurfaceGrid', component: () => import('pages/PageIntensitySurfaceGrid.vue') },
      { path: '/PageHome', component: () => import('pages/PageHome.vue') }
    ],
  },
Here we will specify the paths for all our pages.
Please notice:
The components should be always named using a multi-word structure except for the root app components as well as those built-ins provided by Vue, e.g., <transition> or <component>. Read more about this here.
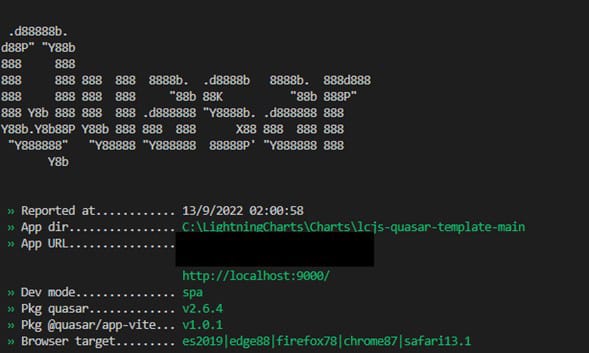
Running the Quasar JS Chart Application
Open a new terminal and run the npm run dev command and if everything is correct, you will see a message like the next one. Finally, the browser should open, if not, you can use the localhost path in your browser.
Conclusion: Quasar JS Chart Application
Here’s the application you’ve created. A totally interactive, high-performance, and modern charting application that can serve you as a seed project for future development.

Notice that LightningChart JS has more than 100 different chart examples including finance, science, vibration analysis, etc. Now about Quasar JS, this is a great framework for mobile/web development. The learning process is not too complicated, as there is enough documentation and examples to make everything easier.
I really liked working with CSS properties in a very simple way. Regarding performance and compatibility, I was able to use the LightningChart JS library with minimal changes… I just had to move some of the code to the correct Vue hooks.
If you want to start with mobile development using JavaScript but your experience with this type of project is not enough… Quasar could be the best option. If you have experience with HTML and embedded JavaScript, this transition will be familiar to you.
See you in the next article!

Omar Urbano
Software Engineer
Continue learning with LightningChart

Elliott Wave Theory in Trading
Financial markets often appear chaotic, but many traders believe that price movements follow recurring patterns driven by human psychology. One of the most influential approaches based on this idea is the Elliott Wave Theory. Developed nearly a century ago, it remains one of the most widely studied methods of technical analysis.

The Head and Shoulders Pattern in Technical Analysis
The Head and Shoulders Pattern in Technical Analysis The Head and Shoulders Pattern in Technical Analysis The Head and Shoulders pattern is one of the most recognized and widely used chart patterns in technical analysis. It is considered a reliable reversal pattern...

Best Telerik Charts Alternative in 2026: GPU Performance for WPF, WinForms, and Web
Telerik from Progress is a comprehensive UI component suite covering WPF, WinForms, ASP.NET, Blazor, and JavaScript. The charting components: RadChartView for WPF and WinForms, and Kendo UI Charts for web and Blazor, arrive bundled with the suite purchase. For teams...


If you have any questions, feel free to contact us!
©LightningChart Ltd 2026. All rights reserved.