









Announcing LightningChart JS v9.0.0
In this release
- AI and agentic development: updated materials and MCP server
- Negative log axes and symlog charts
- Multi-threaded real-time streaming (10M data points per second)
- AreaRangeSeries rework
- DataSet follow mode
- DataSet derived data properties
- 3D series DataSet connection and automatic data cleaning
- Freeform 3D camera movement
- BigInt64Array storage support
- Migration guide
The DataSet Update
LightningChart JS version 9.0.0 is available today, August 5th 2026. This is a major version release centered around one architectural shift that improves nearly every part of the library: the DataSet API. The DataSet system has now been extended to cover 3D series and AreaRangeSeries, brought multi-threaded real-time FIFO data streaming, and gained new data property capabilities that make complex multi-series applications far simpler to architect.
1. AI and Agentic Development: Updated MCP Server and Documentation
The field of agentic software development is moving fast. LightningChart JS v9.0.0 ships with updated materials that reflect the new v9.0.0 APIs, especially the DataSet changes.
Find the latest materials at lightningchart.com/js-charts/docs/lc-and-ai/
The official LightningChart JS MCP Server makes it easier than ever to develop high-performance data visualization with AI agents. Install the MCP server and your agent switches from general-purpose open-source charting libraries to the most performance-optimized charts available for the web. The MCP server now supports both STDIO and HTTPS transport, making it compatible with the widest range of agent environments:
-
Claude Code:
claude mcp add lightningchart-js -- npx -y @lightningchart/mcp-server@latest -
Cursor, Windsurf, Cline, Roo Code:
add via MCP settings with commandnpx -y @lightningchart/mcp-server -
OpenAI Codex and VS Code tools:
use the LightningChart JS Agent Skill (github.com/Lightning-Chart/lightningchart-js-agent-skill)
2. Negative Log Axes and Symlog Charts
LightningChart JS logarithmic axes now support negative values. This is a frequently requested capability in scientific and financial visualization, where data spans both positive and negative domains but the magnitude of change is more meaningful than the absolute value.
Symlog charts
Combining negative log axis support with stacked axes and the DataSet API, it is now possible to build a symlog chart a single chart that applies negative logarithmic scaling below zero, a linear scale near zero, and positive logarithmic scaling above zero. This chart type is particularly valuable in financial analytics, chemistry, and any domain where data spans many orders of magnitude on both sides of zero.
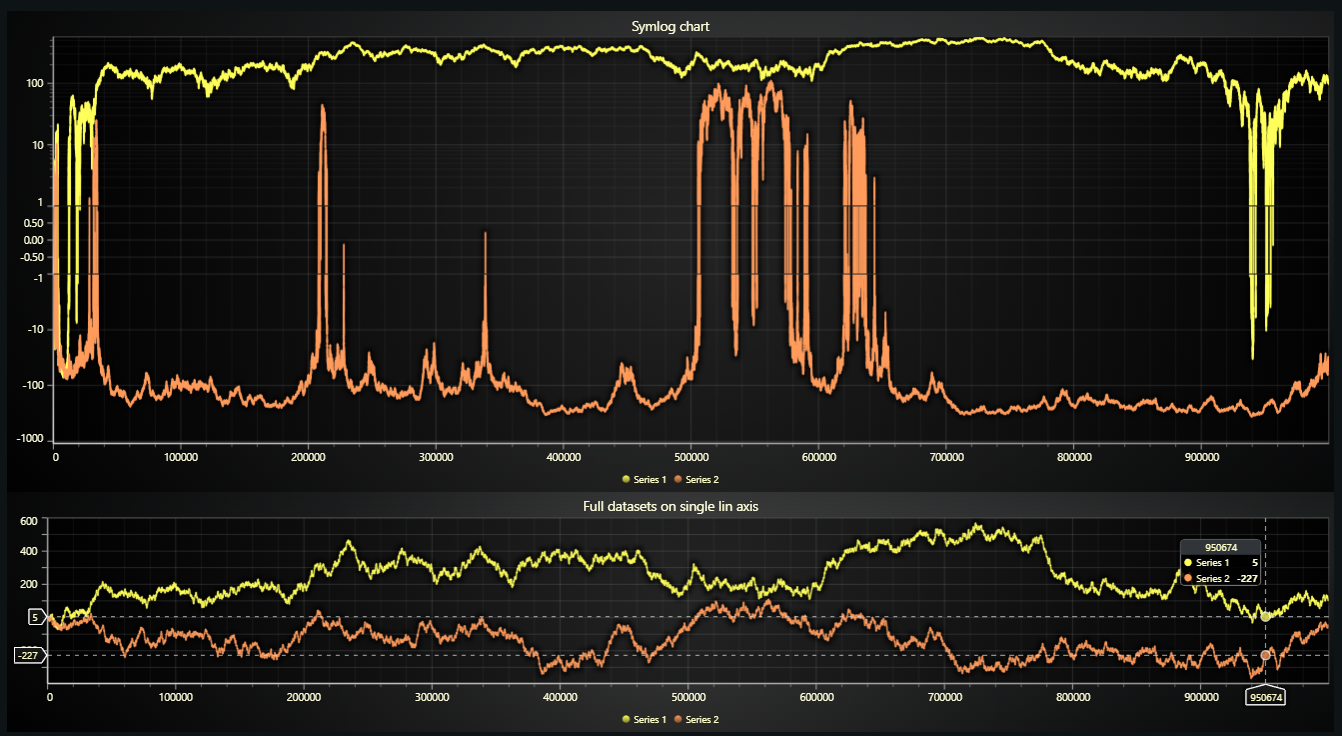
Symlog Scale Line Chart
NEW FEATURE
3. Multi-Threaded Real-Time Streaming: 10 Million Data Points Per Second
LightningChart JS v9.0.0 introduces ground-breaking technology for real-time streaming data visualization. It is now possible to separate data-receiving work from the browser’s main thread using the Web Workers API, freeing the main thread entirely for rendering and user interaction.
In internal testing, this approach achieved 20 charts each with 10 trends at 50,000 Hz, sustained at 60 FPS. That is 10 million data points per second displayed in a single web application, a number that has never been achievable in a browser environment before.
The new multi-threaded streaming system supports both FIFO (first-in, first-out) scrolling and garbage-collected history management, so long-running sessions do not accumulate unbounded memory even at high data ingestion rates.
Previously, high-frequency data ingestion competed directly with chart rendering for the browser’s main thread. At high enough data rates, the main thread would saturate and frame rates would drop. With multi-threaded streaming, data arrives on a dedicated worker thread, the main thread does nothing but render, and both run at full speed simultaneously.
Interested in leveraging multi-threaded high-frequency streaming for your application?
NEW API
BREAKING CHANGE
4. AreaRangeSeries Rework
AreaRangeSeries has been fully migrated to the DataSet-based design used by XY line, point, and other series types. This brings two major improvements:
Massively improved performance
AreaRangeSeries performance is now on par with XY line and point series. Previous versions used a separate rendering path that limited the amount of data AreaRangeSeries could handle smoothly. With the DataSet migration, AreaRangeSeries can visualize the same data volumes as any other series type, at the same frame rates.
DataSet connectivity and memory sharing
AreaRangeSeries can now connect directly to LC DataSet objects. A single DataSet can feed a line series, a point series, and an AreaRangeSeries simultaneously with zero memory duplication.
AreaRangeSeries API has changed significantly in v9.0.0. If your application uses AreaRangeSeries, refer to the migration guide at lightningchart.com/js-charts/docs/migration-guides/v9.0.0/
5. DataSet Follow Mode
DataSets can now be built by adding additional data properties on top of an existing DataSet object. This is useful in architectures where you have a top-level data routing layer that receives and stores incoming streams, but which does not know how the data will be visualized.
With DataSet Follow mode, the visualization layer can hook up to an upstream DataSet and select any columns from it to display in any series type, without duplicating any memory.
6. DataSet Derived Data Properties
The Derived Properties API allows you to pass custom math functions to a DataSet object to automatically calculate additional data columns as source data is fed in. A practical example: adding a Simple Moving Average (SMA) column to an incoming price feed without manual calculation in your data pipeline.
PERFORMANCE
7. 3D Series DataSet Connection and Automatic Data Cleaning
3D line series and 3D point series now connect to LC DataSet objects, enabling the same management APIs as XY series: setMaxSampleCount, readBack, and all other DataSet operations. A single DataSet can now feed both a standard XY chart and a 3D chart simultaneously with no memory duplication.
This change is accompanied by heavy performance optimizations to 3D series rendering, particularly for PointSeries3D. LiDAR point clouds and other high-density 3D datasets will see significant performance improvements simply by upgrading to v9.0.0.
8. Freeform 3D Camera Movement
Chart3D user interaction now supports a Blender-style, freeform 3D camera movement scheme. Standard 3D chart interaction uses orbit controls where the camera rotates around a fixed point. Freeform camera movement lets the user navigate through the 3D scene freely, moving position and changing the view direction independently. Ideal for exploring 3D LiDAR scenes, volumetric medical data, or any 3D dataset where the user needs to navigate inside the data rather than orbit around it.
9. BigInt64Array Storage Support
LC DataSet objects now directly support storing BigInt data types via BigInt64Array typed arrays. This covers three common use cases:
-
Nanosecond timestamps: Standard JavaScript floats lose precision for nanosecond Unix timestamps.
BigInt64stores them exactly. -
Parquet files: Apache Parquet’s
INT64type maps directly toBigInt64Arrayfor lossless data loading. -
Generic large integer storage: Any use case where integer data does not fit in
float64.
The LC series do not support direct visualization of
BigInt data type, so there is still a conversion step that must be done before. For details refer to nanosecond timestamps guide. This change makes it easy to store the original BigInt alongside the converted values for usage in cursors, readback, custom interactions, etc.
10. Migration Guide
v9.0.0 is a backwards-incompatible release. Some previous API syntaxes have changed and may require updates to your application code when upgrading. The primary breaking change is the AreaRangeSeries API, which has been fully reworked as part of the DataSet migration.
Summary of breaking changes
- AreaRangeSeries API: The series creation and data-binding API has changed significantly. See the migration guide for the updated method signatures.
- 3D series DataSet binding: 3D line and point series now use the DataSet connection API. Code that previously passed data directly to these series types needs to be updated.
Updating
# npm
npm install @lightningchart/[email protected]# yarn
yarn add @lightningchart/[email protected]Links
- LightningChart JS product page: lightningchart.com/js-charts/
- Migration guide v9.0.0: lightningchart.com/js-charts/docs/migration-guides/v9.0.0/
- Full changelog: lightningchart.com/js-charts/docs/version-history/
- LightningChart JS and AI: lightningchart.com/js-charts/docs/lc-and-ai/
- Interactive examples: lightningchart.com/js-charts/interactive-examples/
- MCP Server on GitHub: github.com/Lightning-Chart/lightningchart-js-mcp-server
Get started with LightningChart JS v.9.0.0
See more news
LightningChart .NET v.12.6.1
LightningChart .NET v.12.6.1 is out now!Features of LightningChart® .NET version 12.6.1In this release we added new features, made several improvements and fixed dozens of errors. We upgraded target framework (from .NET 8.0 to 10.0), added Universal-Data-Parser...
Trend Lines in Trading
Trend lines are among the simplest yet most powerful tools in technical analysis. They help traders visualize market direction, identify potential support and resistance levels, and make more informed trading decisions. Despite their simplicity, trend lines remain a...
Announcement: Baumer as LightningChart customer
Enabling High-Performance Visualization of Industrial Sensor Data with LightningChartDiscover how Baumer uses LightningChart to configure and visualize data from a wide variety of industrial sensors and create responsive, data-rich visualization...
Best Python Charting Library in 2026
Python's charting ecosystem is large, overlapping, and regularly misunderstood. Most comparison guides stop at Matplotlib, Plotly, and Seaborn. This one goes further: it covers what happens when your datasets grow large, your update rates increase, or your chart types...



If you have any questions, feel free to contact us!



©LightningChart Ltd 2026. All rights reserved.