









Announcing LightningChart JS Trader v.4.1
New Product Features
LightningChart JS Trader 4.1 introduces a couple of new technical indicators and drawing tools. Furthermore, several user-requested features and improvements have been added to the library.
New technical indicators
Average Daily Range, Choppiness Index, and Hull Moving Average are now available. Similarly to other moving averages, the Hull Moving Average can also be used to smooth other indicators.
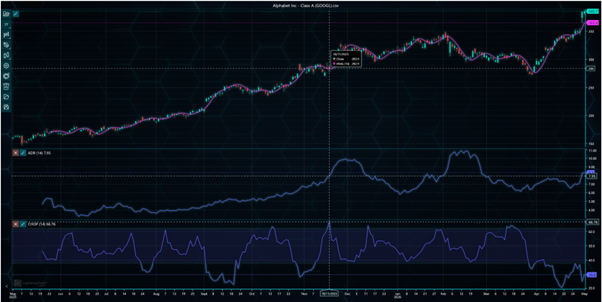
New technical indicators: Average Daily Range, Choppiness Index, and Hull Moving Average.
Freeform Line
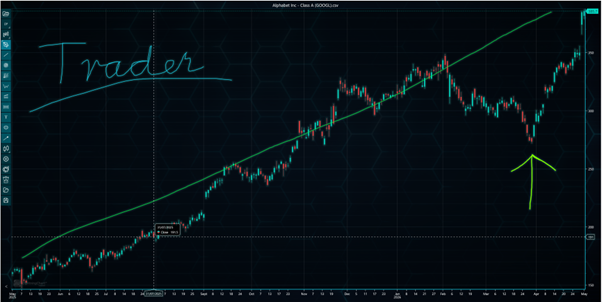
Freeform Line drawing tool has been added to LightningChart JS Trader. This brush-like tool allows users to draw lines and curves freely on the chart. The color and the width of the line can be freely modified.
New features and improvements
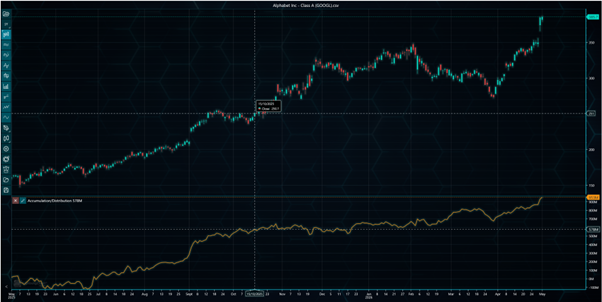
Data padding Data padding feature allows leaving empty space between the data and the chart edges. The space, defined in pixels, is added automatically when zooming the chart. This can make interpreting the chart easier as new values are not that close to the edge of the chart. Data padding can be set separately for top, bottom, left, and right edges.
Candlestick and Bar auto width
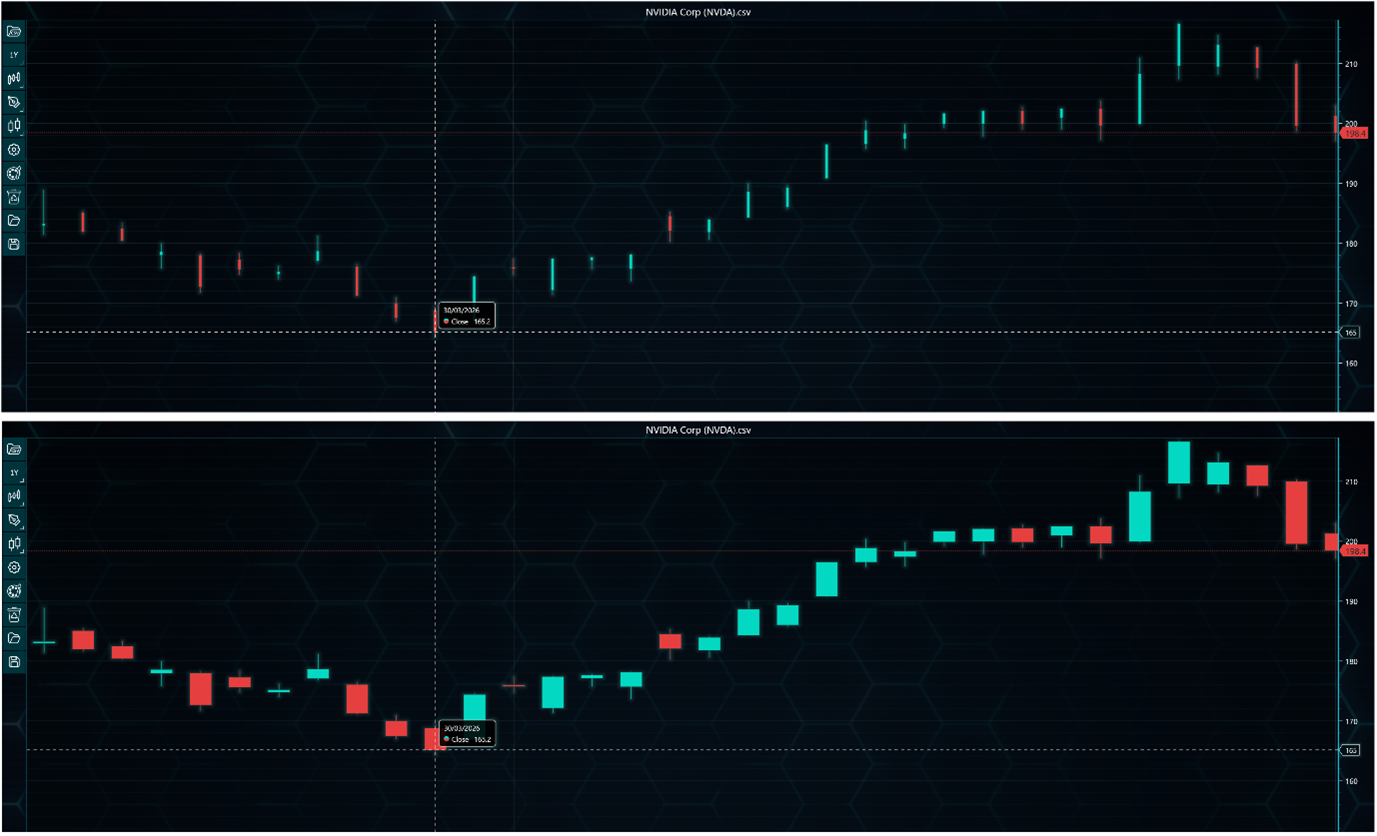
A new auto width feature has been added for chart types using candlesticks and bars. This feature automatically scales candles and bars when zooming closer to the data, leaving less empty space between data points. Auto width is enabled by default but can be disabled if old behaviour is preferred.
DateTime-Index conversions
Two new methods, convertDateTimeToIndex() and convertIndexToDateTime(), are now available to help converting between DateTime values and X-axis indexes. For example, you can easily check what time value the 100th data point has or what is the index of the point that was week ago.
Other notable improvements
- Prevented drawing tools to be drawn on top of the margins. Now they are all clipped correctly at the edges of the chart.
- Added more safety checks to all indicator calculations, preventing them from crashing the application in most, if not all cases.
- Indicator categories now open at the same location instead of next to the respective category button. The previous approach left a large gap between the indicator search bar and the indicator list.
Build better Fintech apps with LightningChart JS Trader v4.1
To learn more about this release, visit the documentation.
See more news
Announcement: Baumer as LightningChart customer
Enabling High-Performance Visualization of Industrial Sensor Data with LightningChartDiscover how Baumer uses LightningChart to configure and visualize data from a wide variety of industrial sensors and create responsive, data-rich visualization...
Best Python Charting Library in 2026
Python's charting ecosystem is large, overlapping, and regularly misunderstood. Most comparison guides stop at Matplotlib, Plotly, and Seaborn. This one goes further: it covers what happens when your datasets grow large, your update rates increase, or your chart types...
Best TradingView Charting Library Alternative
TradingView's charting libraries are the most visible option for fintech developers. Visibility is not the same as capability. This guide is for developers who have hit the wall on candle count limits, watermark restrictions, branding requirements, real-time...
Which JavaScript Chart Library Do AI Coding Agents Actually Recommend, and Does It Matter?
In this article Why AI coding agents have strong library preferences What the defaults actually are (and the data behind them) When the defaults work fine When they quietly fail you What to do instead: giving your agent better information The keyword angle nobody is...



If you have any questions, feel free to contact us!



©LightningChart Ltd 2026. All rights reserved.