









Announcing LightningChart JS Trader v.4.0
A release focused on user experience, flexibility, and real-time data streaming.
New Product Features
This release focuses on improving the user experience and flexibility when using the charts. These improvements bring new ways to configure the behaviour and appearance of a chart. Plotting data in real-time has also been significantly improved.
Latest price labels
LightningChart JS Trader now features built-in labels that indicate the latest close and latest indicator values. The built-in labels consist of the actual label on top of the price axis (Y-axis) and a horizontal line across the chart. Users can decide whether to show both the label and the line, only one of them, or hide the entire label.
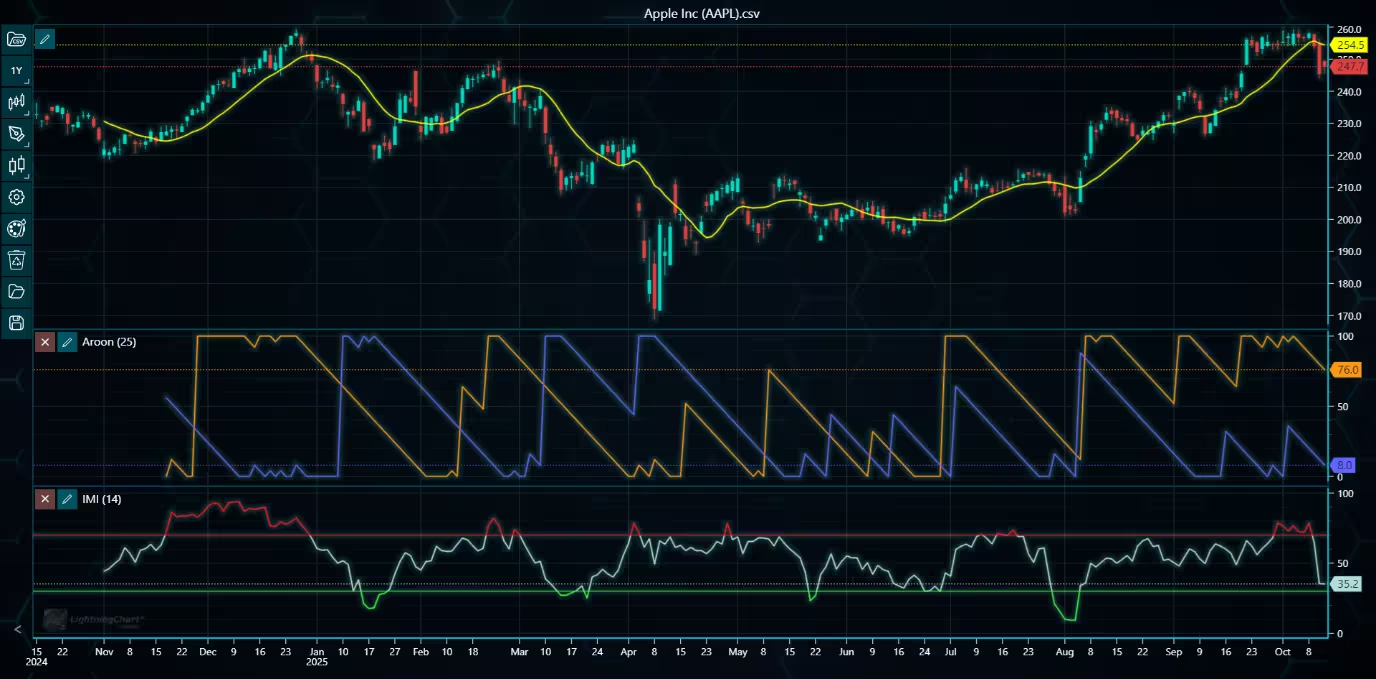
Example of a chart with value labels visible on top of the price axes.
Drawing tool events
Previously, the drawing tools had only one event available, DrawingToolMoved, which triggered when the tool was moved to another position on the chart. This release adds several pointer-related events to all drawing tools, including PointerDown, PointerUp, PointerEnter, and PointerLeave. These allow adding more custom interaction to the chart. In addition to the new pointer events, the default drawing tool menus can now be disabled in case the user wants to create custom menus.
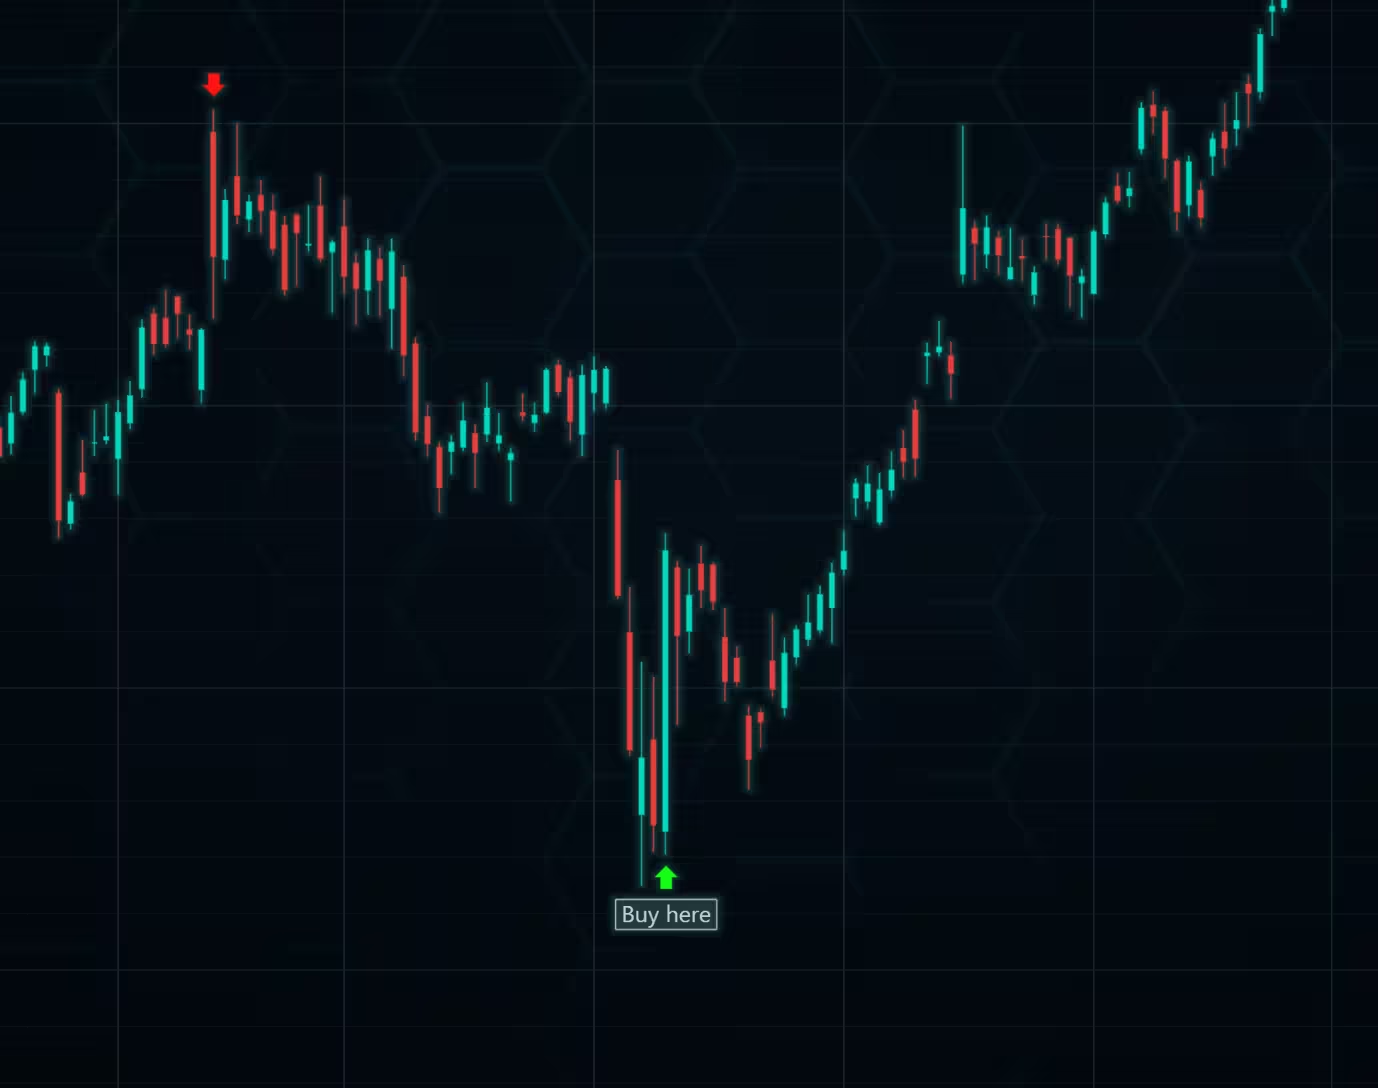
Drawing tool events used to show a text box when pointer is moved above the Arrow.
Real-time improvements
The main improvements to real-time charting include:
Now, zooming and panning features work as intended even in real-time applications. Previously, the zooming level would often reset whenever new data was added to the chart.
The chart now has a built-in feature to drop old data points that can be switched on and off via the enableDataPointLimit() method. Furthermore, setDataPointLimit() can be used to set the maximum number of data points allowed before the old ones are dropped.
The X-axis flickering issue present in previous versions is now fixed. The same fix also improves the overall performance of the chart in real-time applications. The X-axis labels are also more accurate now (fewer long gaps between the labels).
Automatic data sorting
Before version 4.0 of LightningChart JS Trader, data points had to be added in strictly increasing datetime order: each new point needed to have a later timestamp than the previous one. Version 4.0 introduces automatic data sorting, and the chart can now organize data on its own. You can add data in any order, and the chart will automatically reorder all points based on their datetime values to ensure correct visual representation.
Exposing the Internal Chart
LightningChart JS Trader is built on top of the standard LightningChart JS engine. In this release, a new getInternalChart() method is introduced, giving developers direct access to the underlying LightningChart instance used to render the TradingChart. With this access, you can use the full range of LightningChart JS features beyond what the TradingChart API exposes, offering much greater flexibility for customization.
Example: Changing the chart background using the internal chart
tradingChart.getInternalChart().setSeriesBackgroundFillStyle(
    new SolidFill({
        color: ColorRGBA(0, 0, 200)
    })
)
While the internal chart can be used to freely modify appearance or add custom functionality, it also has the potential to interfere with TradingChart’s built-in behavior. For this reason, any modifications should be made carefully. You can also access the Zoom Band’s internal chart through getZoomBandChart(). This allows separate customization of the zoom band, for example, applying a different background style.
Splitter line colors
Previous minor releases added methods to change the chart border and axis colors. In this release, a method to modify the colors of the splitter lines (lines separating the main chart and indicators) is added.
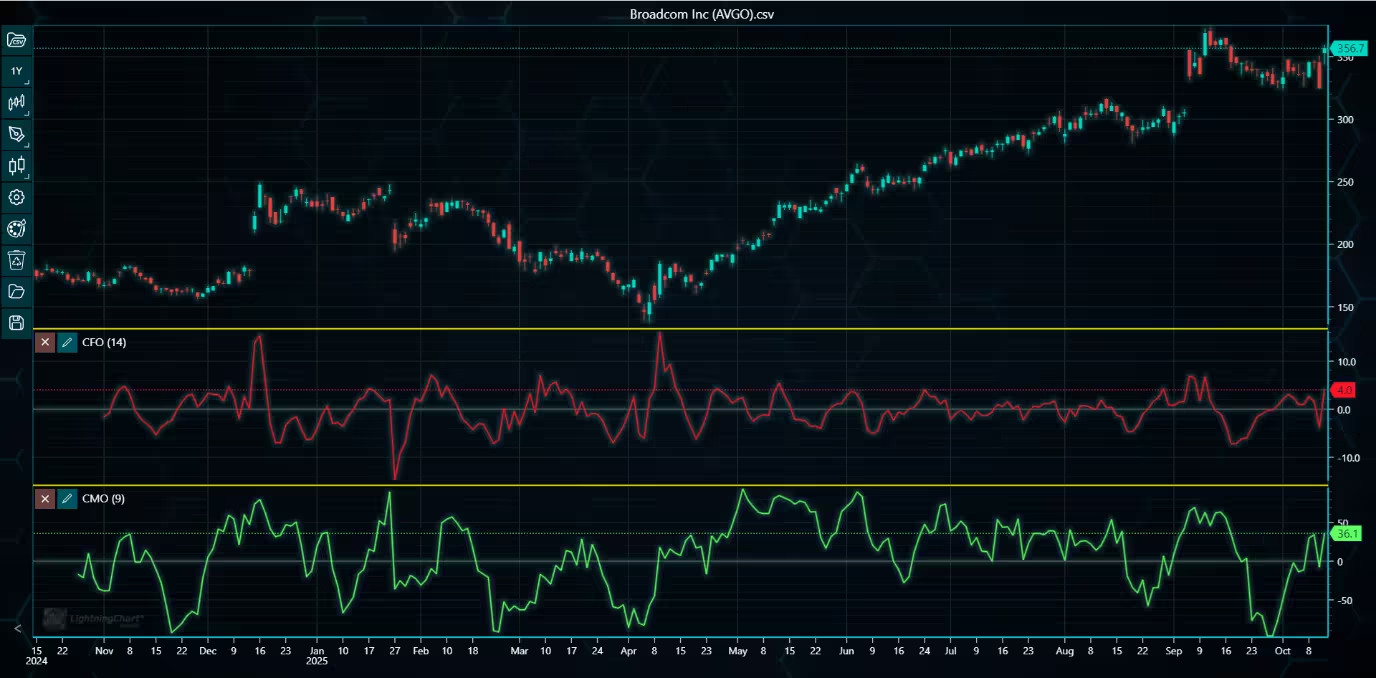
A chart with yellow splitter lines.
The getDataPointArray() method
This new method gets the current dataset as an array of DataPoints. The returned array is directly compatible with setData() method, allowing the dataset to be later added to the chart with ease.
Zooming sensitivity
Added a method and respective UI control to change the sensitivity of wheel zooming in case the default zooming speed feels too fast.
Bug Fixes and Other Improvements
Other notable bug fixes and improvements include:
- Fixed several drawing tool-related issues where the tools were drawn incorrectly.
- Added a method for all drawing tools to get their current position on the chart.
- Data cursor now works correctly with packed data.
- Restoring default settings correctly restores all chart and color settings and resets the chart type.
- Added a method to hide the indicator settings and remove buttons.
Built better Fintech apps with LightningChart JS Trader v4.0
To learn more about this release, visit the documentation.
See more news
LightningChart .NET v.12.6.1
LightningChart .NET v.12.6.1 is out now!Features of LightningChart® .NET version 12.6.1In this release we added new features, made several improvements and fixed dozens of errors. We upgraded target framework (from .NET 8.0 to 10.0), added Universal-Data-Parser...
Trend Lines in Trading
Trend lines are among the simplest yet most powerful tools in technical analysis. They help traders visualize market direction, identify potential support and resistance levels, and make more informed trading decisions. Despite their simplicity, trend lines remain a...
Announcement: Baumer as LightningChart customer
Enabling High-Performance Visualization of Industrial Sensor Data with LightningChartDiscover how Baumer uses LightningChart to configure and visualize data from a wide variety of industrial sensors and create responsive, data-rich visualization...
Best Python Charting Library in 2026
Python's charting ecosystem is large, overlapping, and regularly misunderstood. Most comparison guides stop at Matplotlib, Plotly, and Seaborn. This one goes further: it covers what happens when your datasets grow large, your update rates increase, or your chart types...



If you have any questions, feel free to contact us!



©LightningChart Ltd 2026. All rights reserved.