









LightningChart JS v.4.2 has been released!
Introducing new Developers’ Documentation, Polar heatmaps, improvements for Bar charts, and more!
Polar Heatmaps
Polar charts feature new series types which allow visualizing heatmaps within a polar coordinate system. This type of Polar chart is commonly used in the defense industry. Some key characteristics of the Polar Heatmaps are:
- Processing up to 4 million data points
- Super fast loading speed and CPU-efficient real-time updates
- 100 ms to fully show the heatmap populated with all the data
- Built-in data cursor feature
- Bilinear color interpolation between data points
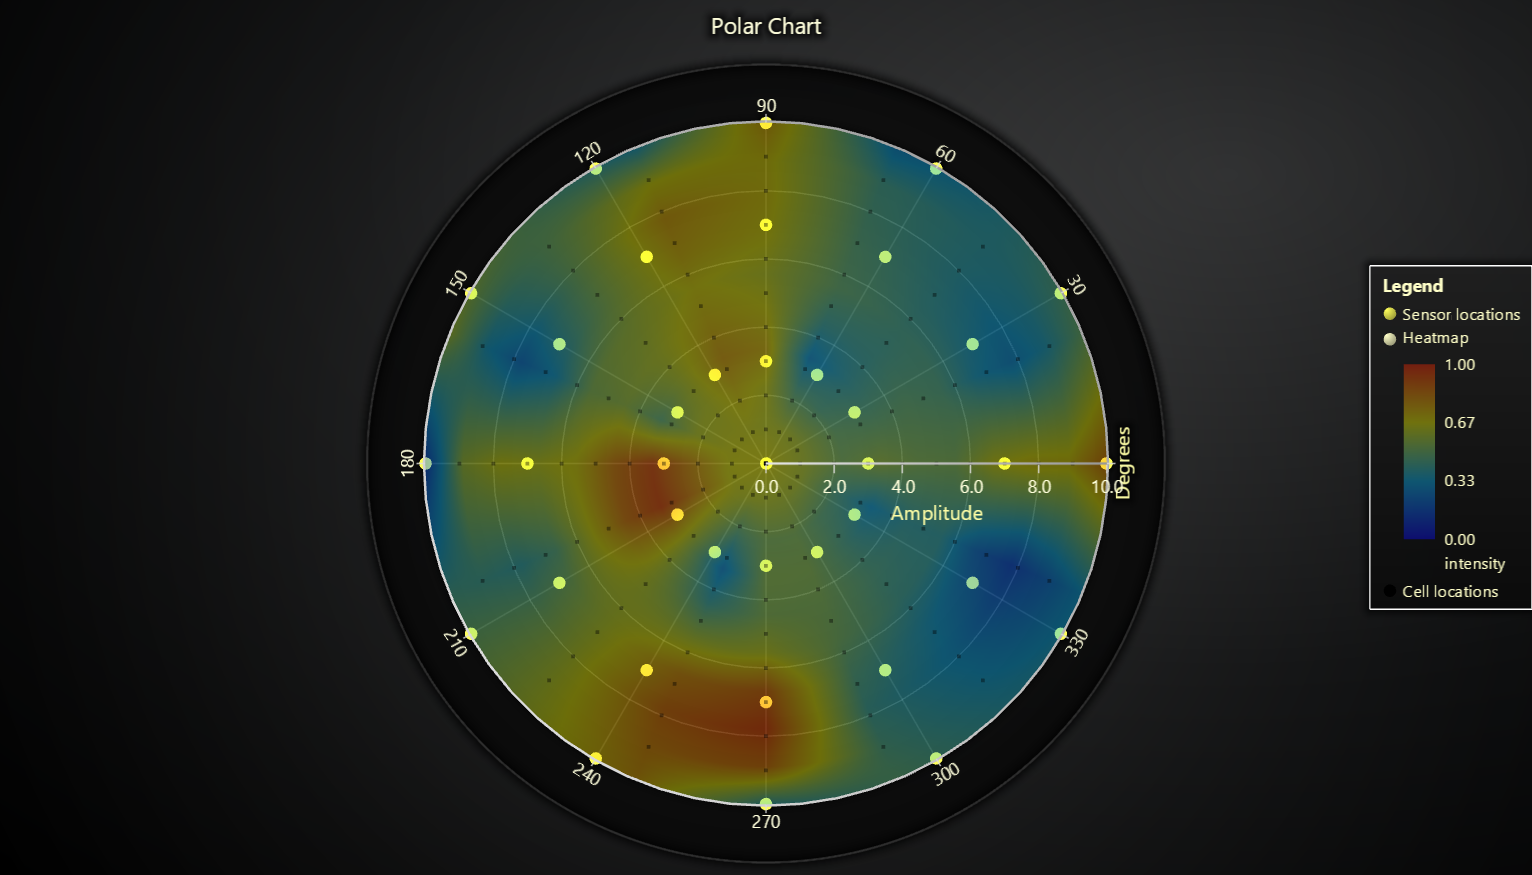
JavaScript Real-Time Polar Sensor Chart
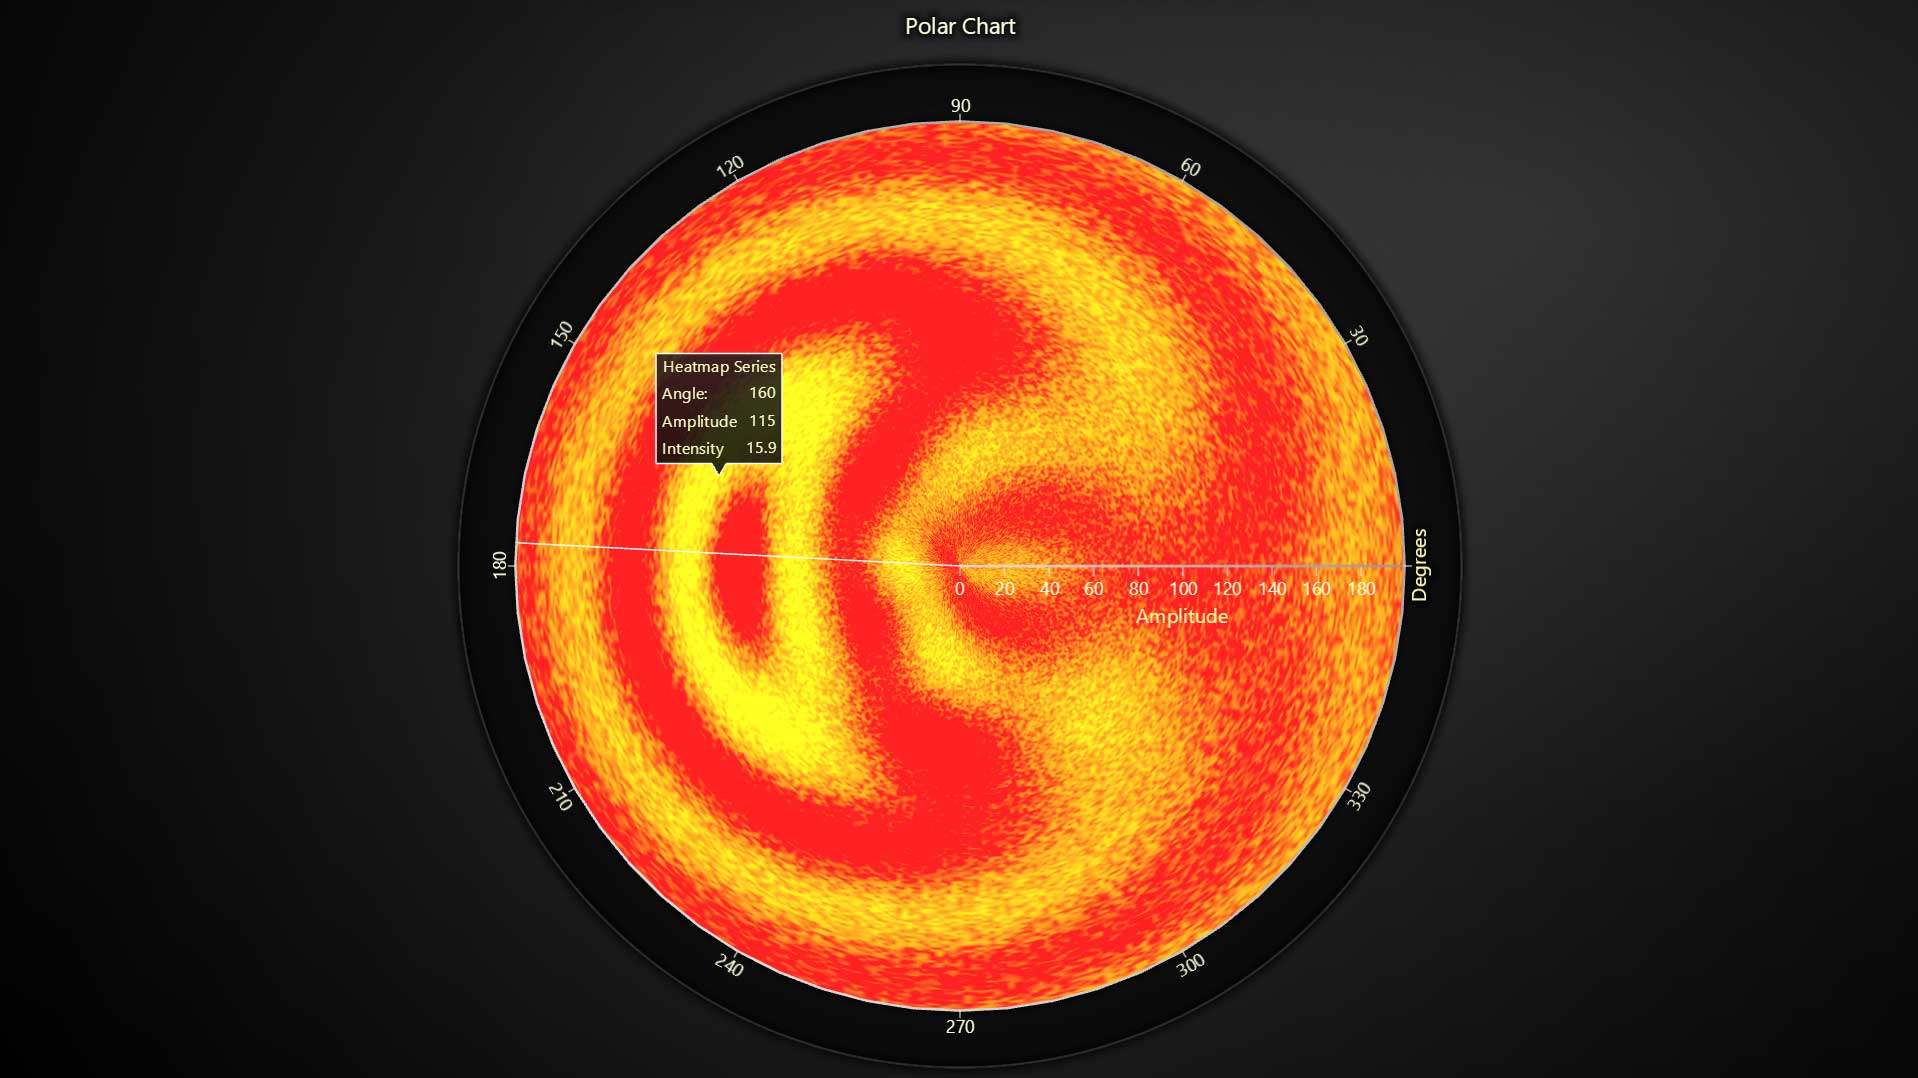
JavaScript Polar Radar Heatmap Chart
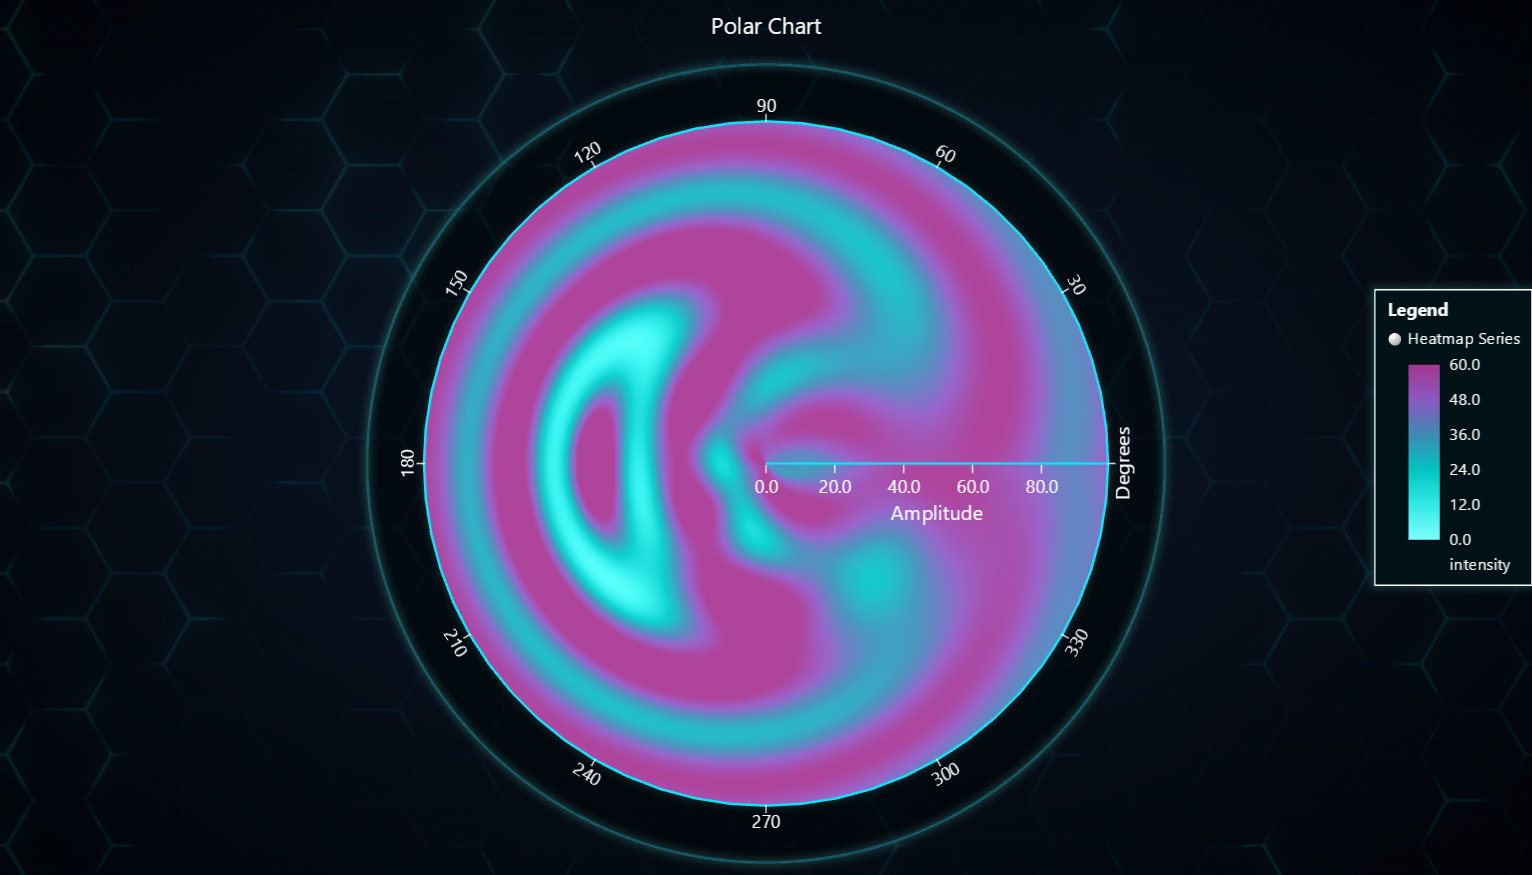
JavaScript Polar Heatmap Chart
Bar Charts
Bar charts are extensively used for visualizing categorical data and are considered a universal type of chart in different industries and applications. Bar charts are significantly used in Business Intelligence (BI) applications due to their effectiveness and simplicity in representing and analyzing data.
In this release, we’re introducing several features for our JavaScript bar charts, including:
- A convenient API that requires minimal configuration
- To create an interactive bar chart, simply plug in categorical data
- Built-in functions
- DataCursor
- Sorting
- Animations
- Overlapping label hiding
- Supports real-time data input
- Different configuration options for label placement and display
- Custom events can be added for drill-drown or extended cursor functionality
- High-performance
- Supports visualization of a few to hundreds of bar charts at top-performance
- Fully-customizable styling options
- Possible to override the default visual appearance
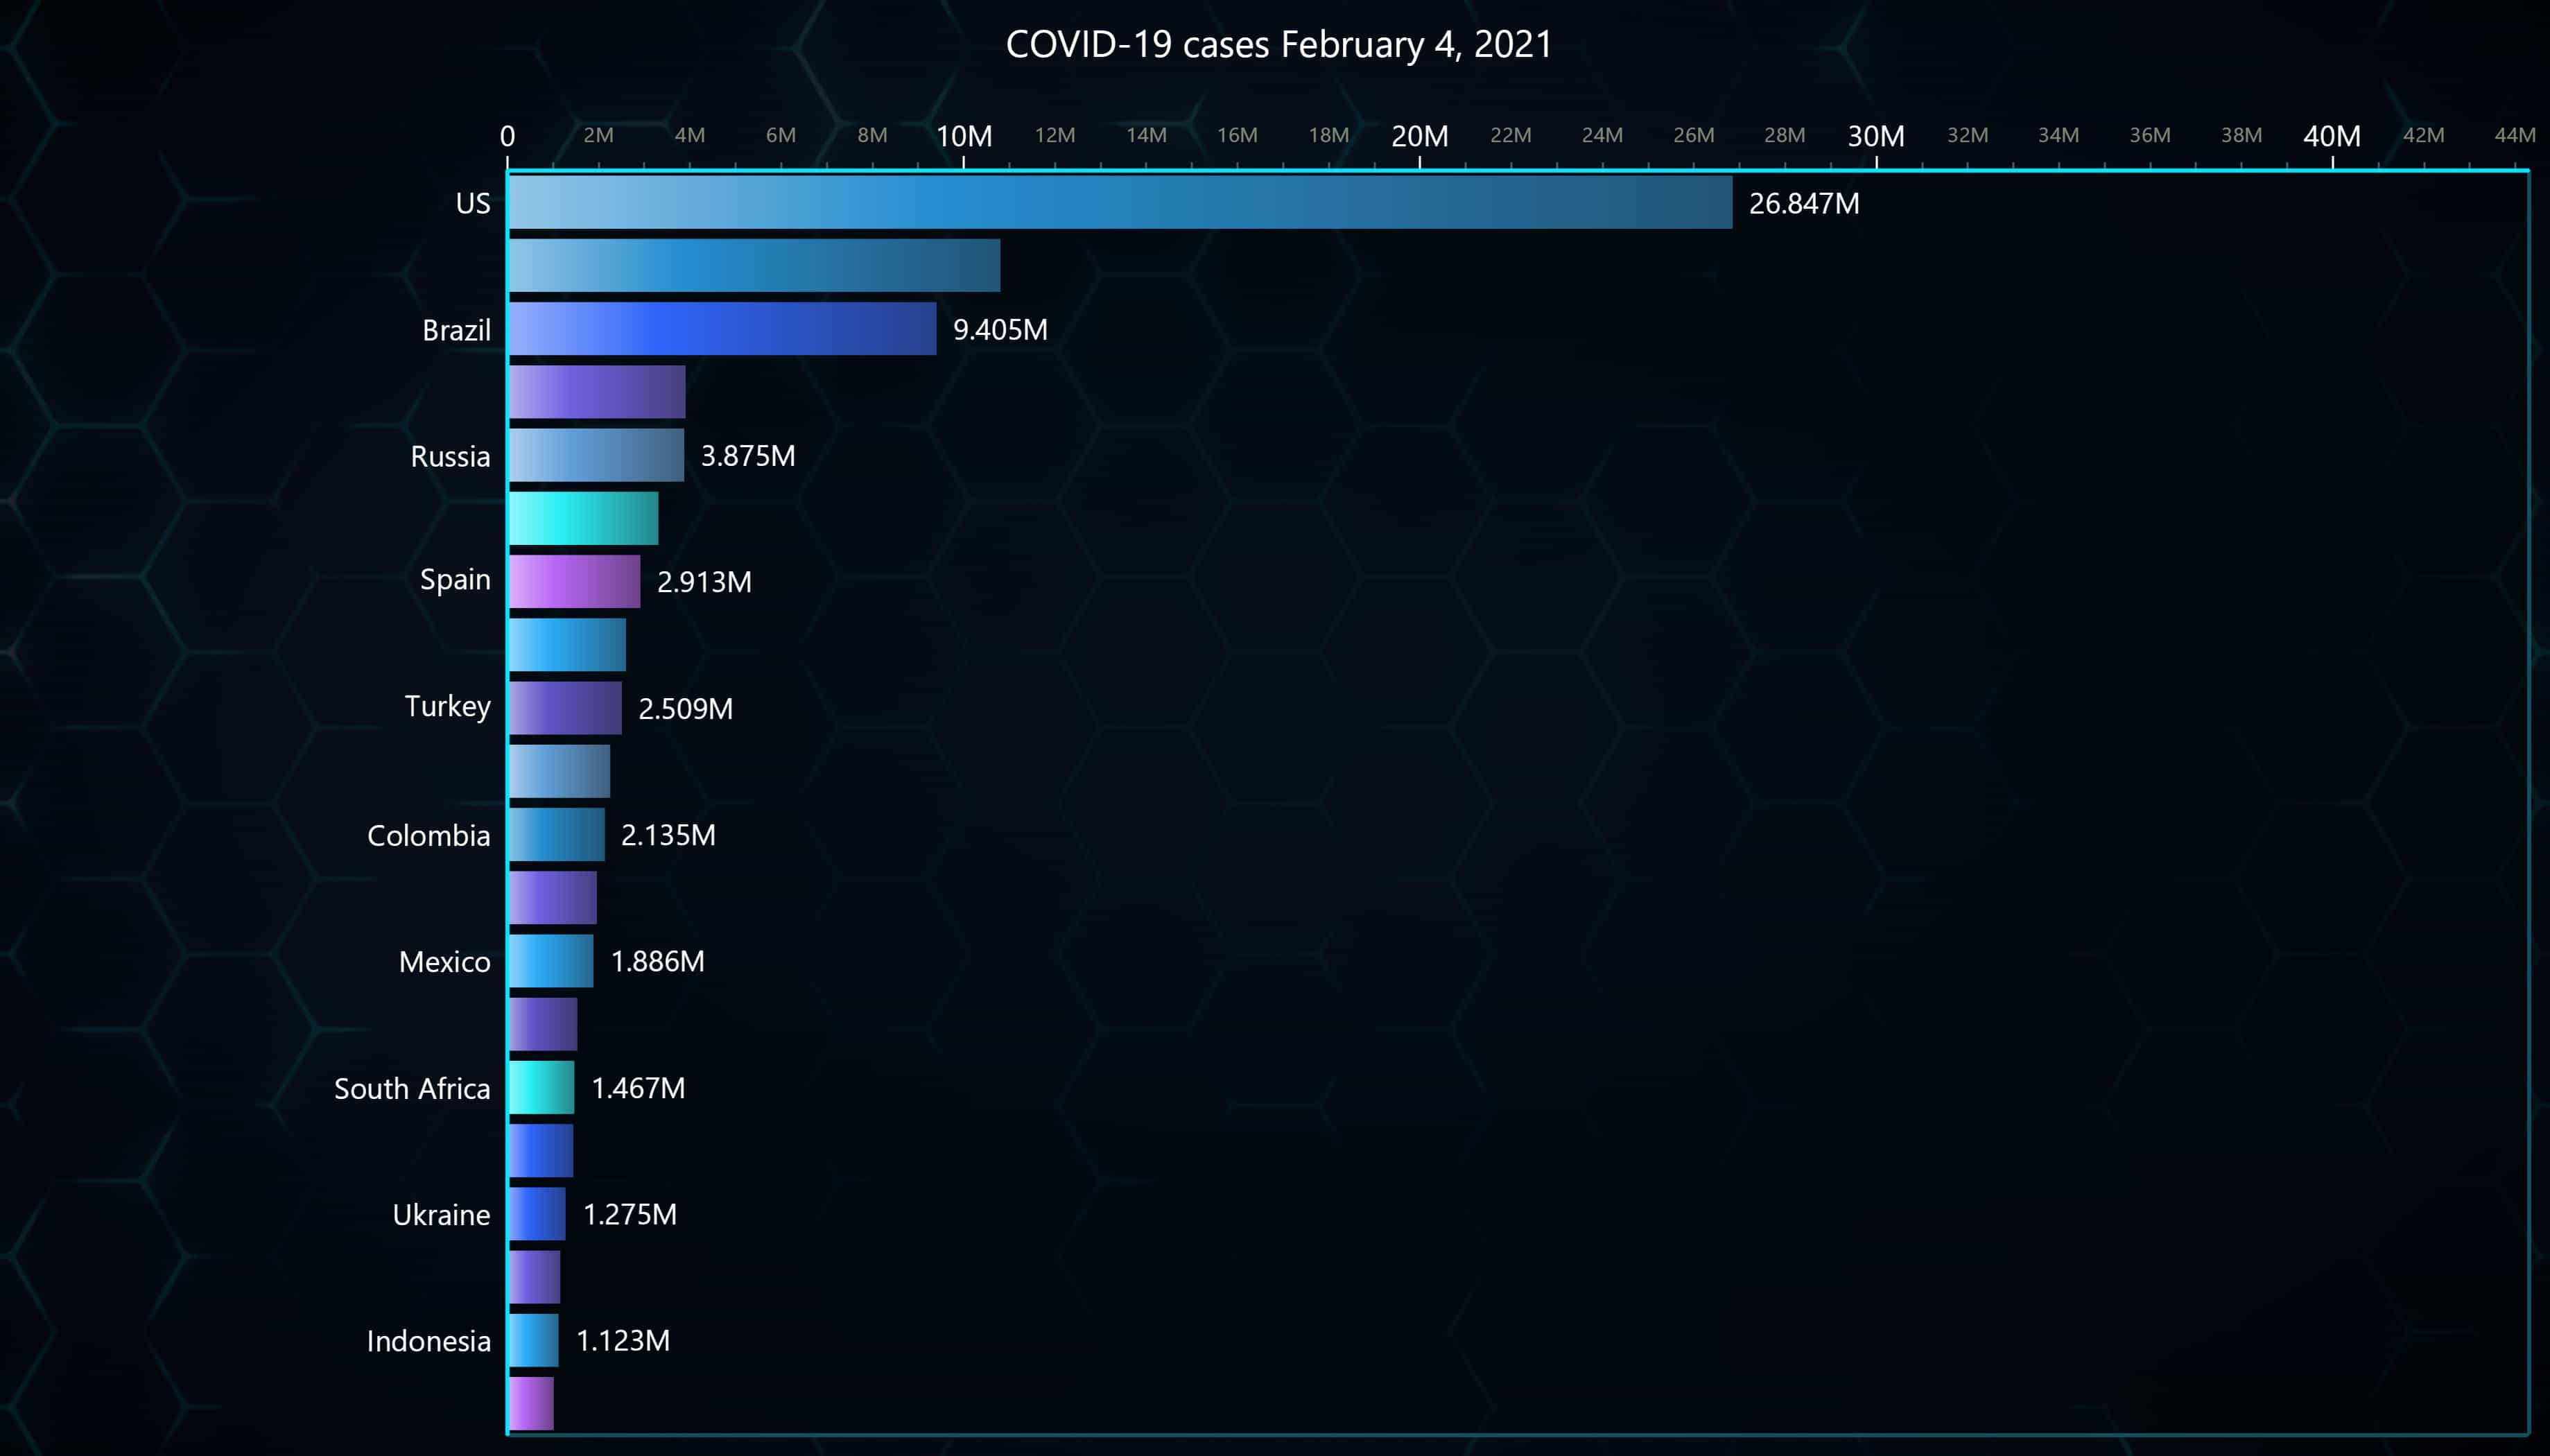
JavaScript Racing Bar Chart
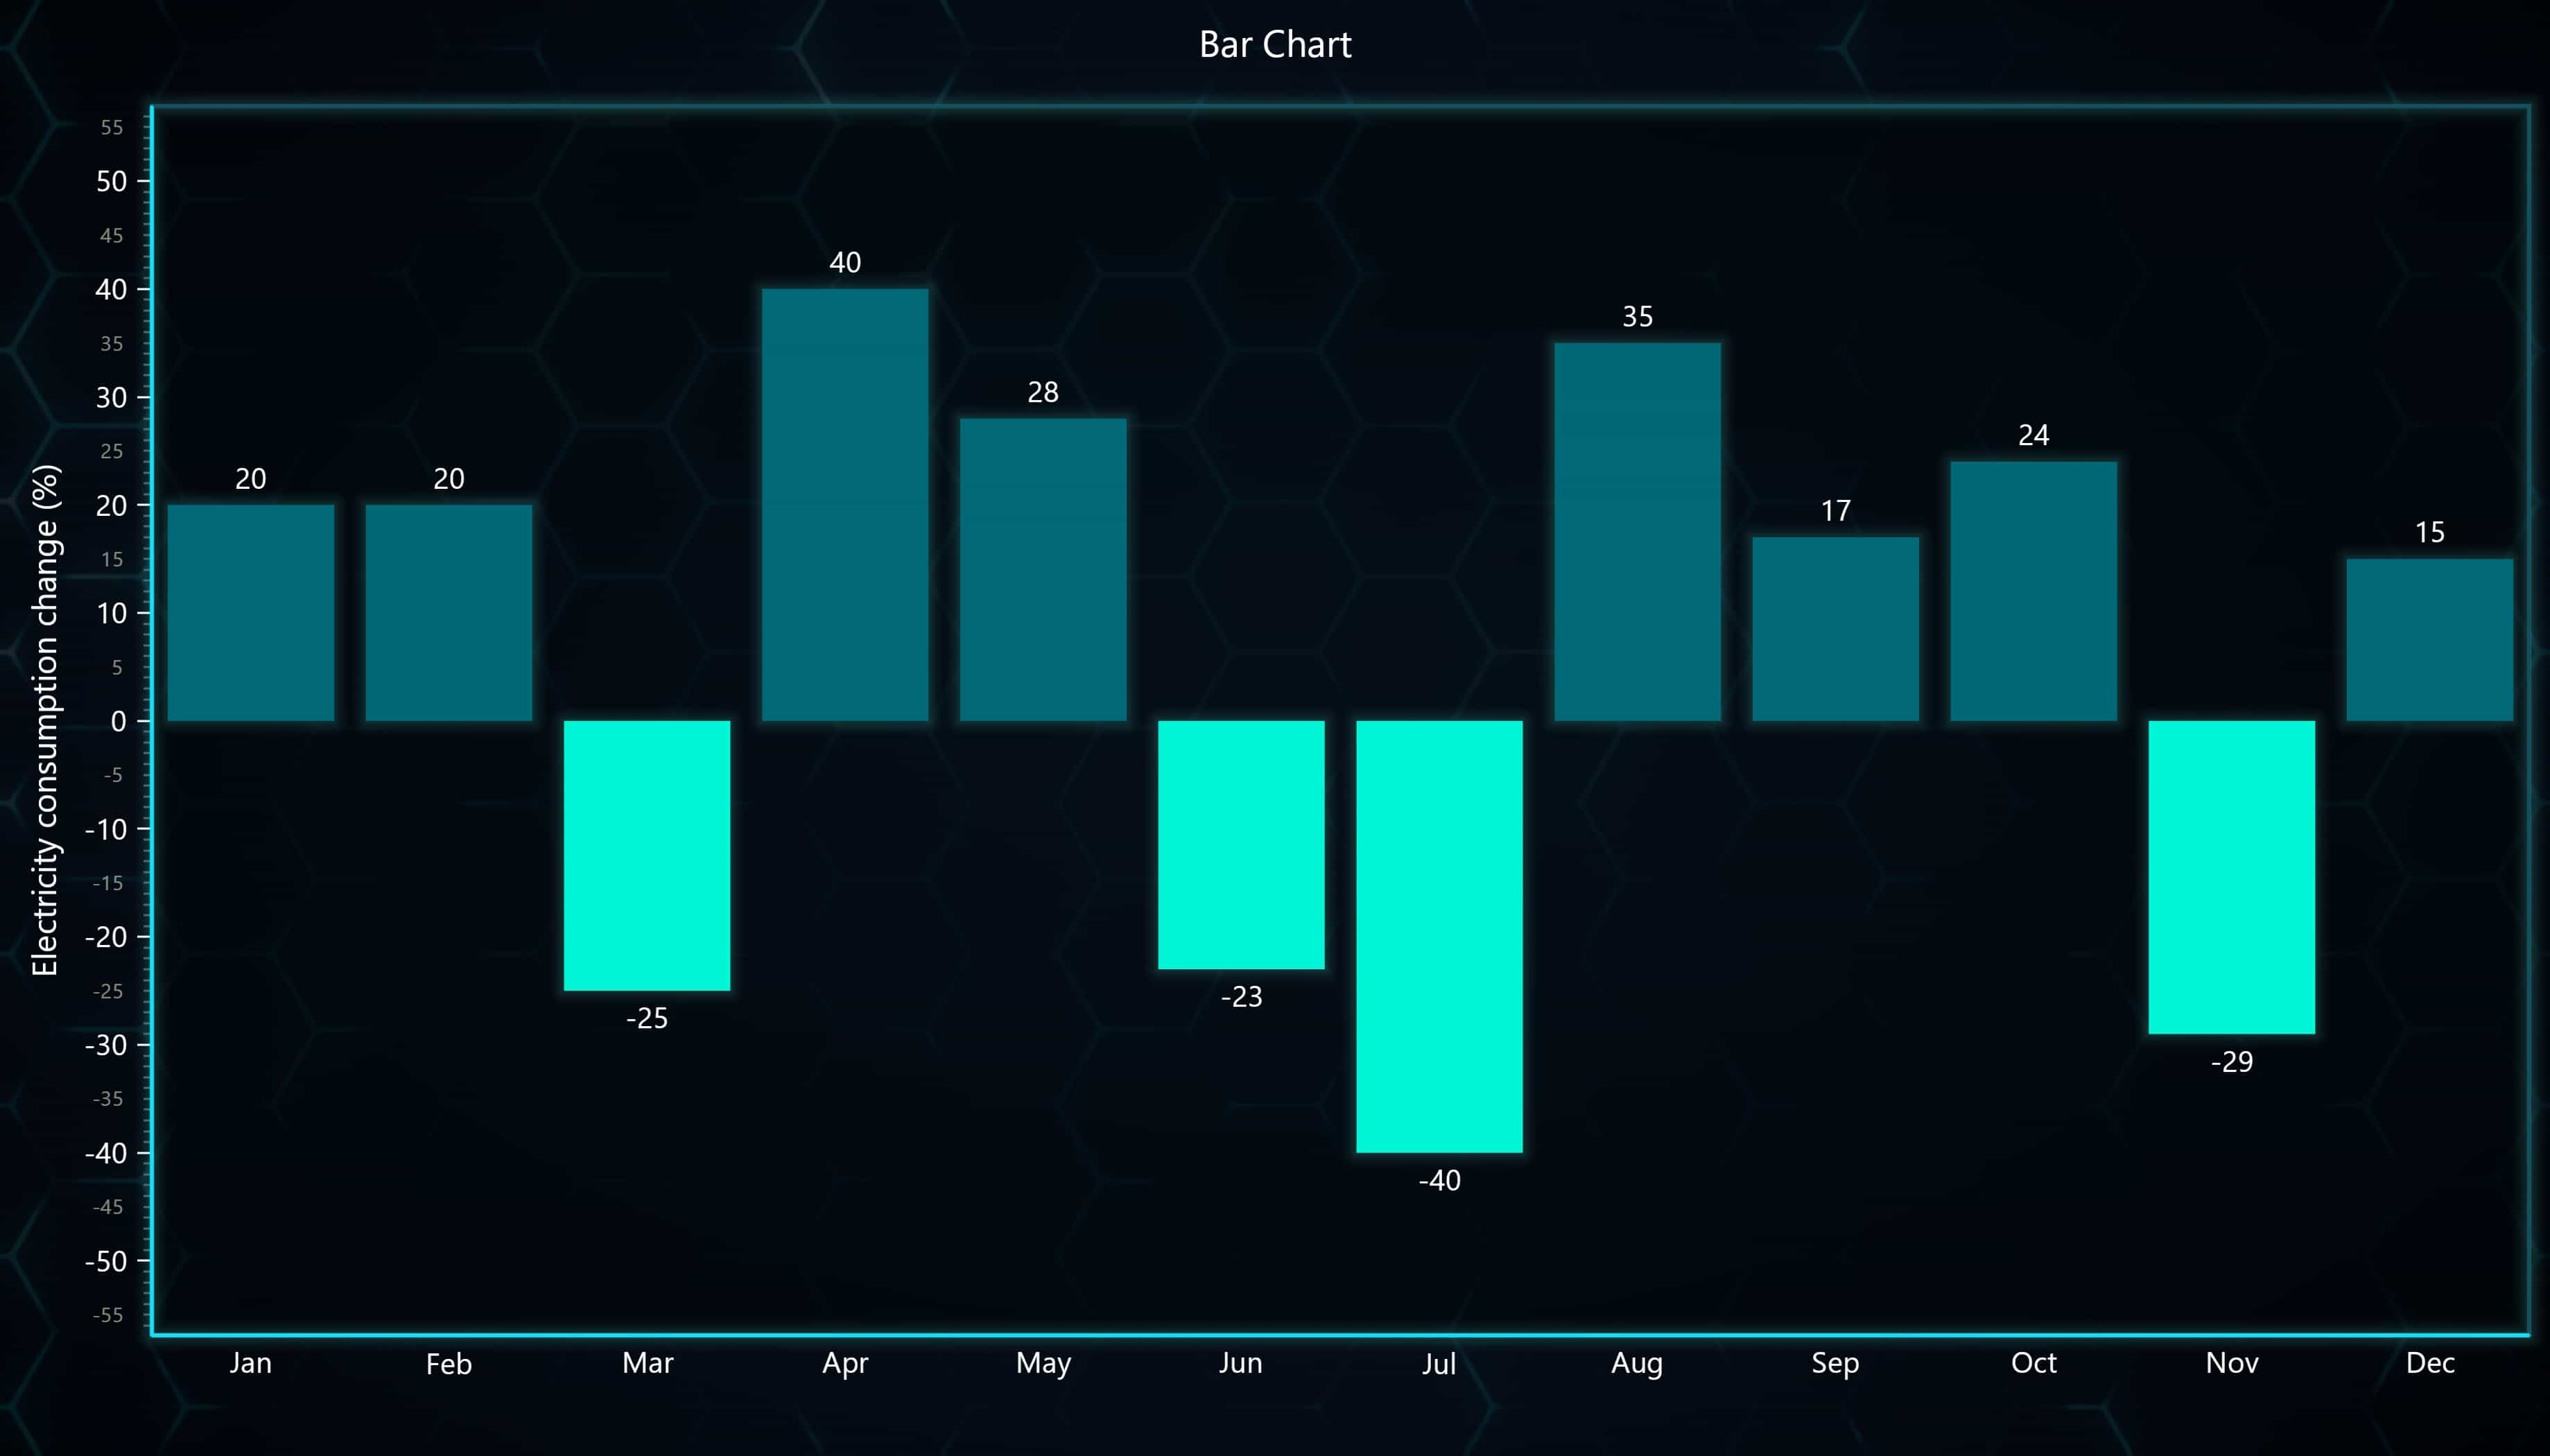
Vertical Bar Chart
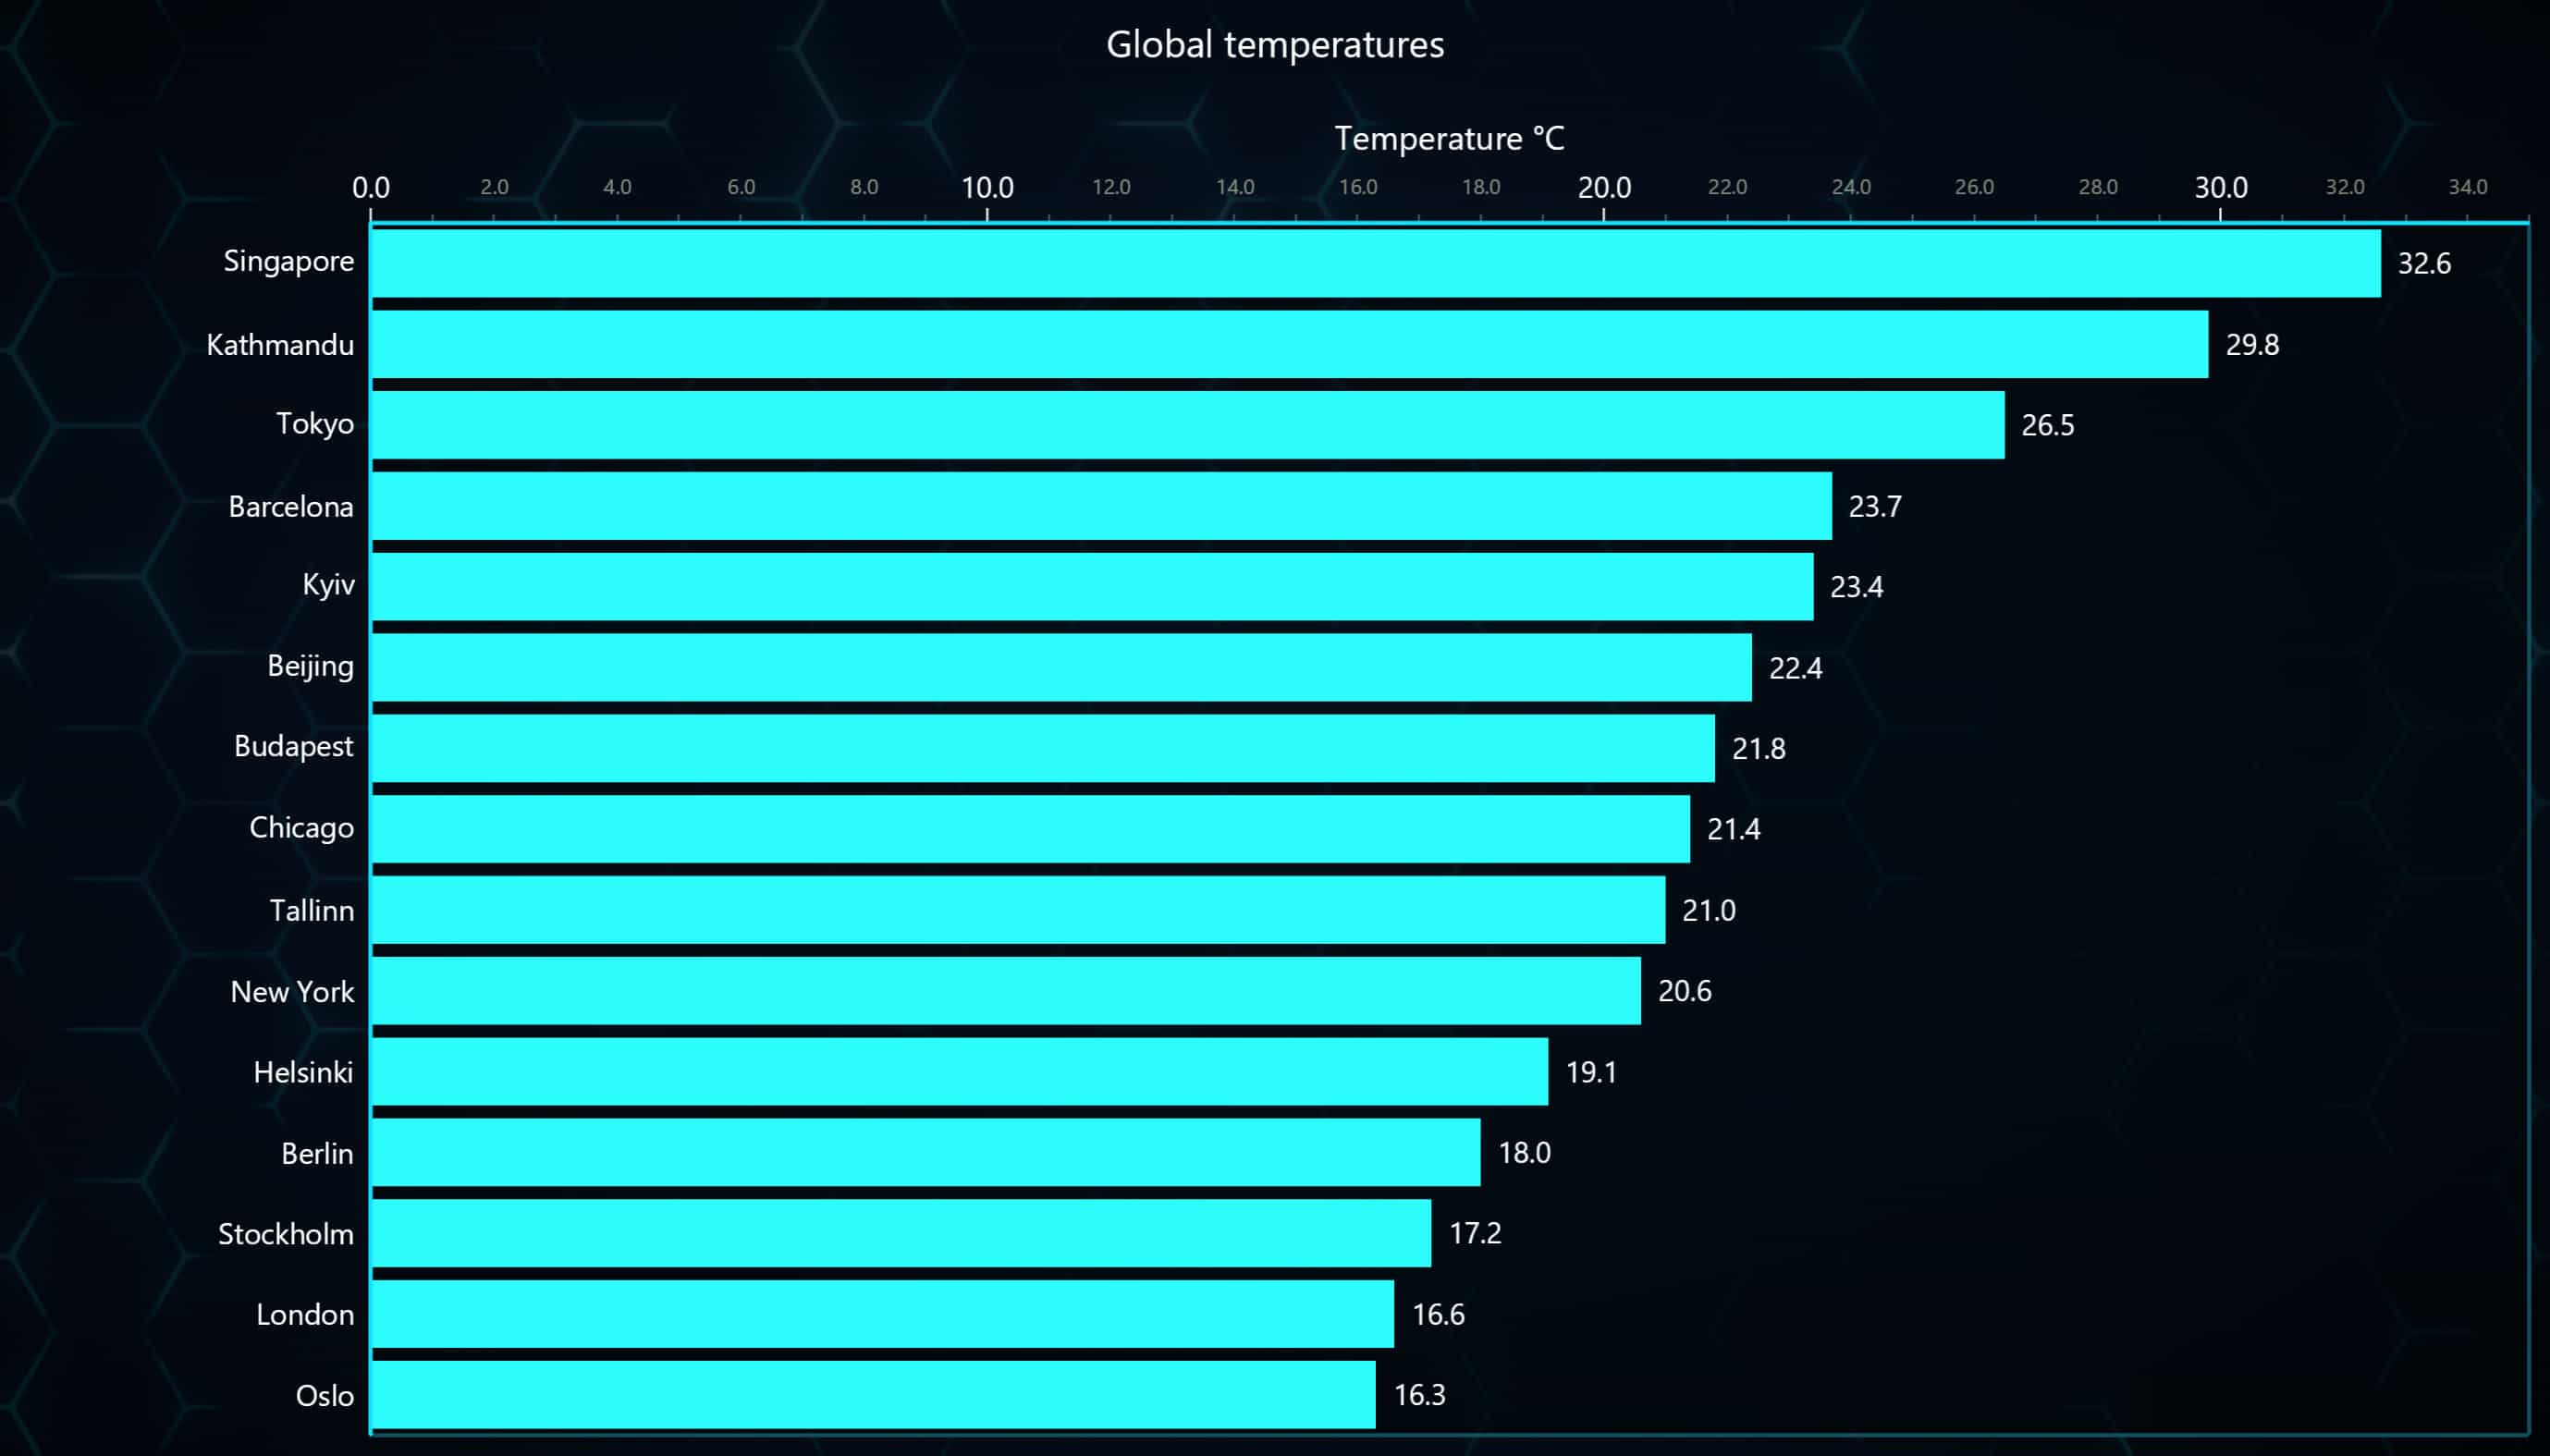
Horizontal Bar Chart of Different Global Temperatures
Coordinate Translations
LightningChart JS v.4.2 introduces coordinate translations: a new API for translating between screen coordinates, even locations, and axis coordinates. This mainly enables a variety of important functions:
- Finds the user’s interactions location along the Axes. For instance, clicking to add a data point.
- Positioning external HTML content at an Axis location. Essentially, this allows you to connect any front-end framework component to LightningChart and its Axes.
const locationAxis = {x: Date.now(), y:0}
const locationClient = chart.translateCoordinate(locationAxis, chart.axes, chart.client)
console.log(locationClient)

//
chart.onSeriesBackgroundMouseClick((_, event) -> {
	const locationAxis = chart.translateCoordinate(event, chart.axes)
	console.log(locationAxis)
})
Developer Documentation
For this release, we decided to focus on improving how users learn LightningChart JS. Starting from v.4.2, you can find all developer-oriented instructions, guides, and tutorials in one place: the LightningChart JS Dev Docs. The documentation contains several resources including:
- A Getting Started guide
- Installation guide
- Dedicated guides on over 40 primary and advanced topics
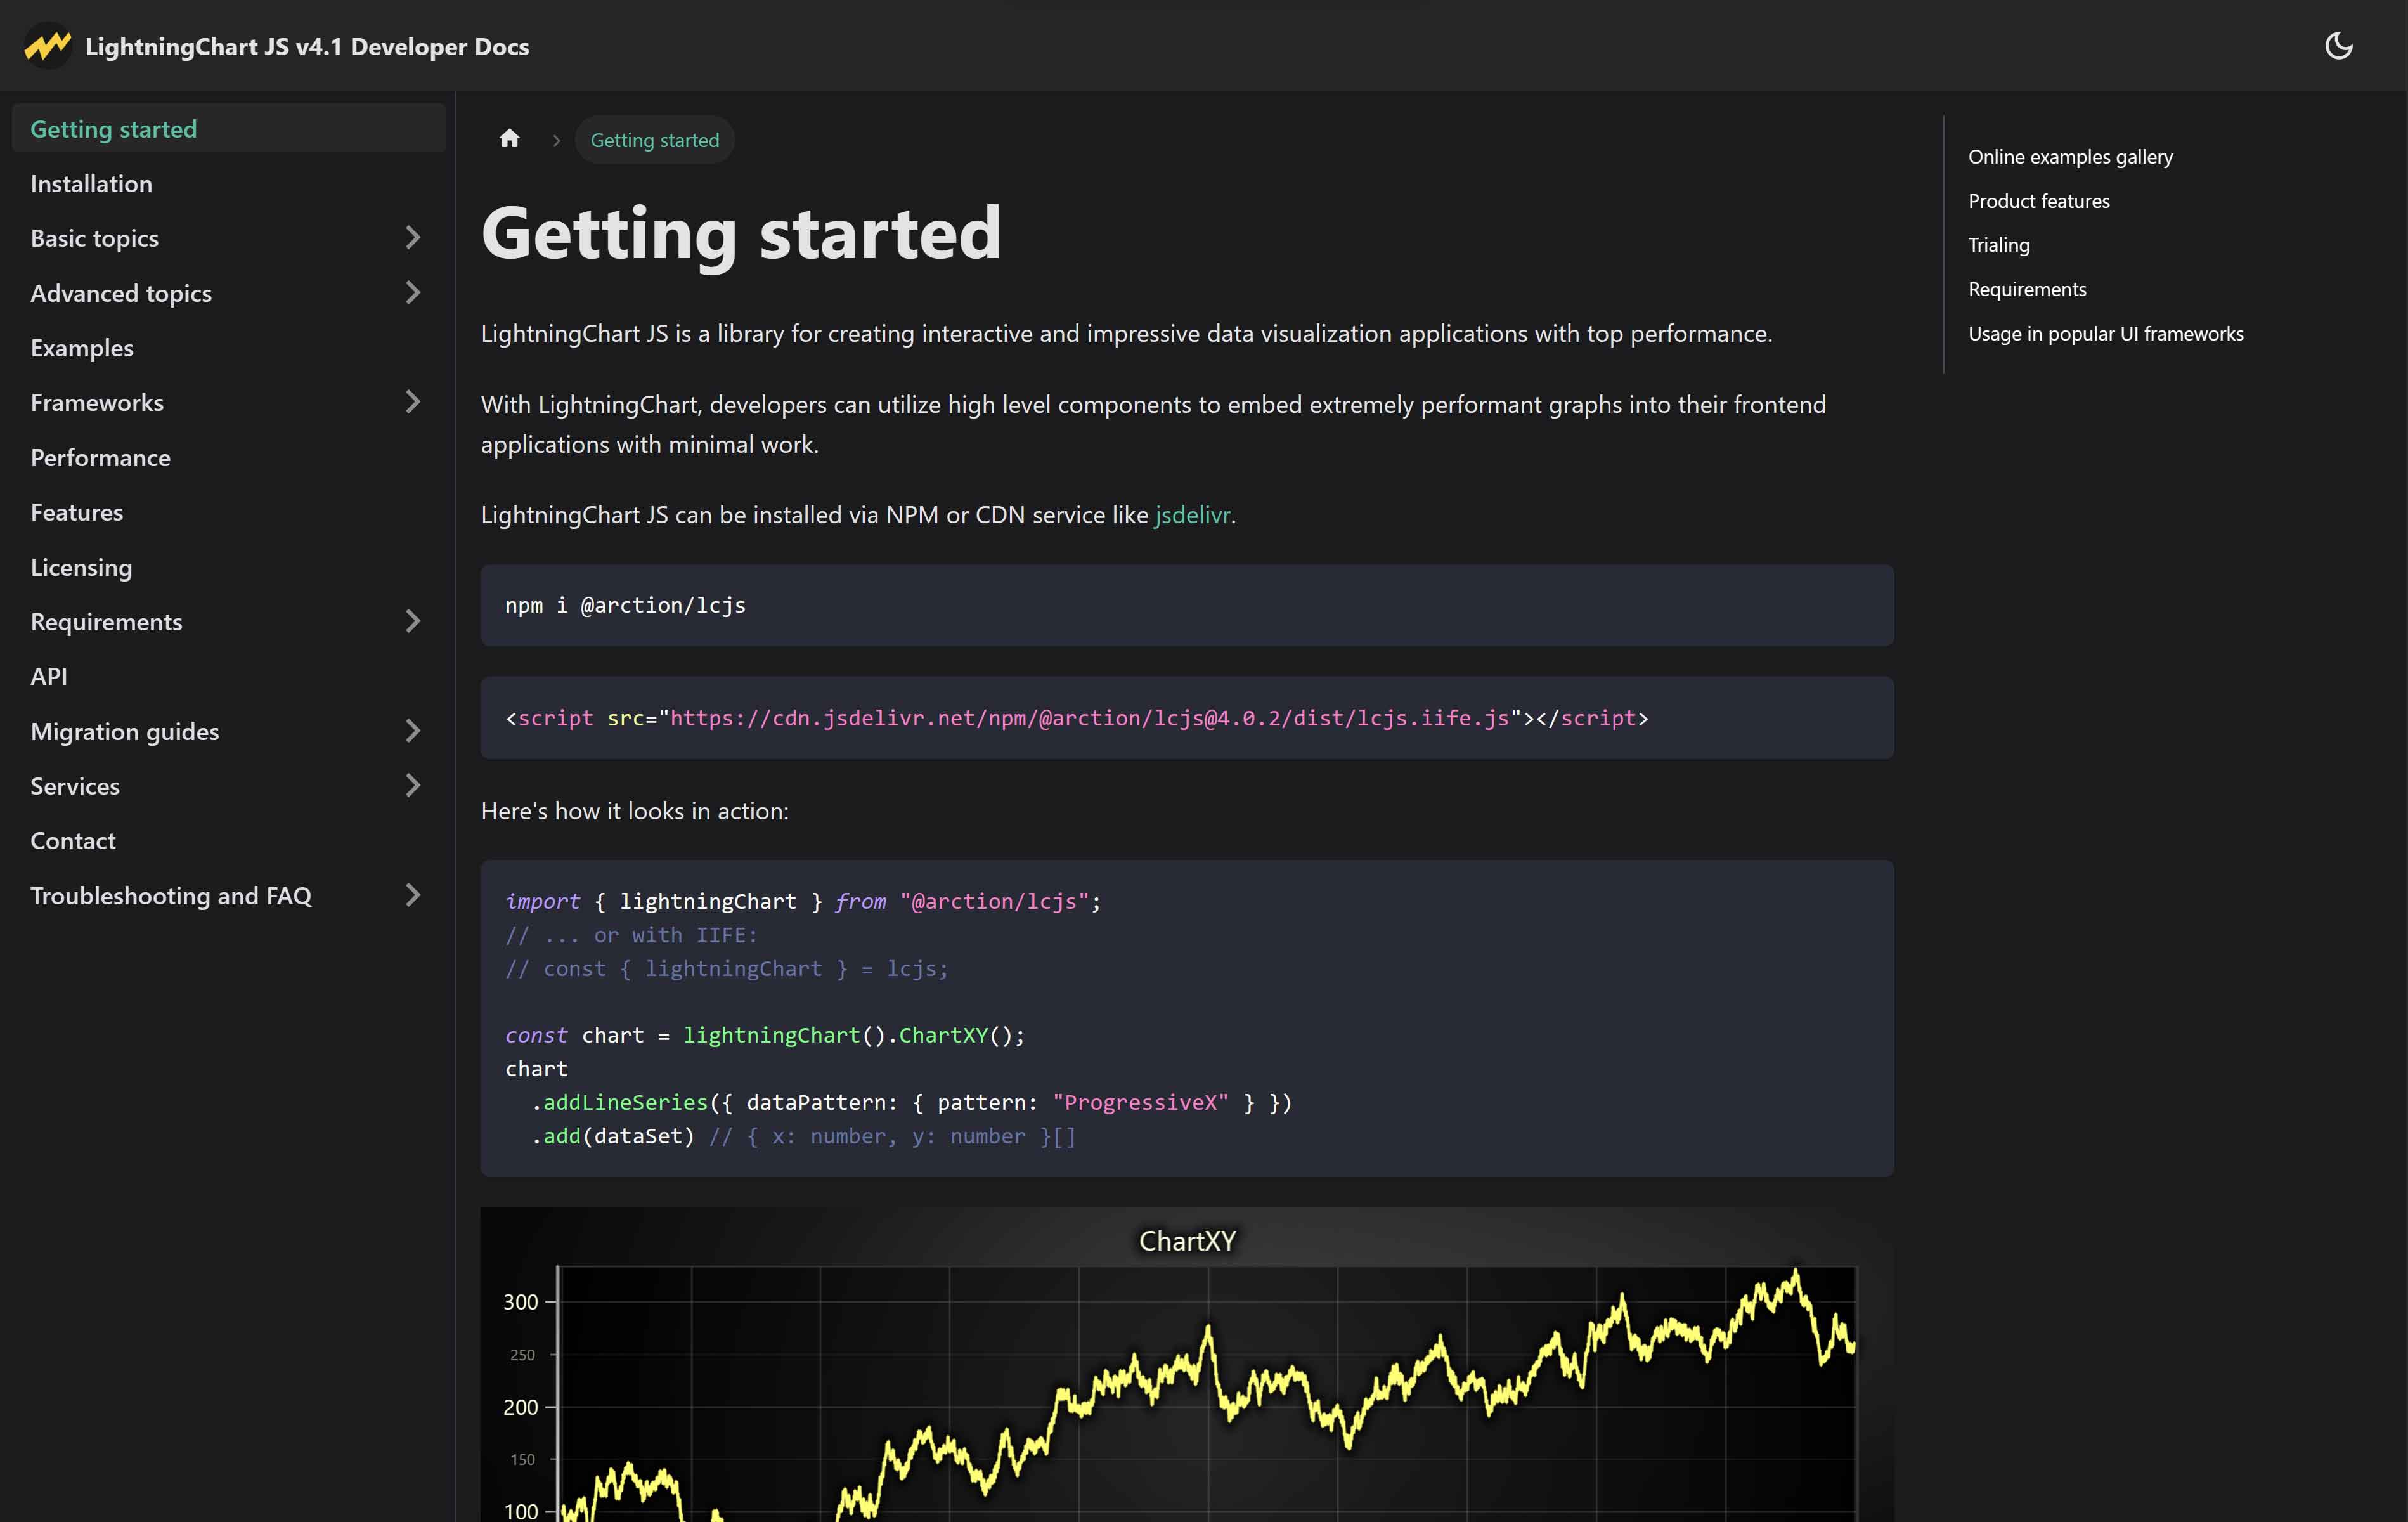
Get started with LightningChart JS v.4.2
If you’re still using a previous version of LightningChart JS, easily migrate to LightningChart JS v.4.2 by checking out the migration guide 4.2.
See more news
Announcement: Baumer as LightningChart customer
Enabling High-Performance Visualization of Industrial Sensor Data with LightningChartDiscover how Baumer uses LightningChart to configure and visualize data from a wide variety of industrial sensors and create responsive, data-rich visualization...
Best Python Charting Library in 2026
Python's charting ecosystem is large, overlapping, and regularly misunderstood. Most comparison guides stop at Matplotlib, Plotly, and Seaborn. This one goes further: it covers what happens when your datasets grow large, your update rates increase, or your chart types...
Best TradingView Charting Library Alternative
TradingView's charting libraries are the most visible option for fintech developers. Visibility is not the same as capability. This guide is for developers who have hit the wall on candle count limits, watermark restrictions, branding requirements, real-time...
Which JavaScript Chart Library Do AI Coding Agents Actually Recommend, and Does It Matter?
In this article Why AI coding agents have strong library preferences What the defaults actually are (and the data behind them) When the defaults work fine When they quietly fail you What to do instead: giving your agent better information The keyword angle nobody is...



If you have any questions, feel free to contact us!



©LightningChart Ltd 2026. All rights reserved.