








LightningChart® JS – The Fastest JavaScript Charts. Period.
LightningChart® has, since the beginning of its journey over 10 years ago, been about exceptionally at high-performance level. And now after the release of version 3.0.0, we can with confidence say that LightningChart JS has also risen to the level where LightningChart controls are used to perform – well above any other JavaScript chart.
In recent Line charts performance comparison test, none of the competitors got even close to LightningChart performance level. LightningChart’s initial rendering time is smallest or amongst the smallest, it runs with very compact memory footprint, with lowest CPU overhead, and fastest response to mouse interactions, reaching higher usable data point rates than any other chart.
We have gathered on one page all the information relevant to performance of LightningChart JS. From there you will find access to performance comparison, performance demo, and performance test results.
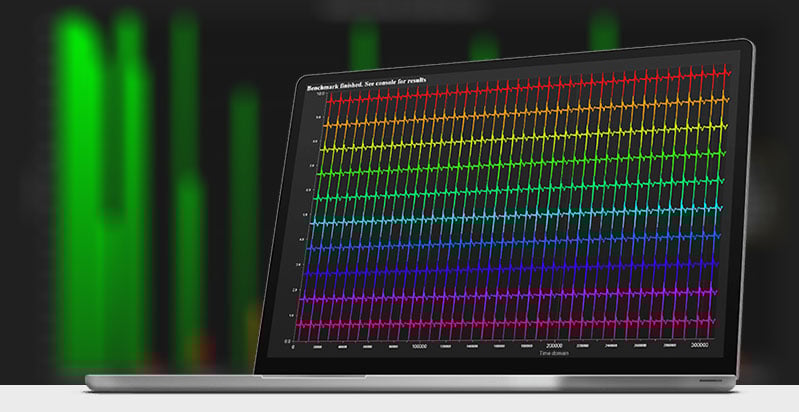
LightningChart’s strength definitely is the exceptional rendering performance, allowing to build very advanced and data-intensive applications. We are very proud of what we have done, broken all the previous performance limits in JavaScript charting.
See more news
LightningChart Wins ComponentSource Top 100 Publisher Award 2026
LightningChart has been awarded a Top 100 Publisher Award in the annual ComponentSource Awards for 2026, the third consecutive year receiving this recognition. The award is based on real global sales data from the world’s leading software component marketplace.
LightningChart .NET v.12.6.1
LightningChart .NET v.12.6.1 is out now!Features of LightningChart® .NET version 12.6.1In this release we added new features, made several improvements and fixed dozens of errors. We upgraded target framework (from .NET 8.0 to 10.0), added Universal-Data-Parser...
Trend Lines in Trading
Trend lines are among the simplest yet most powerful tools in technical analysis. They help traders visualize market direction, identify potential support and resistance levels, and make more informed trading decisions. Despite their simplicity, trend lines remain a...
Announcement: Baumer as LightningChart customer
Enabling High-Performance Visualization of Industrial Sensor Data with LightningChartDiscover how Baumer uses LightningChart to configure and visualize data from a wide variety of industrial sensors and create responsive, data-rich visualization...



If you have any questions, feel free to contact us!