



Performance improvements in LightningChart JS
With the new version of LightningChart JS 2.2. published, we informed you that there are some serious performance improvements done. And we’re really proud to state that especially in 3D charts performance, the difference is huge. These really are High-Performance 3D Charts.
How did we measure it?
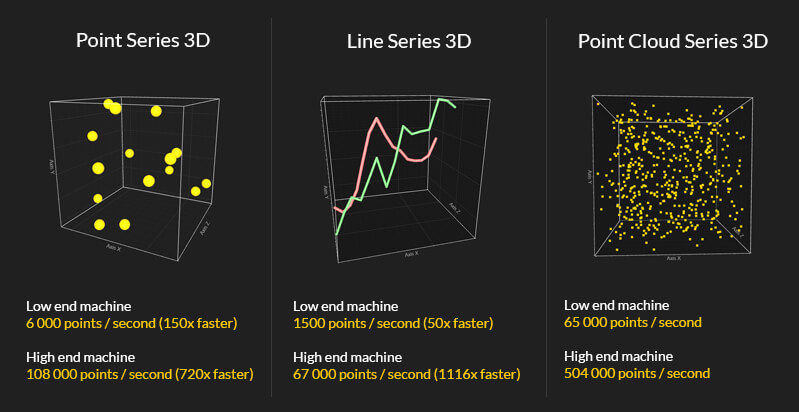
Performance was measured in an application where new data is added to each frame. The amount of data added on each frame is controlled so that the number of frames rendered per second is roughly 60 (FPS = 60). Thus, the performance indicator is “how many data points can be added each second”, the higher the number the better.
End outcome?
LightningChart JS v2.2 significantly upgrades the performance of 3D Point and 3D Line Series (over 1000x faster processing and rendering!), enabling data-visualization applications with massive rates of incoming live data. And what this means for the end-user eventually is, that for example in Point Series 3D, high-end PC can dynamically add new data in 100 kHz frequency to the chart, while keeping a stable frame rate of 60 fps (frames per second) and a smooth user experience for interacting with the chart. These really are high-performance 3D Charts.
Performance demo (with added 3D charts)3D charts real-time performance benchmark (in GitHub)
See more news
LightningChart Wins ComponentSource Top 100 Publisher Award 2026
LightningChart has been awarded a Top 100 Publisher Award in the annual ComponentSource Awards for 2026, the third consecutive year receiving this recognition. The award is based on real global sales data from the world’s leading software component marketplace.
LightningChart .NET v.12.6.1
LightningChart .NET v.12.6.1 is out now!Features of LightningChart® .NET version 12.6.1In this release we added new features, made several improvements and fixed dozens of errors. We upgraded target framework (from .NET 8.0 to 10.0), added Universal-Data-Parser...
Trend Lines in Trading
Trend lines are among the simplest yet most powerful tools in technical analysis. They help traders visualize market direction, identify potential support and resistance levels, and make more informed trading decisions. Despite their simplicity, trend lines remain a...
Announcement: Baumer as LightningChart customer
Enabling High-Performance Visualization of Industrial Sensor Data with LightningChartDiscover how Baumer uses LightningChart to configure and visualize data from a wide variety of industrial sensors and create responsive, data-rich visualization...



If you have any questions, feel free to contact us!





