


LightningChart Python 2.0 is out now!
Introducing customizable legends, enhanced data handling, and improved chart control features.
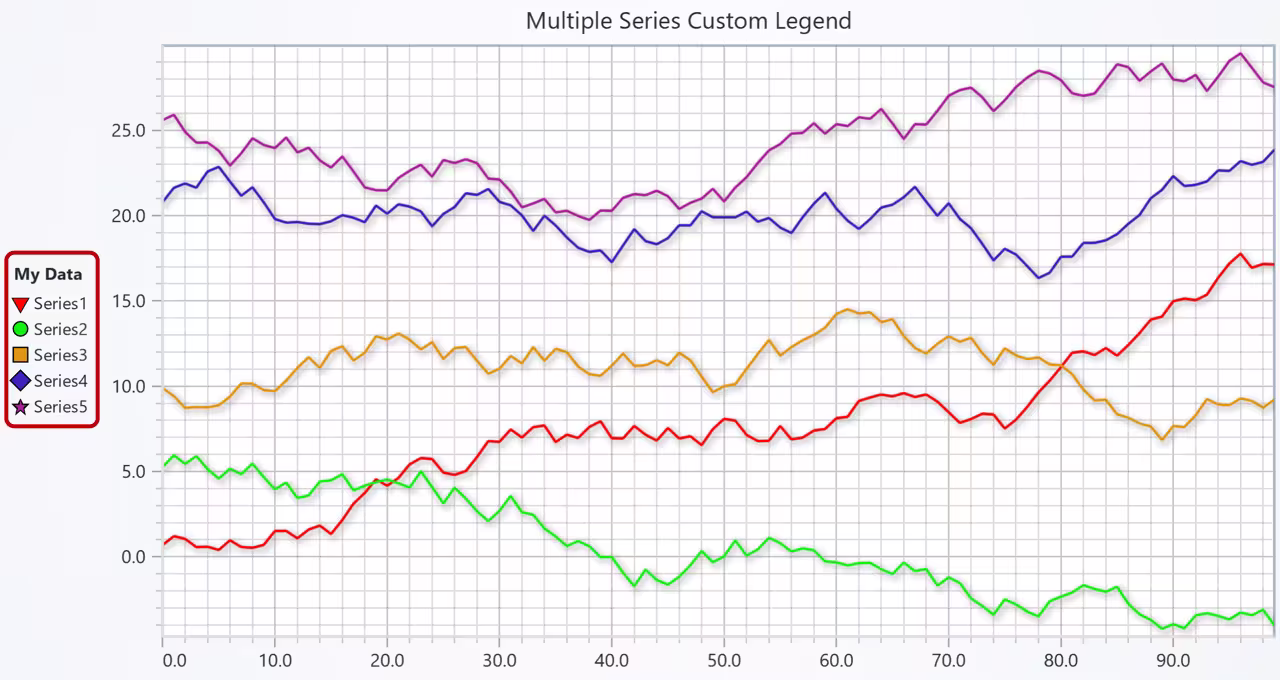
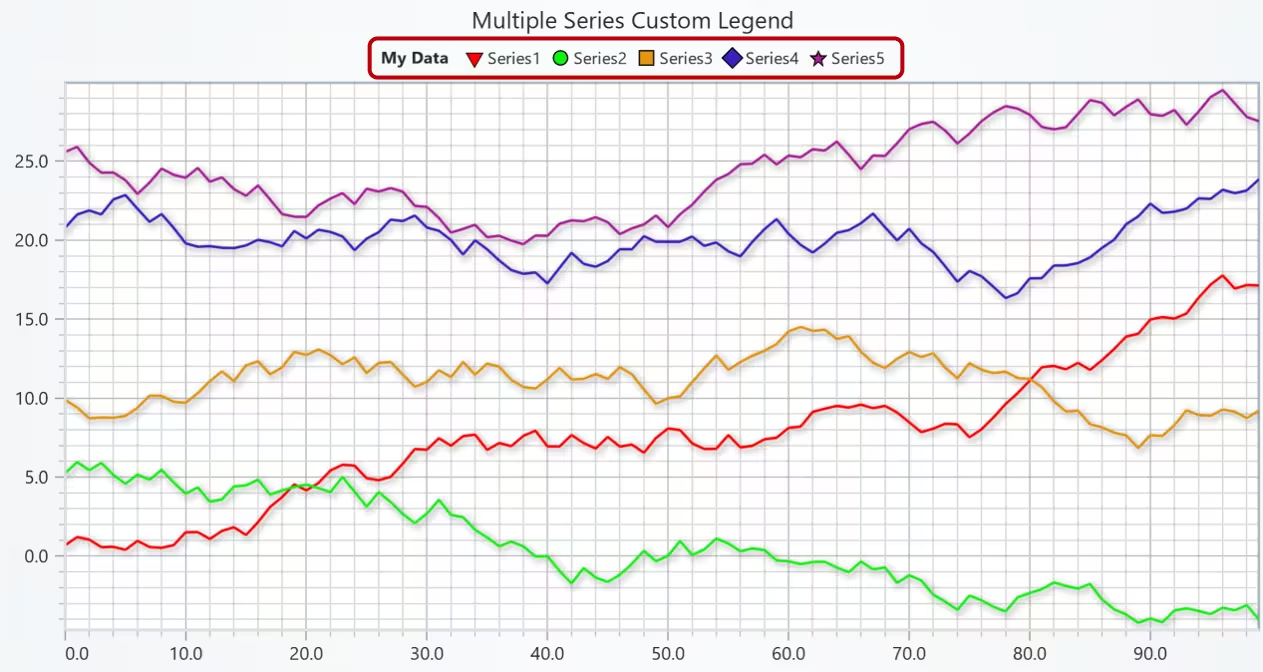
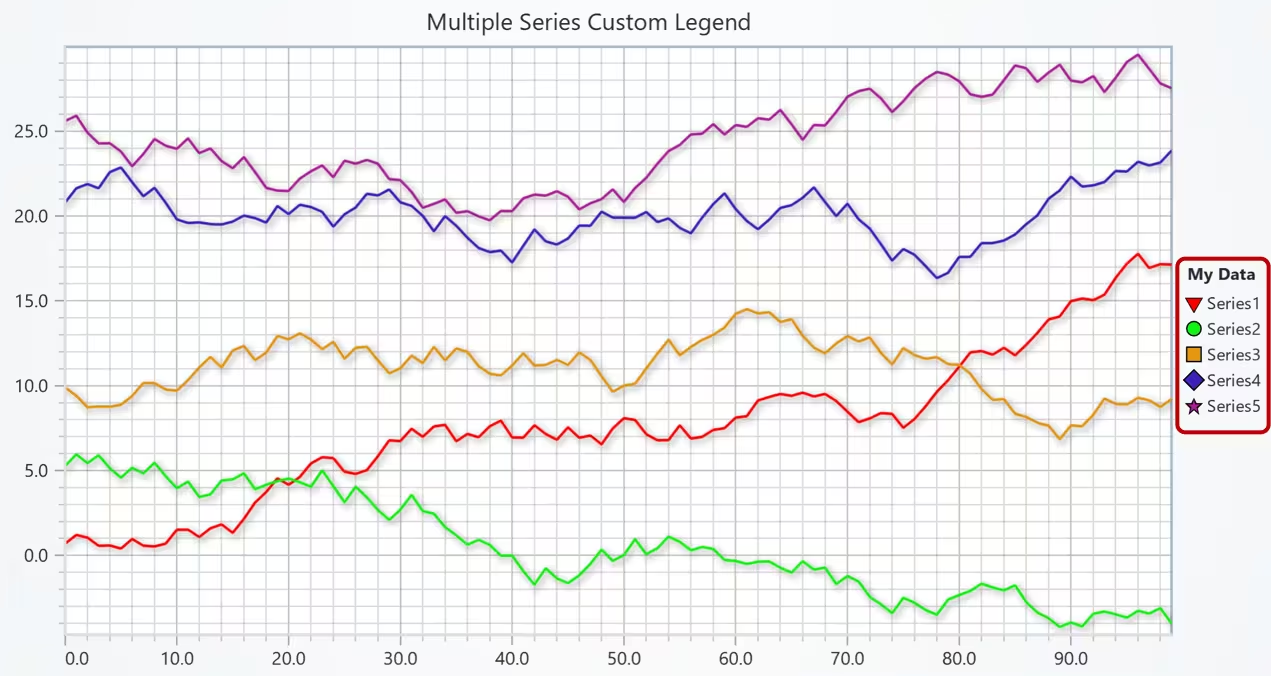
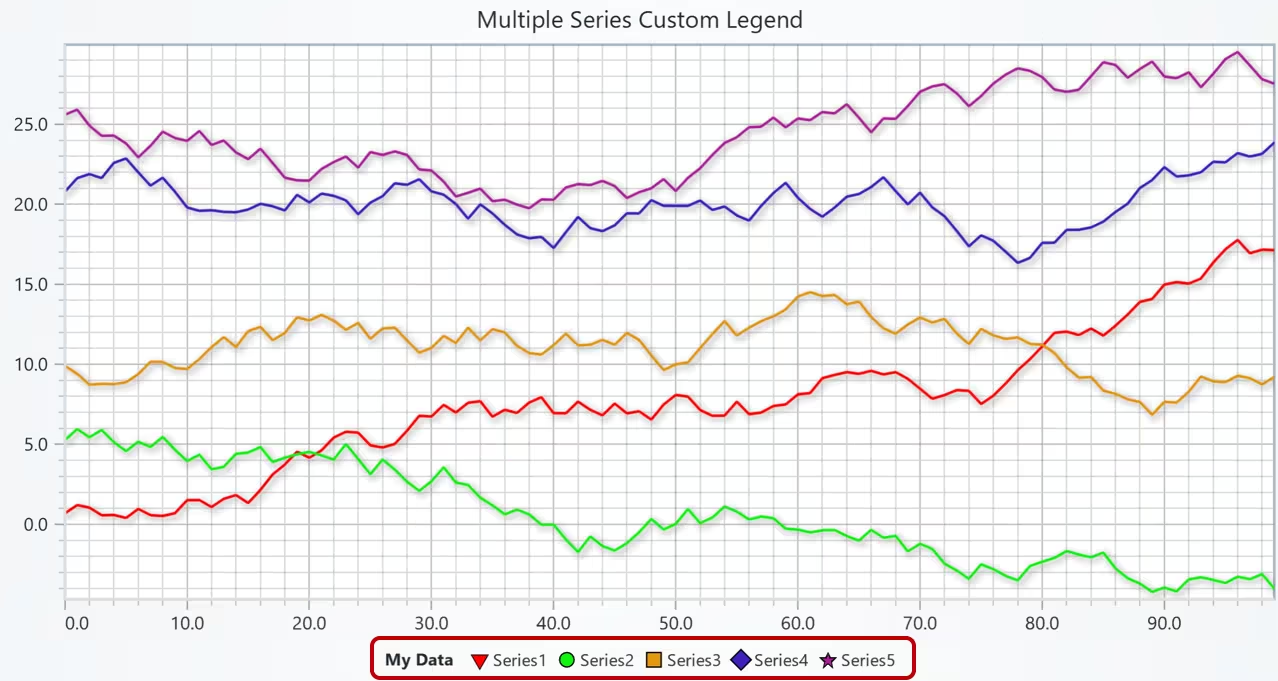
Modifications to Legends
Legends are now added automatically and can be fully customized at the chart, series, and entry levels, which gives you total control over how information is displayed.
Chart-level configuration
Set up default legend behavior right from chart initialization. You can adjust visibility, position, title, orientation, background style, margins, and even automatic entry management.
Series-level styling
Define how each series appears in the legend as you create it. Customize text, button shape and size, fill styles, fonts, and control visibility per series.
Entry-level customization
Use set_entry_options() to style individual components like series or LUTs. Apply custom text, symbols, colors, and LUT display settings to fine-tune the look of each entry.
Multiple legend support
Add multiple legends to the same chart with chart.add_legend(). You can also manually choose which components appear in each one for precise layout control.
Standalone entries
Include additional informational entries not linked to any chart component using the add() method — perfect for notes, labels, or other context indicators.
Available legend positions
ChartXY Series Data API Improvements
The ChartXY Series Data API has been enhanced to offer more flexibility, precision, and efficiency in how data is added, managed, and updated.
Updated data addition methods
The following methods have been improved for better usability and performance:add(), add_dict_data(), append_JSON(), append_sample(), and append_samples().
Schema-based data management
Define your data structure with the schema parameter during series creation, and use set_data_mapping() to specify how data properties map to chart coordinates. This enables organized data handling and makes it easier to implement progressive data patterns.
Enhanced sample modification
Use alter_samples() to modify data points directly by index, or alter_samples_by_match() to target and update specific points. These methods allow precise edits without needing to replace the entire dataset.
Progressive data patterns
Progressive data patterns can now be applied directly in the schema, supporting real-time and continuous data streaming scenarios.
Property-specific data storage
Optimize memory and performance by configuring storage types per data property. For example:
xValues: {'storage': 'Float32Array'},
yValues: {'storage': 'Float32Array'}
Other Improvements
LightningChart Python 2.0 introduces new developer-focused features: unified scroll strategy API, customizable point borders, automatic TextBox cleanup, refined series management, and broader non-native data type support for optimized performance.
Simplified scroll strategies
A single set_scroll_strategy() method now handles all scroll behaviors. Choose from ‘scrolling’, ‘fitting’, ‘expansion’, or ‘fittingStepped’, and easily fine-tune with parameters like progressive=True, realtime=True, start=False, or end=True.
Customizable point series borders
You can now customize point borders in ChartXY (Point, Point-Line, Spline, Step) and Polar (Point, Point-Line) series using the new set_point_stroke_style() method for better visual control.
TextBox auto-dispose
TextBoxes can now automatically remove themselves when they exceed a specified portion of the viewport. Configure this with set_auto_dispose(mode, threshold) for cleaner, dynamic visuals.
Removed series types
Some previous AreaSeries functionalities have been removed under ChartXY — specifically, the Bipolar, Negative, and Positive series types.
Expanded data type support
The update adds compatibility for a wider range of non-native Python data types, improving flexibility and integration with external data sources.
Get LightningChart Python 2.0
Ready to start with LightningChart Python data visualization library? Select from Data Scientist or Software Developer licenses, and get started developing Python projects at the best performance.
See more news
The Head and Shoulders Pattern in Technical Analysis
The Head and Shoulders Pattern in Technical Analysis The Head and Shoulders Pattern in Technical Analysis The Head and Shoulders pattern is one of the most recognized and widely used chart patterns in technical analysis. It is considered a reliable reversal pattern...
Best Telerik Charts Alternative in 2026: GPU Performance for WPF, WinForms, and Web
Telerik from Progress is a comprehensive UI component suite covering WPF, WinForms, ASP.NET, Blazor, and JavaScript. The charting components: RadChartView for WPF and WinForms, and Kendo UI Charts for web and Blazor, arrive bundled with the suite purchase. For teams...
Streaming Data Visualization with WebSockets (2026): The Complete Tutorial
Every WebSocket tutorial on the internet shows the same thing: a server sends a random number every second, a chart updates. It works. The demo looks great. Then you deploy to production, your IoT sensors push 800 updates per second across twelve channels, and the...
Best ScottPlot Alternative in 2026: GPU Rendering, 3D Charts, Cross-Language Support
ScottPlot is genuinely excellent for what it is: a free, MIT-licensed, actively developed .NET plotting library with an honest focus on interactive large-dataset display. The GDI+ rasterized renderer — which draws the entire chart as a pixel bitmap rather than...


If you have any questions, feel free to contact us!
©LightningChart Ltd 2026. All rights reserved.