


Announcing LightningChart JS v.8.1
New product features, performance, and developer experience improvements.
New Product Features
LightningChart JS v.8.1 introduces new product features. Here’s an overview:
Heatmap min-max aggregation
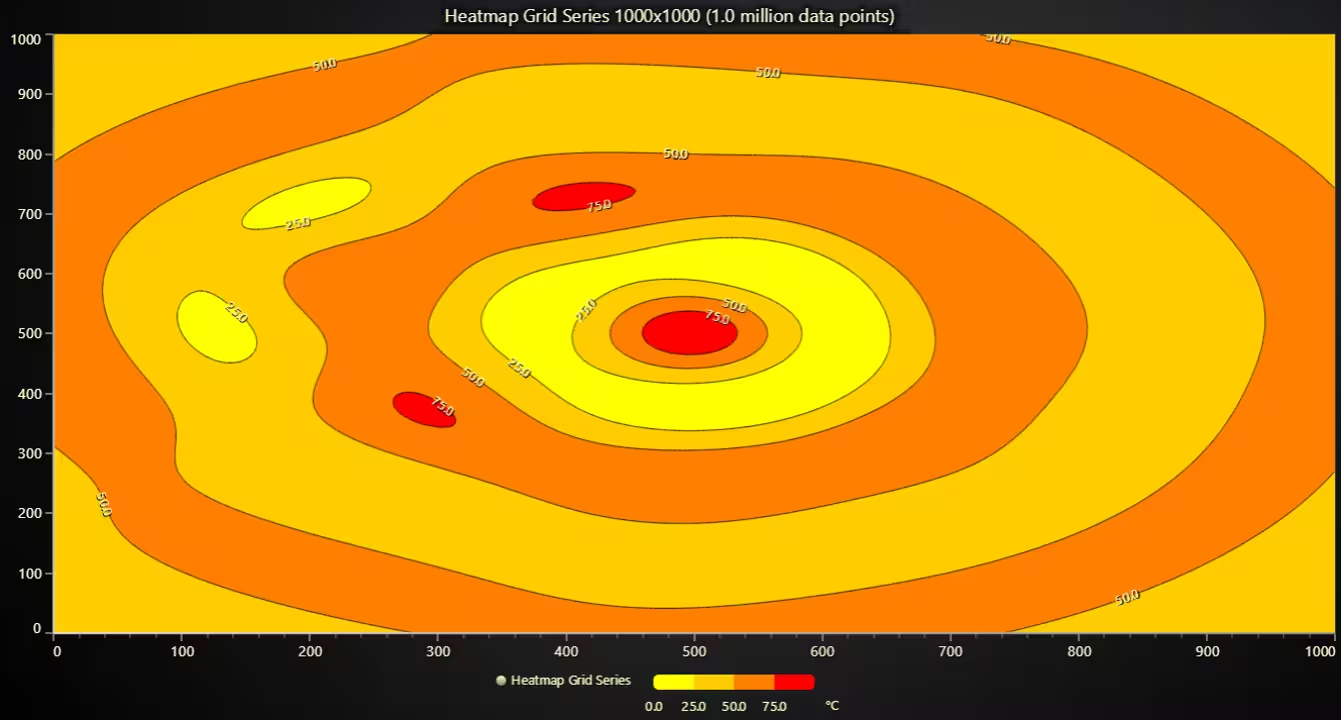
In this 8.1 release, LightningChart JS introduces built-in heatmap aggregation features, useful for extremely dense heatmaps where several data points might correspond to only 1 pixel on the monitor. By enabling the min-max aggregation, you can ensure that your application users always see the peak values, regardless if they are zoomed out or not.
The aggregation can be set with heatmapSeries.setAggregation(‘max’). In the following video, you can see small red dots in the middle, which are outliers added for testing. See how they are not visible in the raw upper heatmap.
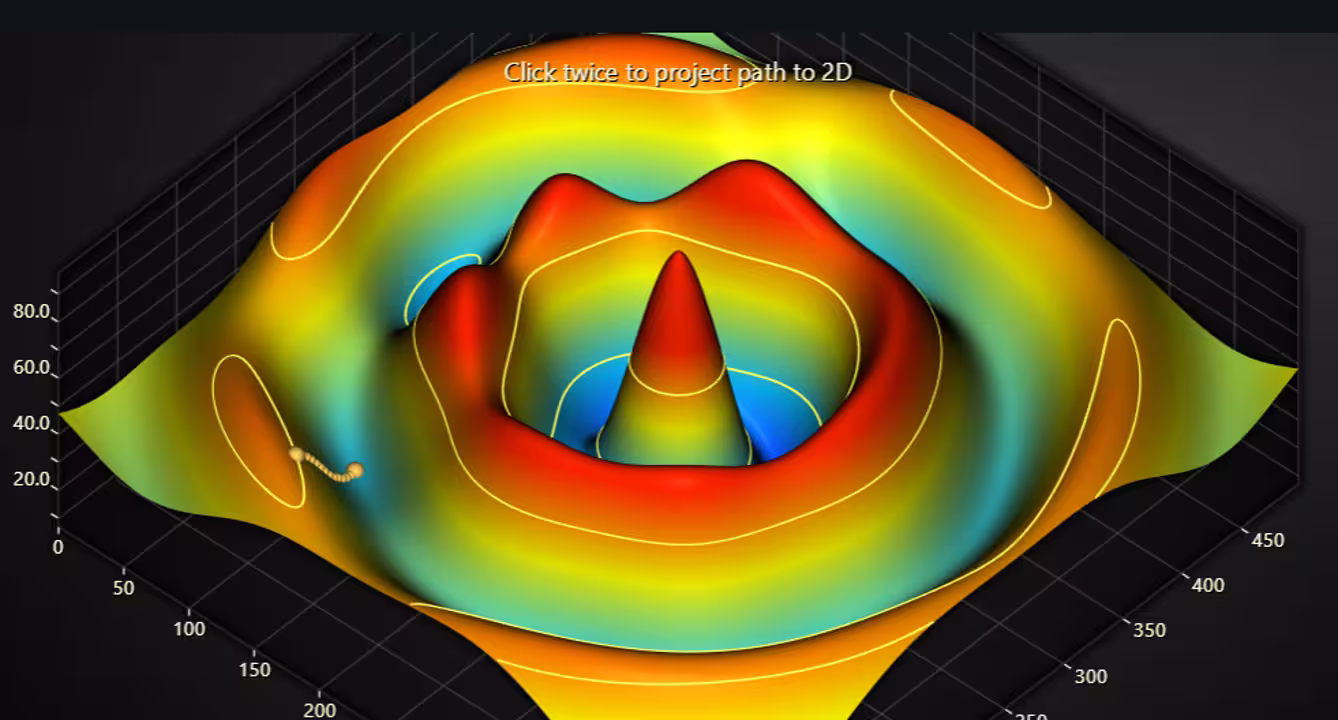
Heatmap and Surface contours
LightningChart JS 8.1 also introduces built-in contour rendering algorithms for the heatmap and surface series, supporting different stroke and label styles for each level.
Contour options can be set as follows:
Heatmap.setContours({
	levels: [
		{ value: 10 },
		{ value: 30 }
	]
})
LineSeries3D lookup value coloring
3D line series now support loading separate value properties (not X, Y, or Z) and coloring each line segment with alternating color based on that value.

Inset custom ticks in ChartXY
LightningChart 8.1 introduces an API to align custom tick labels on the interior area of the series. Previously, this was already possible for normal ticks, but not for custom ticks. Custom ticks are mostly used for categorical axis.

Cursor style overrides for built-in user interactions

The user interaction configuration API now allows specifying a cursor style between different built-in user interactions. Similarly, styling the cursor can also be disabled by passing a `null` value:
chart.setUserInteractions({
  pan: {
    cursor: 'grabbing',
  },
})
Performance Improvements
This version introduces enhancements for performance, here is a summary:
Rectangle series progressive solve nearest
The rectangle series can now automatically change the cursor behavior to a progressive variant, the same way as other XY series. This is a good improvement when using histograms, especially if the same chart includes either several histograms or a histogram and another XY series. This is an out-of-the-box improvement, and an API call is not necessary.

Heatmap flat array input
XY Heatmap grid series now supports data in flat format. Previously, data had to be provided as a number matrix (array of arrays). In many real-world applications, data is loaded or transferred in a flat format. Before, this required converting flat data into a matrix, which was a fast process but added extra loading time and could be memory-intensive for large heatmaps.
The new API also supports loading data from Typed Arrays (e.g., Float32Array, Float64Array), enabling highly efficient data loading, especially when using web workers for async FFT calculations or similar use cases.
Developer Experience Improvements
LightningChart JS 8.1 introduces key chart capturing methods:
Scale parameter to captureFrame/saveToFile methods
The scale parameter allows capturing a screenshot of the chart while simultaneously upscaling or downscaling it by an arbitrary ratio. For instance, this is the code for a 2x upscaled screenshot:
chart.saveToFile('screenshot', undefined, undefined, 2)Get started with LightningChart JS v.8.1
To learn more about this release, visit the documentation.
See more news
The Head and Shoulders Pattern in Technical Analysis
The Head and Shoulders Pattern in Technical Analysis The Head and Shoulders Pattern in Technical Analysis The Head and Shoulders pattern is one of the most recognized and widely used chart patterns in technical analysis. It is considered a reliable reversal pattern...
Best Telerik Charts Alternative in 2026: GPU Performance for WPF, WinForms, and Web
Telerik from Progress is a comprehensive UI component suite covering WPF, WinForms, ASP.NET, Blazor, and JavaScript. The charting components: RadChartView for WPF and WinForms, and Kendo UI Charts for web and Blazor, arrive bundled with the suite purchase. For teams...
Streaming Data Visualization with WebSockets (2026): The Complete Tutorial
Every WebSocket tutorial on the internet shows the same thing: a server sends a random number every second, a chart updates. It works. The demo looks great. Then you deploy to production, your IoT sensors push 800 updates per second across twelve channels, and the...
Best ScottPlot Alternative in 2026: GPU Rendering, 3D Charts, Cross-Language Support
ScottPlot is genuinely excellent for what it is: a free, MIT-licensed, actively developed .NET plotting library with an honest focus on interactive large-dataset display. The GDI+ rasterized renderer — which draws the entire chart as a pixel bitmap rather than...


If you have any questions, feel free to contact us!
©LightningChart Ltd 2026. All rights reserved.