IntroductionWelcome to another new article about LightningChart and Node.js. In this article, we will talk about the...


Regional Account & Marketing Executive (China, Japan and South Korea)
+358 503 543 706
Book a meeting
Regional Account Manager (North America, South America)
+358 505 528 995
Book a meetingOur dedicated sales team is ready to help you find the perfect solution for your data visualization needs. Don't hesitate to reach out for personalized assistance or to schedule a demo of our products.

Regional Account & Marketing Executive (China, Japan and South Korea)
+358 503 543 706
Book a meetingRegional Account Manager (North America, South America)
+358 505 528 995
Book a meetingOur dedicated sales team is ready to help you find the perfect solution for your data visualization needs. Don't hesitate to reach out for personalized assistance or to schedule a demo of our products.
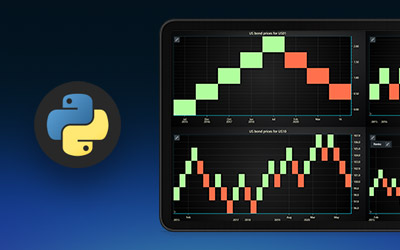
IntroductionWelcome to another new article about LightningChart and Node.js. In this article, we will talk about the...
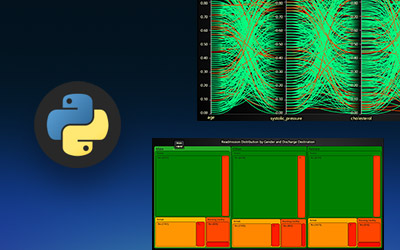
IntroductionThis project presents a comprehensive hospital readmission prediction analysis of risk factors using the...
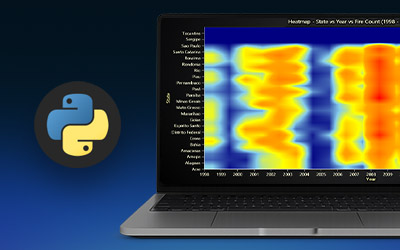
IntroductionThis project presents a comprehensive forest fire analysis using the Forest Fires in Brazil (1998–2017)...
What is the Center of Gravity Indicator?The Center of Gravity Indicator (COG) is a predictive, lag-free oscillator...

Introduction to Balance of Power (BOP) IndicatorThe Balance of Power (BOP) indicator is a technical tool widely used...
IntroductionThe Awesome Oscillator is a popular technical analysis tool widely used by traders to assess market...
IntroductionThe Aroon Price Oscillator is a powerful technical analysis tool that offers insight into the strength of...
IntroductionThe Williams Variable Accumulation Distribution (WVAD) is a technical indicator designed to analyze buying...

Introduction to Williams Accumulation Distribution IndicatorThe Williams Accumulation Distribution Indicator (WAD) is...
Introduction to Volume Rate of ChangeVolume plays a crucial role in understanding market trends. It reflects the...
Introduction to Volume Oscillator (VO) IndicatorThe Volume Oscillator (VO) is a technical analysis tool designed to...
Introduction to Twiggs Money FlowThe Twiggs Money Flow (TMF) is a technical analysis indicator that builds upon the...