



Chart Performance Explained: FPS, Rendering Time and Data Capacity
Three numbers get quoted when charting libraries talk about performance: frames per second, rendering time, and maximum data capacity. They measure different things, and a library can look strong on one while being unusable on another. This page explains what each one actually tells you, and what to ask when a vendor quotes one and leaves out the rest.
It matters because there is no standard for how charting vendors report performance. Some publish frame rates. Some publish point counts. Many publish neither and say “handles millions of points”, which is not a measurement and cannot be checked. Comparing two libraries usually means comparing two claims that were never produced the same way, on hardware neither vendor named.
If you want the comparison rather than the explanation, our LightningChart JS performance comparison tests 23 charting libraries across five chart types with the test code published on GitHub. If you want to know how to read a result like that, keep going.
The terms vendors use, and what each one measures
Most confusion comes from vendors measuring different things and calling all of it “performance”. These are the terms you will meet, and what each one does and does not tell you.
| Term | What it measures | What it leaves out |
|---|---|---|
| Frames per second | How many times a second the chart redraws, which is what makes zoom, pan and live updates feel smooth | How long the first draw took, and how much data was on screen while that frame rate held |
| Rendering time | How long one draw takes for a stated quantity of data | Whether that holds up once new data is arriving continuously |
| Maximum data capacity | The largest dataset the chart will accept before it fails | Whether the chart is still usable at that size, or merely still running |
| Streaming performance | How much new data per second the chart can absorb while staying responsive | Anything about the initial load, which is often the slower half |
| GPU or WebGL rendering | Where the drawing happens, not how fast it is | The actual result. GPU rendering implemented badly can be slower than CPU rendering implemented well |
| “Millions of points” | Nothing. It is a range, not a measurement | How many millions, how long it took, and on what hardware |
Three questions make almost any performance claim checkable. How much data. How long it took. On what hardware. A claim missing any one of the three cannot be compared against another vendor’s claim, because you have no idea whether the two were produced under the same conditions.

Frames per second, and what it actually tells you
Frames per second is how many times the chart redraws in one second. A static image needs one frame. A chart that is being panned, zoomed, or fed live data needs a new frame every time something moves, and the frame rate is what decides whether that movement looks continuous or stutters.
Most displays refresh 60 times a second, so 60 FPS is where motion stops looking like motion and starts looking like reality. Below roughly 30 FPS, dragging a chart feels like it is lagging behind the cursor. Figures above 60 are not visible on a standard screen, but they are still worth knowing, because they tell you how much headroom there is before the frame rate starts to fall as you add data.
What FPS tells you that other numbers do not
FPS is the only one of the common metrics that describes the chart while a person is using it. Rendering time tells you about one draw. Maximum capacity tells you where the chart breaks. Frame rate tells you whether the chart stays responsive to a mouse, a touch gesture or an incoming data stream while it is holding that load, which is the thing an operator actually experiences.
That is why a frame rate quoted without a data volume is close to meaningless. 60 FPS on a thousand points says nothing. 60 FPS on a million points, while new points are still arriving, is a real claim.
What we publish, and what is still missing from it
Our own figures for LightningChart JS, each at one million data points:
| Chart type | Frames per second |
|---|---|
| Scrolling line series | 60 FPS |
| Scrolling area series | 57 FPS |
| OHLC candlesticks | 57 FPS |
Two of the three questions from earlier are answered there: how much data, and the result. The third is not. These were recorded on what we described at the time as a typical development desktop, which is the same vagueness this article is arguing against, so we are fixing it rather than defending it. Current figures with full hardware specification are in the LightningChart JS performance comparison, tested against 23 other libraries with the test code published.
Rendering time, and why loading and redrawing are different
Rendering time is how long the chart takes between receiving data and showing it on screen. Two very different things get called by that name, and conflating them is how a vendor can quote a fast number for a slow product.
The first draw is the expensive one. The data has to be parsed, moved into the renderer, and turned into geometry before anything appears. This is what a user experiences as the page loading, and on large datasets it is where the wait happens.
Every frame after that is far cheaper, because the data is already in place and the chart is only redrawing what changed. This is the number that becomes a frame rate.
A library that loads ten million points in eight seconds and then runs at 60 FPS is a different product from one that loads the same data in a fraction of a second, even though both can advertise 60 FPS. If a vendor quotes a frame rate and no load time, the load time is usually the reason.
The question most comparisons miss
Not how fast the library is at one data size, but how the time changes as the data grows. A library that takes one second for a million points and four seconds for two million is not scaling linearly, and whatever is causing that will become unusable well before you reach ten million. The only way to see it is to test at more than one size, which is why our comparison publishes results across five chart types and the test code alongside them.
For reference, LightningChart JS loads ten million data points in 0.29 seconds. The full results, including how every tested library behaves as the dataset grows, are in the LightningChart JS performance comparison.
If you want to see those questions answered for 23 charting libraries side by side, the benchmark is published in full.

A checklist for comparing charting libraries
Performance claims only become comparable when you know how they were produced. Six questions cover almost everything that matters, and they work on any vendor’s numbers.
- How much data was in the test? A frame rate or a load time without a data volume cannot be compared against anything.
- How long did it take, or what frame rate held? One or the other, stated as a number rather than a range.
- On what hardware? CPU, GPU and memory. A result from a workstation and a result from a laptop are not the same result.
- Was it tested at more than one data size? One data point tells you nothing about how the library behaves as your dataset grows, which is the thing that will actually catch you out.
- Is the test code published? If you cannot run it yourself, you are trusting a claim rather than reading a measurement.
- Were the competing libraries tested the same way? Benchmarks comparing a vendor’s own fresh test against competitors’ published figures from elsewhere are not comparisons. Same machine, same data, same day, or it does not count.
Very few charting vendors answer all six, which is the real reason choosing a high-performance library is harder than it should be. The information to make a confident decision mostly is not published, so buyers end up testing several libraries themselves.
Run the checklist against us as well. Our JavaScript benchmark covers 23 libraries across five chart types with the test code on GitHub, and the .NET benchmark does the same on the desktop side. Where we are still missing a detail, as with the hardware specification on the older figures above, we would rather say so than leave it vague.
Common questions about chart performance
What is a good FPS for a chart?
60 FPS, because that is where most displays stop refreshing and more frames stop being visible. Anything sustained above 30 FPS will feel acceptable for panning and zooming, and below that a chart starts to feel like it is lagging behind the cursor. The figure only means something alongside a data volume: 60 FPS on a thousand points is unremarkable, 60 FPS on a million while data is still streaming in is not.
How many data points can a JavaScript chart handle?
It varies by two or three orders of magnitude between libraries. Many browser charting libraries slow to an unusable frame rate somewhere between 10,000 and a few hundred thousand points, because they create a DOM or SVG element per point. Libraries that render through WebGL work in millions. Our published figures and the per-library results for 23 tested libraries are in the LightningChart JS performance comparison.
What makes one charting library faster than another?
Mostly where the drawing happens and how the data is stored. A library that creates a separate element per data point hits a wall early, because the browser has to manage every one of them. A library that hands the data to the GPU as a block draws the whole series in one operation. The second approach scales; the first does not, regardless of how well it is written.
Does WebGL or GPU rendering automatically mean better performance?
No. It describes where the work happens, not how well it is done. GPU rendering implemented poorly can be slower than CPU rendering implemented well, particularly on the first draw, where badly organised data transfer can cost more than it saves. Treat it as a reason to look at the numbers rather than as a number in itself.
How do I test charting library performance myself?
Load your own data at the size you expect in production, then at twice that size. Measure the time from request to first render, then pan and zoom and watch whether the frame rate holds. Test every candidate on the same machine on the same day. Most published comparisons fail that last condition, which is why running your own test on two data sizes beats reading any vendor’s page, including ours.
Why do charting libraries not publish hardware specifications?
Usually because the figure is less impressive once you can see what produced it. A result from a workstation with a dedicated GPU is not a result a user on a laptop will reproduce. Where a vendor publishes a number without naming the machine, treat it as an upper bound achieved under favourable conditions rather than as what you will get.
Test it on your own data
The last answer above says running your own test on two data sizes beats reading any vendor’s page, including this one. That is not a throwaway line. Load your real data at production size, then at double it, and watch what happens to the load time and the frame rate.
LightningChart JS is free for 30 days with no card required, so you can run that test before committing to anything.

Trend Lines in Trading
Trend lines are among the simplest yet most powerful tools in technical analysis. They help traders visualize market direction, identify potential support and resistance levels, and make more informed trading decisions. Despite their simplicity, trend lines remain a...
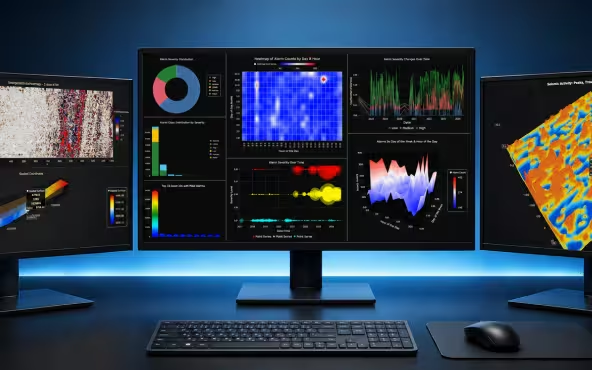
Best Python Charting Library in 2026
Python's charting ecosystem is large, overlapping, and regularly misunderstood. Most comparison guides stop at Matplotlib, Plotly, and Seaborn. This one goes further: it covers what happens when your datasets grow large, your update rates increase, or your chart types...
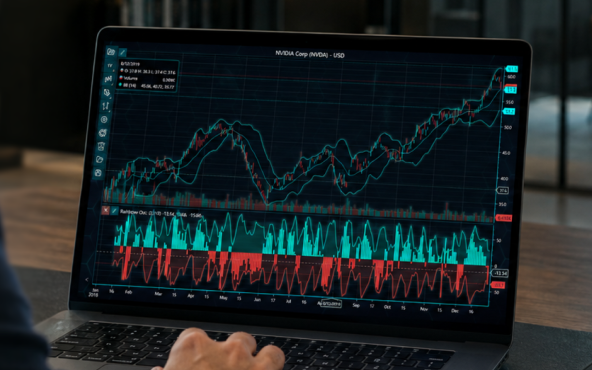
Best TradingView Charting Library Alternative
TradingView's charting libraries are the most visible option for fintech developers. Visibility is not the same as capability. This guide is for developers who have hit the wall on candle count limits, watermark restrictions, branding requirements, real-time...



If you have any questions, feel free to contact us!



©LightningChart Ltd 2026. All rights reserved.





