


Blog
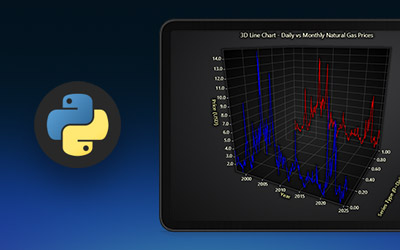
Global Natural Gas Prices
Discover effective techniques for visualizing data trends and patterns in global natural gas prices with LightningChart Python.
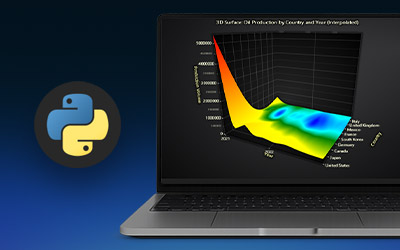
Global Oil Production
Learn how to conduct a comprehensive analysis of global oil production using LightningChart Python to spot market trends and dynamics.
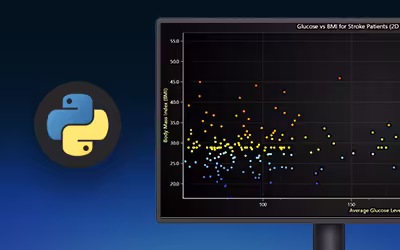
Stroke Prediction
Use LightningChart Python to visualize clinical data for stroke prediction. Enhance healthcare insights through high-performance data visualization.
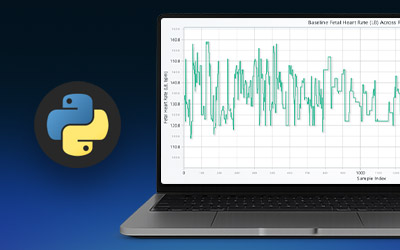
Cardiotocography Analysis
Learn to perform a detailed cardiotocography analysis in Python with LightningChart, enhancing your data interpretation skills effectively.
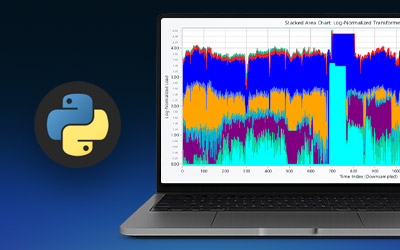
Power Load Analysis
Learn how to create a detailed power load analysis using LightningChart Python for accurate and efficient data visualization.
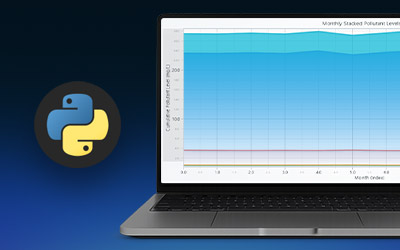
China Water Pollution Monitoring Application
Learn to develop a water pollution monitoring app utilizing China data to track and analyze water quality for a healthier environment using Python.
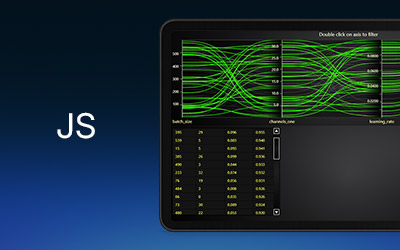
Parallel Coordinate Plot
Discover how to build an interactive app with LightningChart JS that features a detailed parallel coordinate plot with advanced UI features.
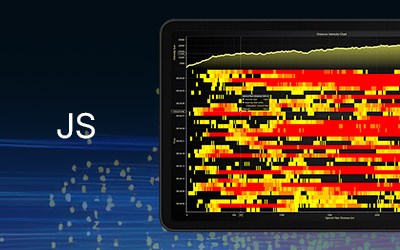
Optical Fiber Analysis
Create powerful visualizations with LightningChart JS to improve your understanding of optical fiber analysis.
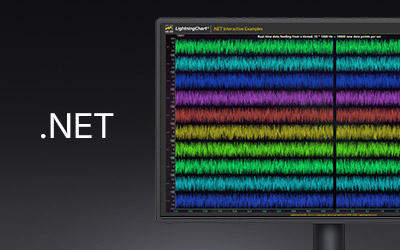
Multi Channel Data App
Learn how to create a powerful app using LightningChart that effectively handles multi channel data from a real-time thread source.
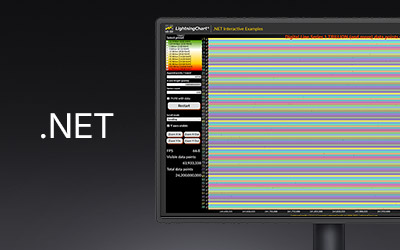
One Trillion Data Points Data App with LightningChart
Discover how to effectively visualize one trillion data points using LightningChart .NET for enhanced data analytics app development.


If you have any questions, feel free to contact us!
©LightningChart Ltd 2026. All rights reserved.