


Blog
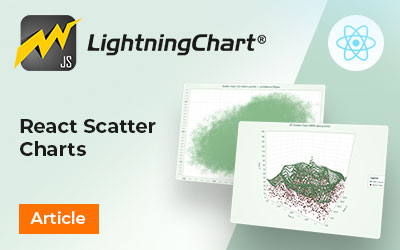
React Scatter Charts
Written by a human | Updated on April 14th, 2025React Scatter ChartsIn today's data-driven world, the ability to effectively visualize and interpret data is crucial for businesses across various industries. Whether you are analyzing complex datasets, tracking trends, or discovering patterns, charts and visualizations play a vital role in...
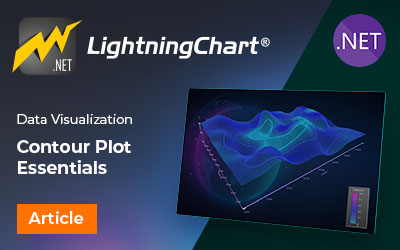
Contour Plot Essentials
Written by a human | Updated on April 14th, 2025Contour Plot EssentialsContour plots offer an engaging and visually appealing way to present complex data. These tools not only facilitate the exploration and interpretation of spatial data but also allow us to represent three-dimensional data on a two-dimensional plane. With their wide applications...
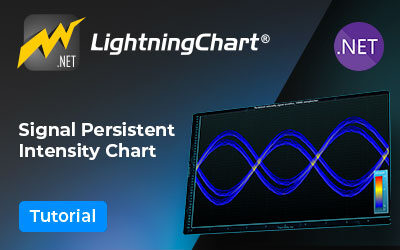
Signal Persistent Intensity Chart
Written by a human | Updated on April 14th, 2025WPF Signal Persistent Intensity ChartHello! Today we're deepening into how to create an intensity series application commonly used in Digital Signal Processing. So, the Signal Persistent Intensity chart shows a time-varying representation of the intensity (magnitude) of signal data. You can expect...
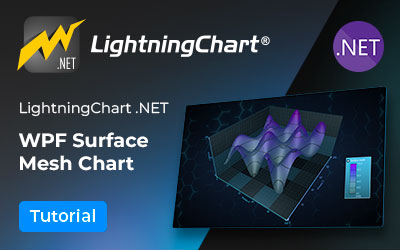
Surface Mesh Chart
Written by a human | Updated on April 14th, 2025WPF 3D Surface Plot Hello! This is Omar and I'm back with an interesting WPF surface mesh chart application tutorial. This chart is also known as a surface or mesh plot and is useful for visualizing 3D data. The surface mesh chart is a three-dimensional plot that creates a grid of...

Fast Line Charts
Fast line charts speed and quality of rendering comparison of .NET framework control versus LightningChart .NET charting control

JavaScript Gauge Chart
Written by a human | Updated on April 14th, 2025JavaScript Gauge ChartIn this article, we'll create a JavaScript gauge chart using LightningChart JS. The implementation of the project will be similar to other articles, such as the donut chart or the pie chart. I strongly recommend you check those and expand your command on creating simple JS...

JavaScript Radar Chart
Written by a human | Updated on April 14th, 2025JavaScript Spider ChartData analysis has become an integral part of decision-making processes in various industries, from finance to healthcare to marketing. The amount of data being collected is increasing. This leads to a greater need for tools that can analyze and communicate complex data sets...

Volume in Big Data
Written by a human | Updated on April 14th, 2025Volume in Big DataBig data is a prevalent term and is even used by those who associate big data with just a lot of data points. Big data is not a new term, and the collection of information has always been there. Simply put, every system can create new data, for instance, individuals and businesses...

Donut Chart
Written by a human | Updated on April 14th, 2025JavaScript Donut ChartIn this article, we'll be doing a simple yet extremely useful donut chart. For this example, we'll use the LightningChart JS library and the pie chart component. A donut chart is basically a variation of a pie chart divided into segments representing a category. The size of...

JavaScript heatmaps
Written by a human | Updated on April 11th, 2025JavaScript heatmapsHeatmaps are a type of charting component that uses color-coded cells to represent values in a dataset. Each cell in a heatmap corresponds to a specific data point or value. The color grading within the cell indicates the magnitude of that value. Colors are used to represent...


If you have any questions, feel free to contact us!
©LightningChart Ltd 2026. All rights reserved.