


Blog
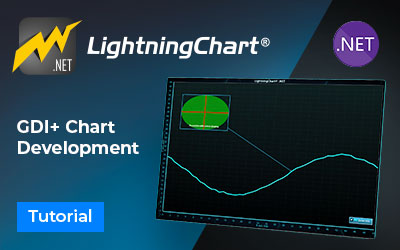
GDI+ chart development with System.Drawing package
Written by a human | Updated on April 14th, 2025GDI Chart Development with System.Drawing & LightningChart .NETThis article will focus on GDI chart development. Concretely, we will build a custom ViewXY chart application with LightningChart .NET. Even if it sounds too complicated, I'll walk you through the easy way to take advantage of this...

Telemetry Analytics
Written by a human | Updated on April 14th, 2025Telemetry AnalyticsHi, I'm Omar. You've probably seen me in other programming articles. Recently, I published a medical telemetry article that explains what telemetry analytics is and how it is applied to the medical field. Now, in this article, we will discuss how Telemetry works as a data...

Digital Signal Processing Applications
Written by a human | Updated on April 14th, 2025Digital Signal ProcessingIn today's technology-driven world, digital signal processing (DSP) plays a crucial role in various industries and applications. DSP involves the manipulation and analysis of digital signals to extract valuable information or enhance the quality of the signal. It has become...

Dynamic Coloring 2D Charts
Written by a human | Updated on April 14th, 2025Dynamic Coloring 2D Charts in LightningChart JSHello! This week's tutorial is about Dynamic Coloring 2D Charts with LightningChart JS. This will be a guide where we'll explore the practicality and creativity that dynamic coloring brings to JavaScript charting applications... in other words, why use...

Cardiac Mobile Cardiovascular Application
Written by a human | Updated on April 14th, 2025Cardiac Mobile Cardiovascular Application in AndroidLet's keep diving into telemetry topics. This time we'll create a cardiac mobile cardiovascular application using Android 11 and LightningChart JS. In the rapidly evolving landscape of healthcare, mobile applications have become invaluable tools...

Medical Telemetry
Written by a human | Updated on April 14th, 2025Telemetry MedicalHello! I'm Omar, if you've checked my previous LightningChart articles, you've probably seen my work. My articles focus on creating and implementing JacaScript charts and .NET charting components using various technologies in conjunction with LightningChart libraries. In this...
Telemetry Dashboard
Written by a human | Updated on April 14th, 2025JavaScript Telemetry DashboardToday we will do a telemetry dashboard exercise with 3 chart types that often are used for telemetry studies. All these three charts will be displayed within the same dashboard while sharing the same view at the same time. For the telemetry dashboard, we will use a...
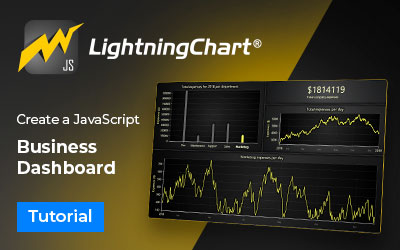
JS Business Dashboard
Written by a human | Updated on April 14th, 2025JavaScript Business DashboardIn this article, I'll be showing how to create a JavaScript business dashboard to visualize key business metrics from different departments. The dashboard is interactive and during the tutorial, you'll learn about different parameters and LightningChart (LC JS) classes...
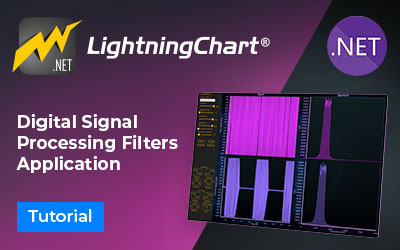
Digital Signal Processing Filters Application
Written by a human | Updated on April 14th, 2025Digital Signal Processing Filters ApplicationA digital signal processing filters application may not be the typical charting application but is rather a more complex and powerful type of signal data chart control. This type of charting control is useful for improving the quality and integrity of the...
JavaScript Charts in R
Written by a human | Updated on April 14th, 2025JavaScript Charts in RIn this article, we will do an exciting exercise in R to analyze a dataset for descriptive statistics and visualize the data trend using the LC4R package. For this example, we will learn how to install the LC4R package in the R studio IDE, the packages we will need for data...


If you have any questions, feel free to contact us!
©LightningChart Ltd 2026. All rights reserved.