


Blog
Positive Volume Index
Positive Volume Index is a technical indicator that tracks trading volume of a stock, focusing specifically on days when the volume increases
Negative Volume Index
Negative Volume Index Indicator focuses on days when trading volume decreases compared to the previous day, based on “Smart Money” idea
EEG Frequency Analysis
An EEG Frequency Analysis is a neuroimaging technique that captures the electrical activity of the human brain critical for patients diagnosis.
Market Facilitation Index as a Trading Strategy
The Market Facilitation Index combines price range and volume to reveal the efficiency of market movements.
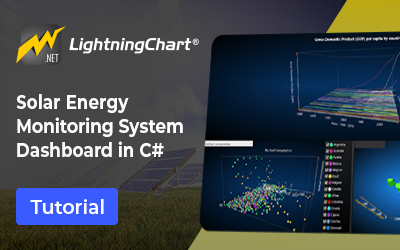
Energy Monitoring System Dashboard
Tutorial how to create an energy monitoring system dashboard in C# with LightningChart .NET charting components.
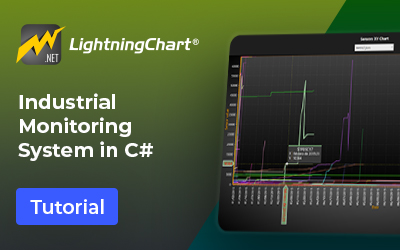
Industrial Monitoring System in C Sharp
Step-by-step tutorial how to create an industrial monitoring system in C# using LightningChart charting components.
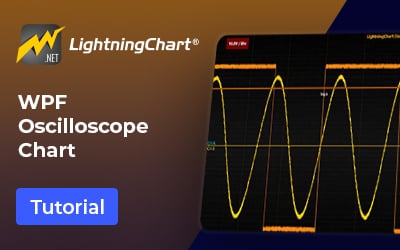
Oscilloscope Chart
Step-by-step tutorial on how to create an oscilloscope chart application in WPF using LightningChart .NET charting components.
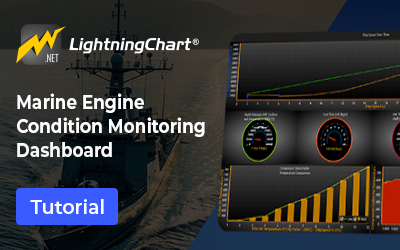
Marine Engine Condition Monitoring
Dashboard Implementation of a naval vessel’s marine engine condition monitoring application using LightningChart .NET data visualization components.

3D Terrain Modelling
3D terrain modelling implementation of data application project using LightningChart .NET WPF chart controls for data application development.

Modern WPF UI Controls
A guide to creating desktop data applications with LightningChart .NET modern WPF UI Controls.


If you have any questions, feel free to contact us!
©LightningChart Ltd 2026. All rights reserved.