


Blog
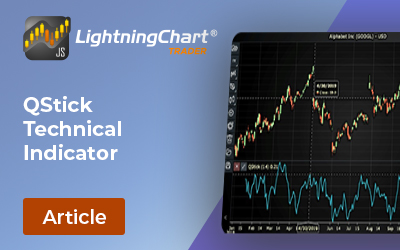
QStick Technical Indicator
Discover how to effectively use the QStick technical indicator in LightningChart JS Trader to enhance your trading strategies and analysis.
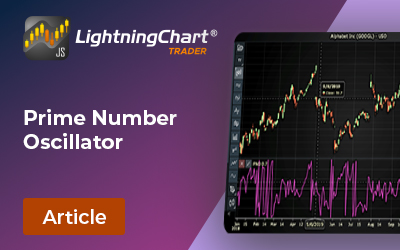
Prime Number Oscillator
Discover how the Prime Number Oscillator can enhance financial analysis and improve investment strategies for better decision-making.
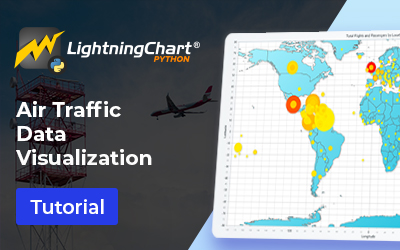
Air Traffic Data Visualization
Discover air traffic data visualization with LightningChart Python, enabling clear insights into flight patterns and enhancing data analysis techniques.
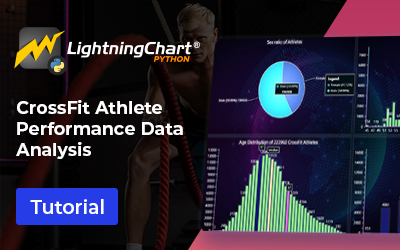
Crossfit Data Analysis
Explore crossfit data analysis techniques to evaluate athletes’ performance using Python for actionable insights and improved training outcomes.

Pretty Good Oscillator
Explore the Pretty Good Oscillator theory and learn how to implement it in your charts for improved trading insights and strategies.

Drone Data Analysis
Master drone data analysis with LightningChart JS, utilizing its powerful charts to create stunning visualizations and gain in-flight insights.

AI Sensors Data Analysis
Discover how AI sensors data analysis is transforming the defense industry by enhancing decision-making and operational efficiency.
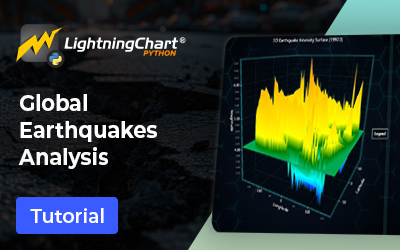
Global Earthquakes Analysis
Explore global earthquakes analysis using LightningChart Python to visualize seismic data and gain deeper insights into earthquake patterns.
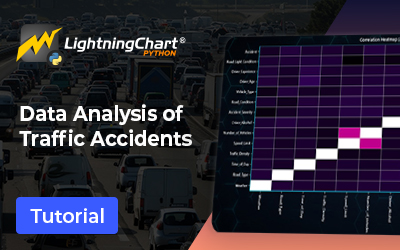
Traffic Accidents Data Analysis
Explore traffic accidents data analysis using LightningChart Python to visualize and interpret traffic occurrence patterns effectively.

Ship Fuel Consumption Analysis
Explore ship fuel consumption analysis and its impact on CO2 emissions to understand how to optimize maritime operations for a greener future.


If you have any questions, feel free to contact us!
©LightningChart Ltd 2026. All rights reserved.