


Blog

Naval Vessel Project FAQs
FAQs about our Naval Vessel .NET Application article.

World Map with Zoom
Learn to create a responsive JavaScript world map with zooming features using LC JS with effective data exploration and visualization.
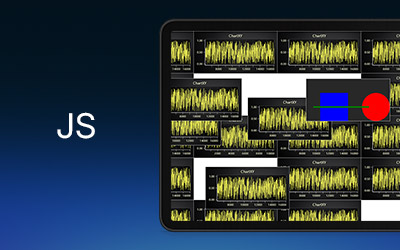
Multi-chart Canvas
Learn how to create a stunning JavaScript multi-chart canvas using LightningChart, enhancing data visualization for your applications with ease.
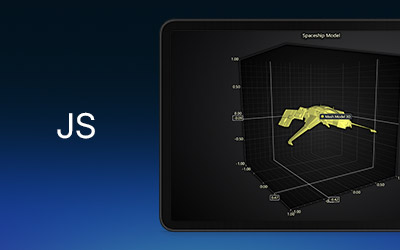
3D Mesh Model
Discover how to create an interactive JavaScript 3d mesh model using LightningChart JS for engaging visualizations and enhanced user experience.

Racing Dashboard
Learn how to create a JavaScript racing dashboard with high-performance JS charts and LightningChart.

Parallel Coordinate Chart
Explore this tutorial to learn how to create a real-time parallel coordinate chart for powerful data analysis and visualization in JavaScript.

Ternary Plot
Learn how to create a WPF ternary plot using LightningChart .NET for integration into data visualization desktop applications.

Seismic Spectrogram Chart
Learn to create a WPF seismic spectrogram chart using LightningChart in this comprehensive tutorial for developers.

WPF Trading Application
Learn how to create a powerful WPF trading application using LightningChart in this comprehensive tutorial for developers.

Zooming and Panning
Discover the zooming and panning features in Polar and Smith charts to enhance your charting application user experience.


If you have any questions, feel free to contact us!
©LightningChart Ltd 2026. All rights reserved.