








Debunking SciChart’s 2026-Q1 Performance Benchmark | LightningChart JS
Article
Written by a human
Learn more about SciChart's misleading benchmark performance metrics that distort how a real high-end chart library performs.
Niilo Keinänen
CTO, LightningChart JS, Team Lead (JS)

Introduction
As per our standards at LightningChart Ltd., we have always maintained publicly available performance benchmarks of our charting libraries since 2021. Recently, one of our competitors published an article titled “A Comprehensive Benchmark Suite to Compare Chart Performance”, and there are critical issues in their content that we cannot stay silent about.
In our assessment this performance comparison favors SciChart and understates other libraries. Their benchmark, available at Chart Bench: A Comprehensive Benchmark Suite to Compare JavaScript Chart Library Performance, does not represent real data visualization use cases.
A company’s own marketing materials are expected to support its own products. In our view this content goes further and is misleading to its readers. We’ve summarized the key issues with their benchmarks into the following points:
Completely Unrepresentative Benchmarks of Real Use Cases
SciChart themselves have mentioned a clearly visible disclaimer on their GitHub page, which is not being disclosed in their blog posts.
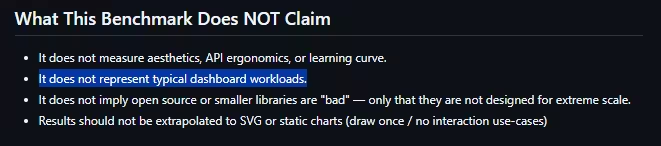
Source: SciChart, ChartBench README, github.com/abtsoftware/javascript-chart-performance-test-suite (GPL-2.0).
What does this disclaimer actually mean for those considering SciChart?
In practice, here’s how SciChart’s benchmark applications look, which is completely unrepresentative of real use cases.
Screen recordings of SciChart’s ChartBench test applications, https://github.com/abtsoftware/javascript-chart-performance-test-suite (GPL-2.0), run by LightningChart. SciChart and the SciChart logo are trademarks of SciChart Ltd.
Forced Charts Re-rendering
Nearly all the tests are based on programmatically tweaking the value axis interval by a small amount every frame, forcing charts to re-render.
Misleading Scoring System
Their scoring system places exponential value on FPS (how many times per second the chart is re-rendered). However, they are also separately counting FPS and Frames, which are the same metric, and even raised both metrics to the power of 1.5.
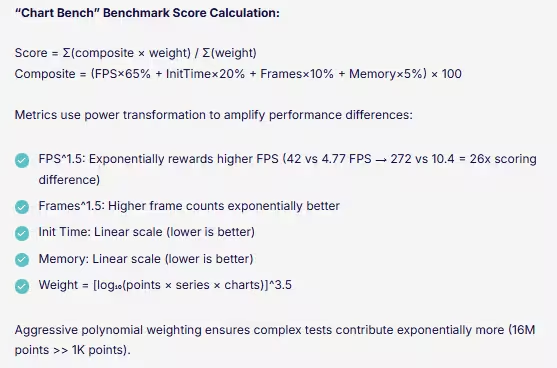
Source: “Chart Bench: A Comprehensive Benchmark Suite to Compare JavaScript Chart Library Performance”, SciChart blog, https://www.scichart.com/blog/chart-bench-compare-javascript-chart-libraries/.
Biased Result Maximization
Finally, they run the tests with a 240 FPS ultra-high refresh rate monitor, which amplifies the effect of the scoring choices described above. Their test suites for other libraries have further problems. More on that later.
How LightningChart Runs Benchmark Tests
For the average viewer, none of this is noticeable. Even for an insider reader, this is not noticeable unless one actually runs the tests on one’s own computer and makes an effort to evaluate them. We understand that comparing chart performance is difficult, and even with these details laid out above, it is still unclear why and how all of this matters. So, let’s take a look at another way of doing the comparison for reference.
In LightningChart JS performance tests, we separately run tests for measuring A) Static use case performance and B) real-time use case performance. The scoring is performed as follows:
Static Use Cases
score = (numChannels x dataPerCh) / loadTimeSeconds
Real-Time Use Cases
score = numChannels x newDataPerSecond x FPS
Why are these metrics important?
The term “Performance” is ambiguous, and SciChart’s benchmark does not resolve that ambiguity for its readers. When we talk about Static Use Cases, we refer to situations where the user has a dataset X and wants to display it as soon as possible. In this case, it is critical to understand that the only “performance” that matters is how fast the user can display that data!
However, SciCharts’ tests involve playing around with the value axis interval, measuring FPS, and then telling readers that this means that the chart did a “good job”. The only situation where FPS is meaningful is in real-time use cases. i.e., new data is displayed in the chart every frame. But there is no excuse to raise it to the power of 1.5 and further multiply by frame count (which is the exact same measurement!) and further raise to the power of 1.5.
Conclusion
The above-mentioned facts are the most important issues with SciChart performance comparison materials. They “compare performance” in a way that does not make sense, with use cases that do not reflect reality. We identify this as a major concern because this misleading information is communicated across their channels as conclusive evidence. For example:

Source: “Chart Bench: A Comprehensive Benchmark Suite to Compare JavaScript Chart Library Performance”, SciChart blog, https://www.scichart.com/blog/chart-bench-compare-javascript-chart-libraries/.

Source: SciChart, ChartBench README, https://github.com/abtsoftware/javascript-chart-performance-test-suite (GPL-2.0).
All in all, our initial look into their materials resulted in 20 pages of issues. Some examples of configuration differences in the other library test apps include:
- SciChart has selected a 30-month-old library version on the basis that later versions require the download of a free trial.
- In SciChart apps, light configurations are set, whereas for other libraries, all defaults are used, or even slower configurations are applied.
- For LightningChart’s benchmark, they have used features that differ from those in the respective SciChart tests, and that are slower by design.
- In several LightningChart benchmarks, they do not utilize features for best performance (such as shared contexts, shared timestamps, max. sample counts, disabling animations, …), which are documented and, in some cases, flagged by automatic warnings in the console.
We reiterate our commitment to delivering the best charting technology and performance in all our libraries. Our benchmarks are public and can be consulted on GitHub.
Continue learning with LightningChart

Understanding Multithread Application with LightningChart .NET
Written by a human | Updated on April 9th, 2025Multithreaded chart applications with LightningChart .NET data visualization control Getting an application to run smoothly using background threads can really make a big difference. Unloading non-essential...

How to Create a Strip Chart
Written by a human | Updated on April 9th, 2025What is a Strip chart application and what are the modern equivalents to it? Before computers exist or were taking their first steps, a Strip chart was a way to visualize an analog electrical signal. Voltage was...
Data Visualization Template for Electron JS | LightningChart®
Updated on April 4th, 2025 | Written by humanAre you already building cross-platform applications with Electron JS? In some of our previous articles, we’ve worked on TypeScript projects where we created pie charts and vibration chart applications. And as we...



If you have any questions, feel free to contact us!



©LightningChart Ltd 2026. All rights reserved.