


Cleaning Memory Resources Correctly 101

By Nikolai Arsenov
Software Developer & Quality Control Specialist
For cleaning memory resources efficiently, application should dispose existing objects before clearing related collection.
LightningChart provides predefined collections, e.g. XAxes, YAxes, PaletteSteps, etc. in WinForms and WPF Non-bindable platforms. In WPF Semi-bindable and Bindable platforms they should be created manually (e.g. ViewXY.CreateDefaultXAxes()). Moreover, a user’s application can have created collections of series, annotations, markers, cursors, etc.
If a user needs to recreate new specific collection for the chart without modifying the existing one, the old collection should be removed properly to use memory resources efficiently.
The following lines clean y-axes collection. However, the resources inside the application have not been freed, and they still reserve memory.
chart.ViewXY.YAxes.Clear();
Instead of using .Clear() method for collection, call .Dispose() for each item and clean the collection. Dispose method releases any resources from memory for clean-up:
foreach (AxisY yAxis in chart.ViewXY.YAxes)
         yAxis.Dispose();
chart.ViewXY.YAxes.Clear();

// Create new Y-axes collection
for (int axisY = 0; axisY < axisYCounter; axisY++)
{
        // Create your axes here
}
In our Demo applications, we have an auxiliary method to make proper resource cleaning:
ExampleUtils.DisposeAllAndClear(chart.ViewXY.YAxes);
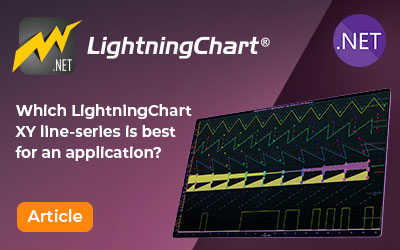
Choosing the right XY line series
LightningChart .NET features 10 different line series. Read more about their characteristics and functionalities and choose the best for your app.

JavaScript Refreshing Spectrum Chart
Written by a human | Updated on April 10th, 2025JavaScript Refreshing Spectrum Chart Hello again, this time I bring a quick but helpful tutorial on how to create a JavaScript refreshing spectrum chart. A spectrum chart is commonly used in reading and plotting...
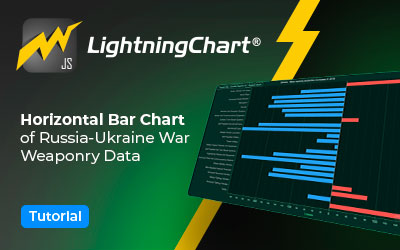
Horizontal Bar Chart of Russia-Ukraine War Weaponry Data
Written by a human | Updated on April 10th, 2025 JavaScript Horizontal Bar Chart In this article, we aim to respectfully create a JavaScript horizontal bar chart that simulates the weaponry usage on recent war conflicts. While the data have been taken from Kaggle and...


If you have any questions, feel free to contact us!
©LightningChart Ltd 2026. All rights reserved.