


Announcing LightningChart JS v.8.2
Introducing new product features, visual quality, performance, and dev experience improvements.
New Product Features
LightningChart JS v.8.2 introduces new product features. Here’s an overview:
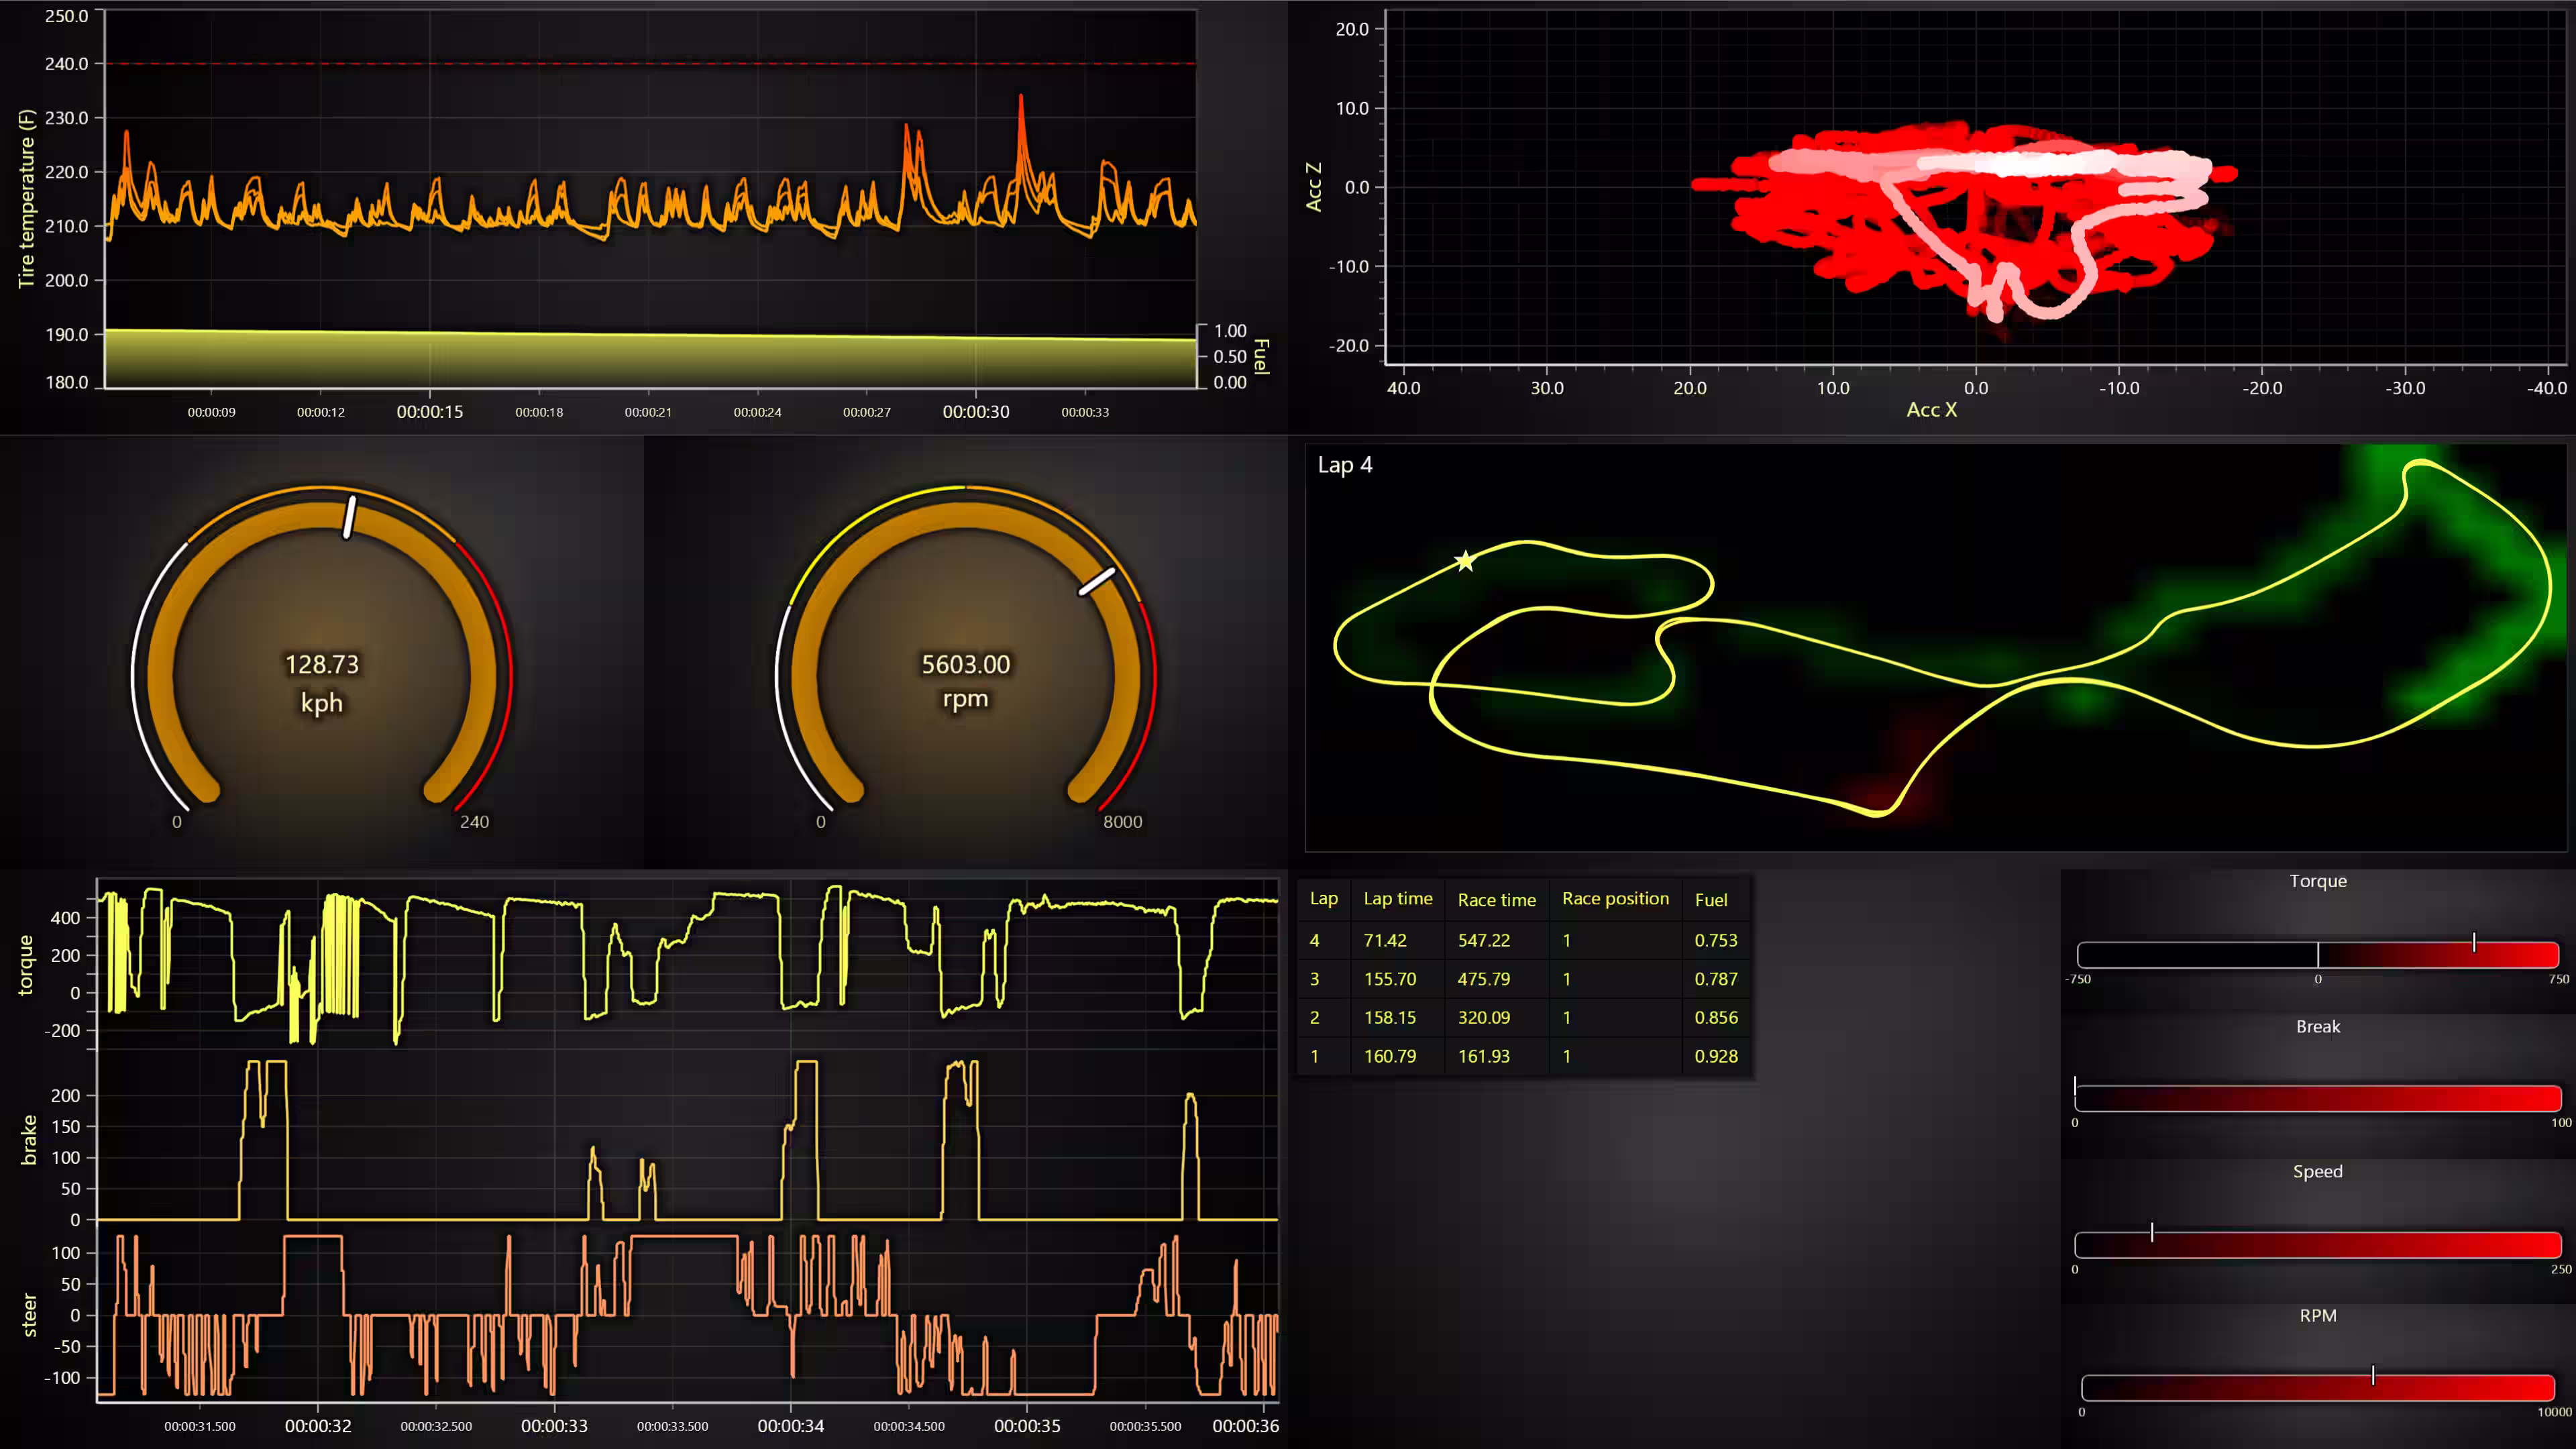
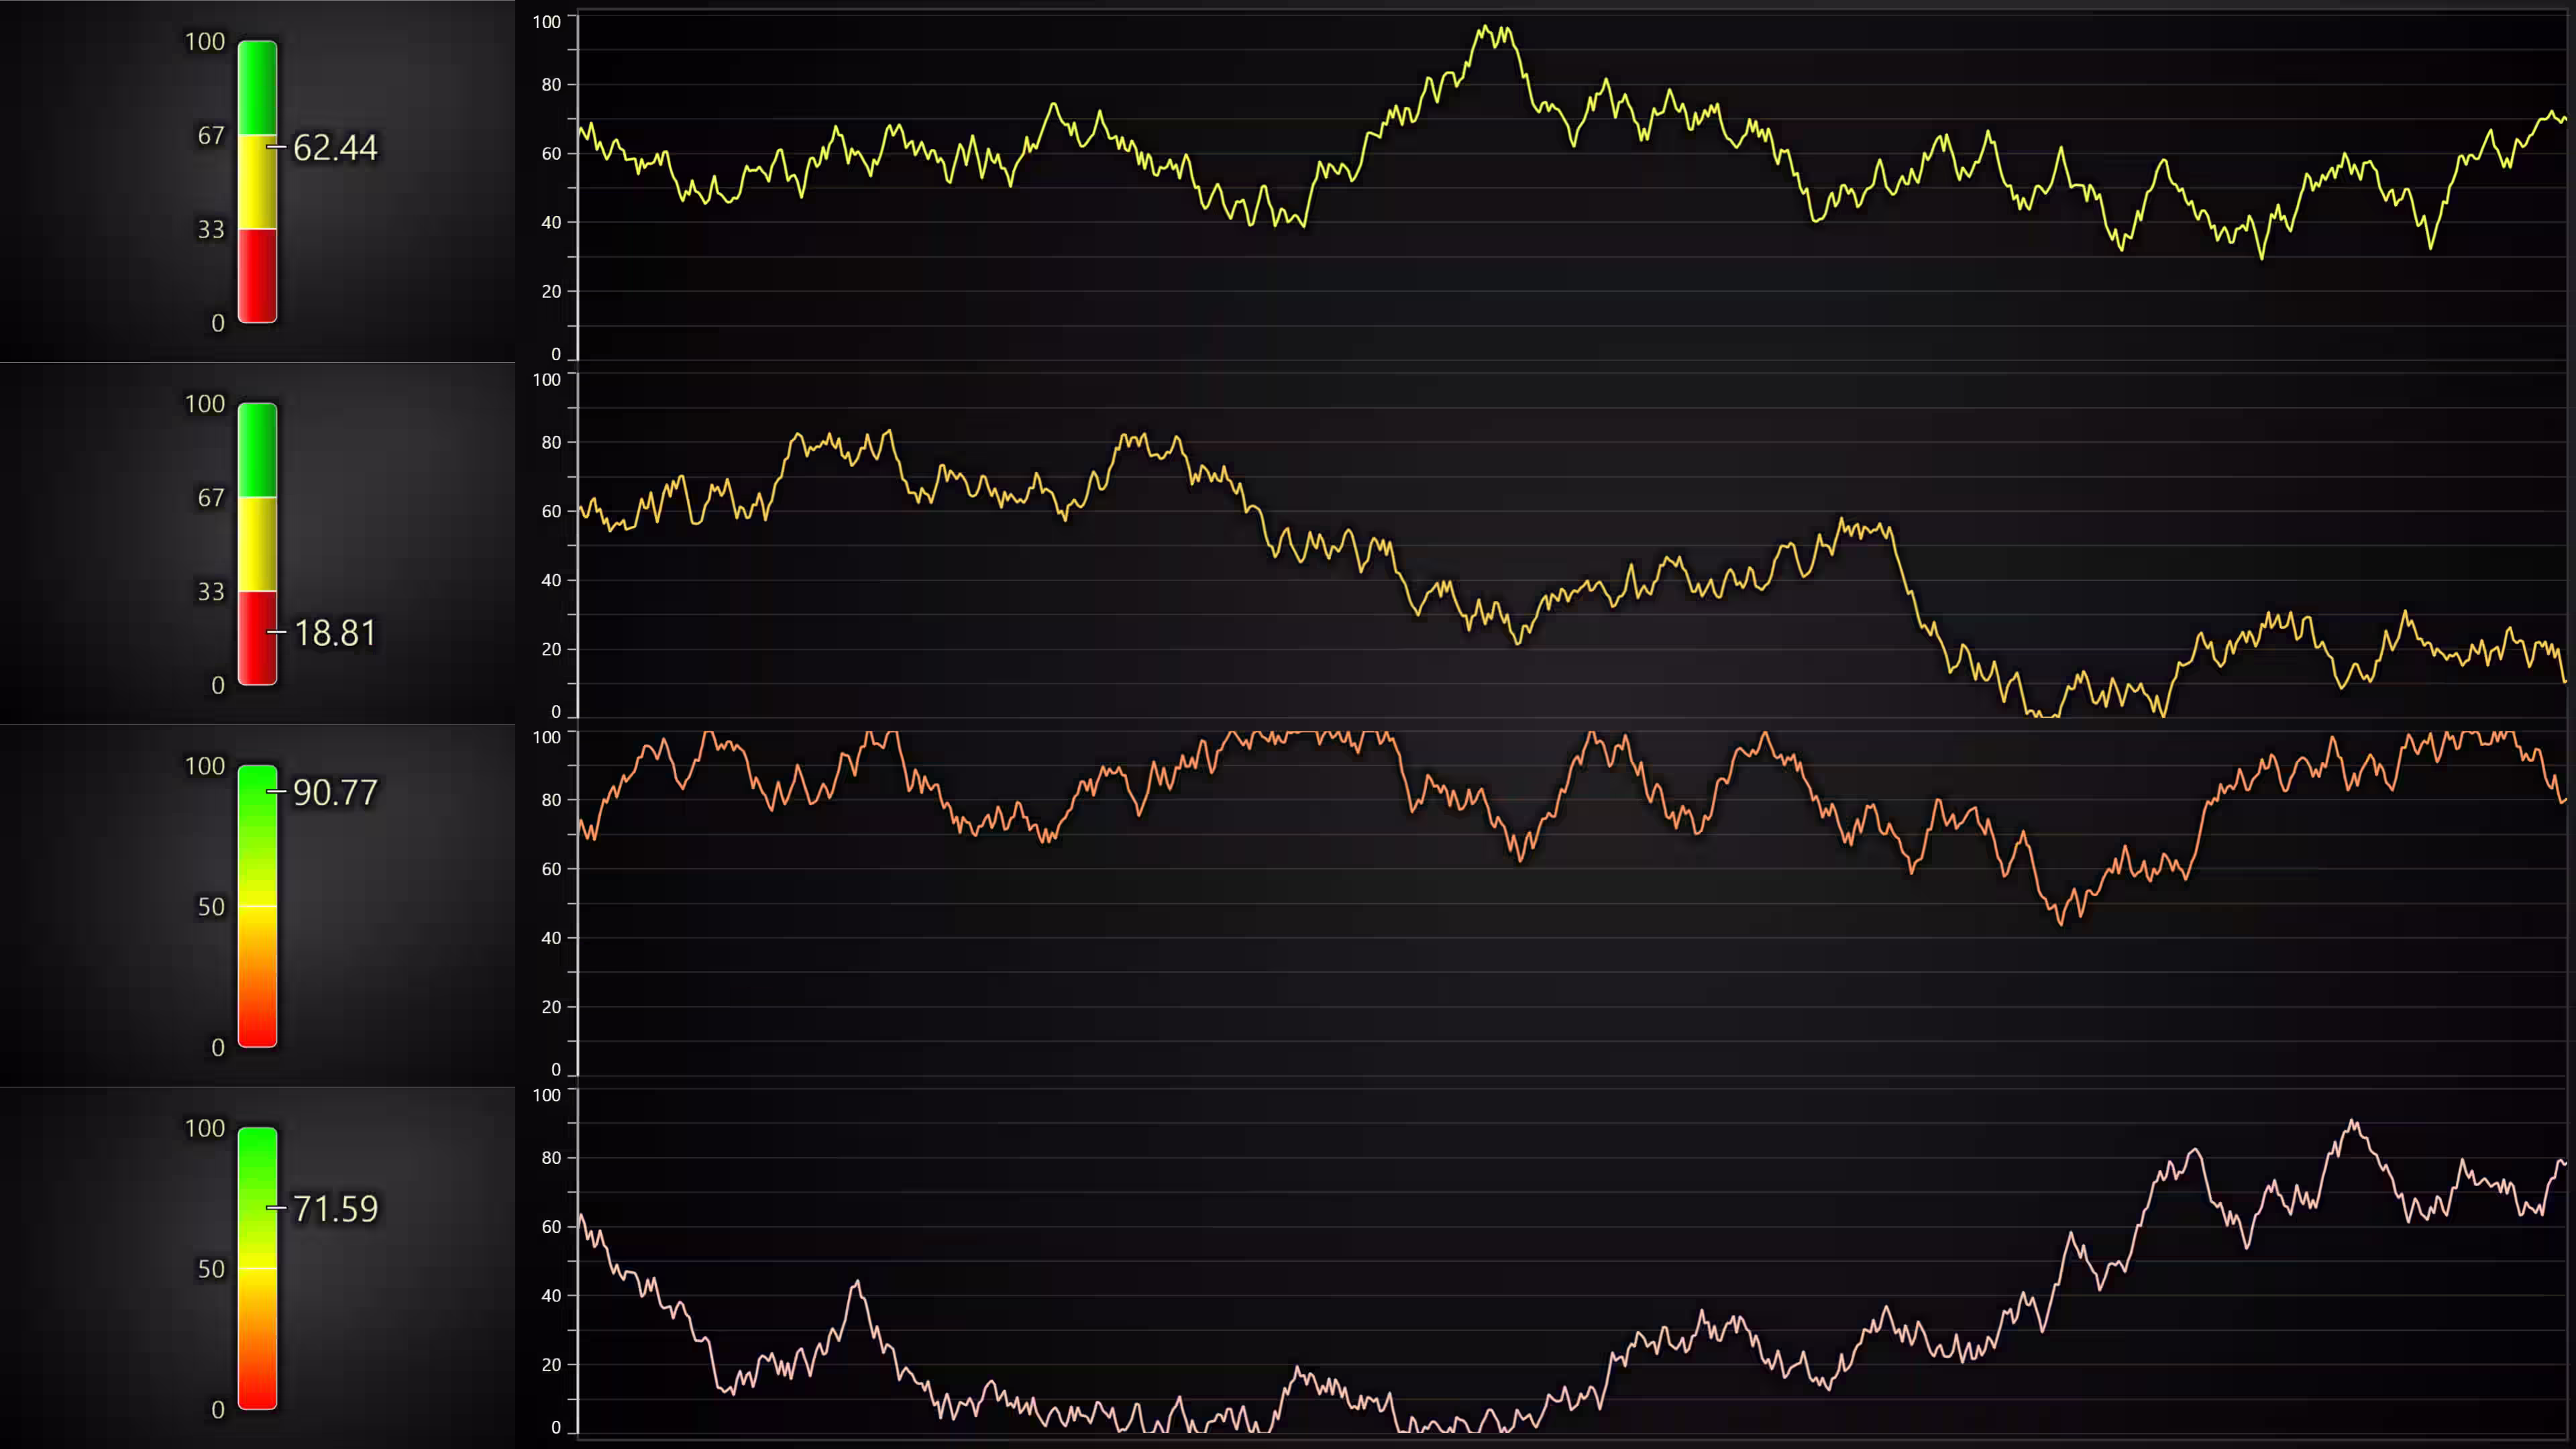
Linear Gauge Chart
In this 8.2 release, LightningChart JS introduces a new linear gauges chart type featuring real-time data updates, interpolated and non-interpolated color steps, vertical and horizontal alignments, with the ability to display current values, and custom icons.
Render transformations for XY series
LightningChart JS 8.2 introduces a new API that allows arbitrary affine transformations for XY series. What this means is that the user application code can freely transform already existing data by offsetting and/or scaling it.
This operation is extremely efficient and does not require any re-preparation of data. Arbitrary affine transformations are useful for cases like oscilloscopes.
lineSeries.setRenderTransform({
    x: { offset: 0, scaling: 1 },
    y: { offset: 100, scaling: 10 }
})
API for custom tick placement
This feature was inspired by a use case that allows the user to take full control of where the axis ticks are placed. Axis ticks could already be placed manually using Axis.addCustomTick(), but this is very inconvenient when having to adjust to different zoom ranges, and there are also some performance concerns.
This API also allows specifying tick positions separately between major & minor tick levels.
axis.setTickStrategy(AxisTickStrategies.Numeric, (strategy) => strategy
.setCustomTickPlacement((info) => [
{ position: 0 },
{ position: 1000 },
{ position: 2000 },
])
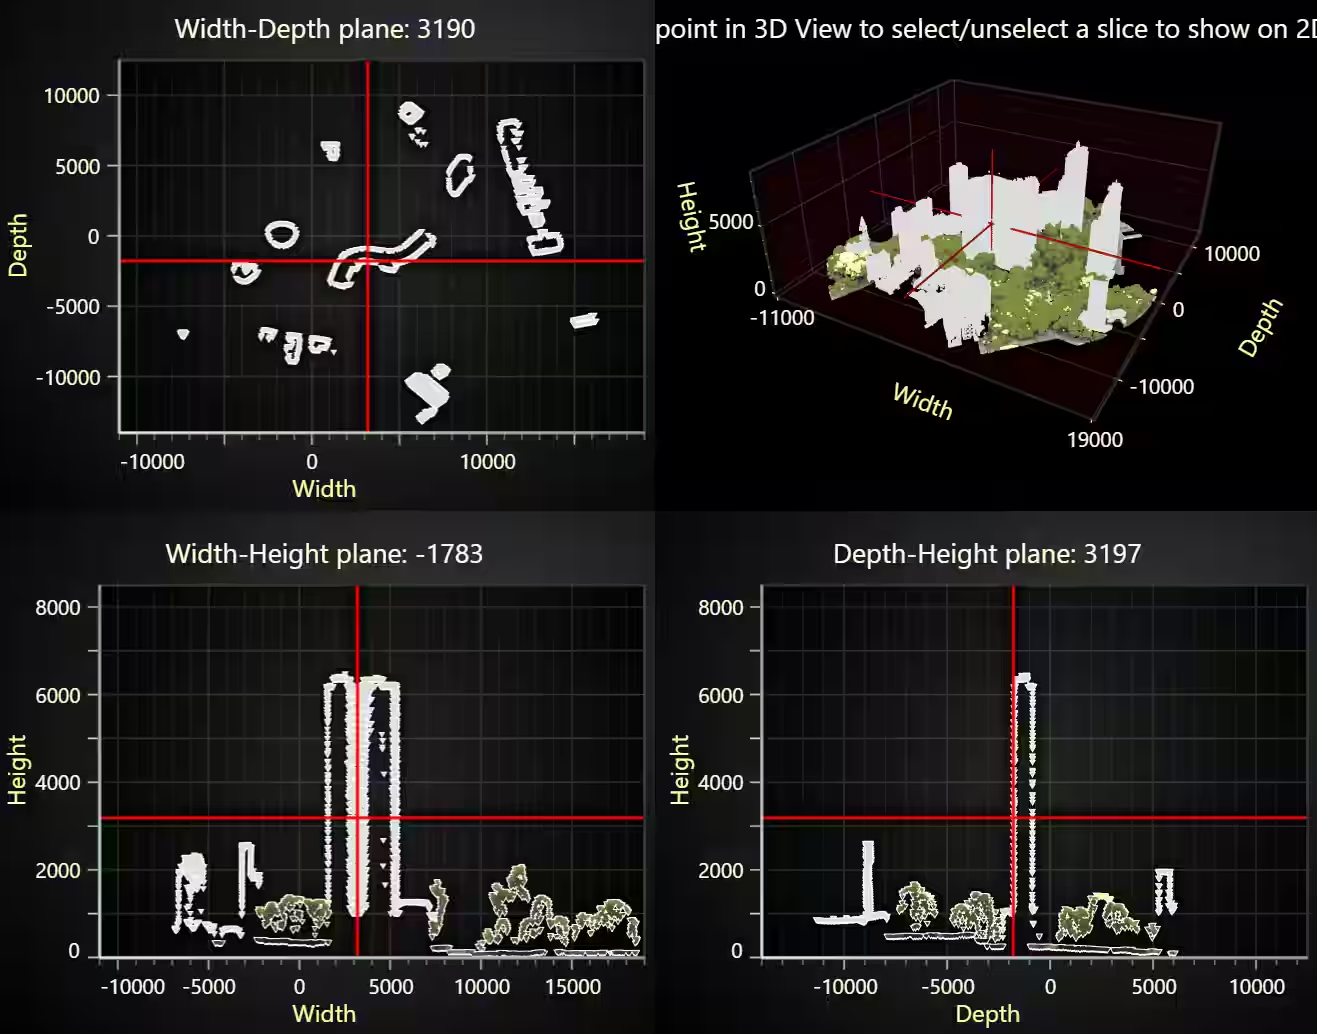
)High-precision 3D axes
- easily displaying timestamped data even when zoomed far in
- displaying large or small numbers
const chart3D = lc.Chart3D({
    defaultAxisX: { type: 'linear-highPrecision' }
})
Visual Quality Improvements
In this release, we are improving the sensitivity configuration of the XY points visibility. This feature was inspired by a use case that could allow configuring how early or how late points are displayed when zooming into XY axes. By default, the points are not displayed until the user zooms in so far that the points would not overlap.
// Example, reduce sensitivity to make points appear later than normally when zooming
series.setPointDisplayBehavior({ sensitivity: 0.5 })
Performance Improvements
This version introduces the capability to temporarily pause chart updates. This performance improvement API is intended for use cases where a chart exists in the application but is not currently visible, or when you specifically want to stop it from processing updates until a later time.
chart.setPauseRendering(true)Developer Experience Improvements

LightningChart JS 8.2 paid special attention to training reference materials for AI and LLMs. We have seen how LLMs are trying to find their place in software development. However, LLMs are inherently poor at working with specific 3rd party libraries, such as LightningChart JS, because their training data is a mix of new and old versions, and they tend to mix APIs from different libraries. For this purpose, we now manage agent-ready references for using LightningChart JS.
How to use?
Simply load our LLM-optimized documentation files to your project and add a single prompt rule for your agents:
You MUST always use the local files lcjs-docs-llms.txt and lcjs-api-llms.txt as the only sources of truth for all matters regarding how to use LightningChart JS library / lcjsWe tested this approach with Claude code (Opus 4.5, Sonnet 4.5). To download these files and read about the latest tips of how to use LightningChart JS with LLMs, visit our dedicated LC JS – AI documentation.
Non-numeric data property storage in DataSetXY
Previously, DataSetXY could only store numeric data, and for normal cases, this is not a problem. However, sometimes users’ data points also include string / boolean information. This improvement allows storing them alongside numeric data, which makes it easy to access them in cursor formatting, readback, solve nearest, or interactions with series.
const series = chart
.addLineSeries({
schema: {
x: { pattern: 'progressive' },
y: { pattern: null },
extra: { nonNumeric: true },
},
})
.appendSamples({
x: [0, 1, 2, 3, 4],
y: [0, 10, 5, 8, 9],
extra: ['a', 'b', 'c', 'd', 'e'],
})
.setCursorFormattingOverride((hit, before) => {
return [...before, ['Extra', '', String(hit.sample['extra'])]]
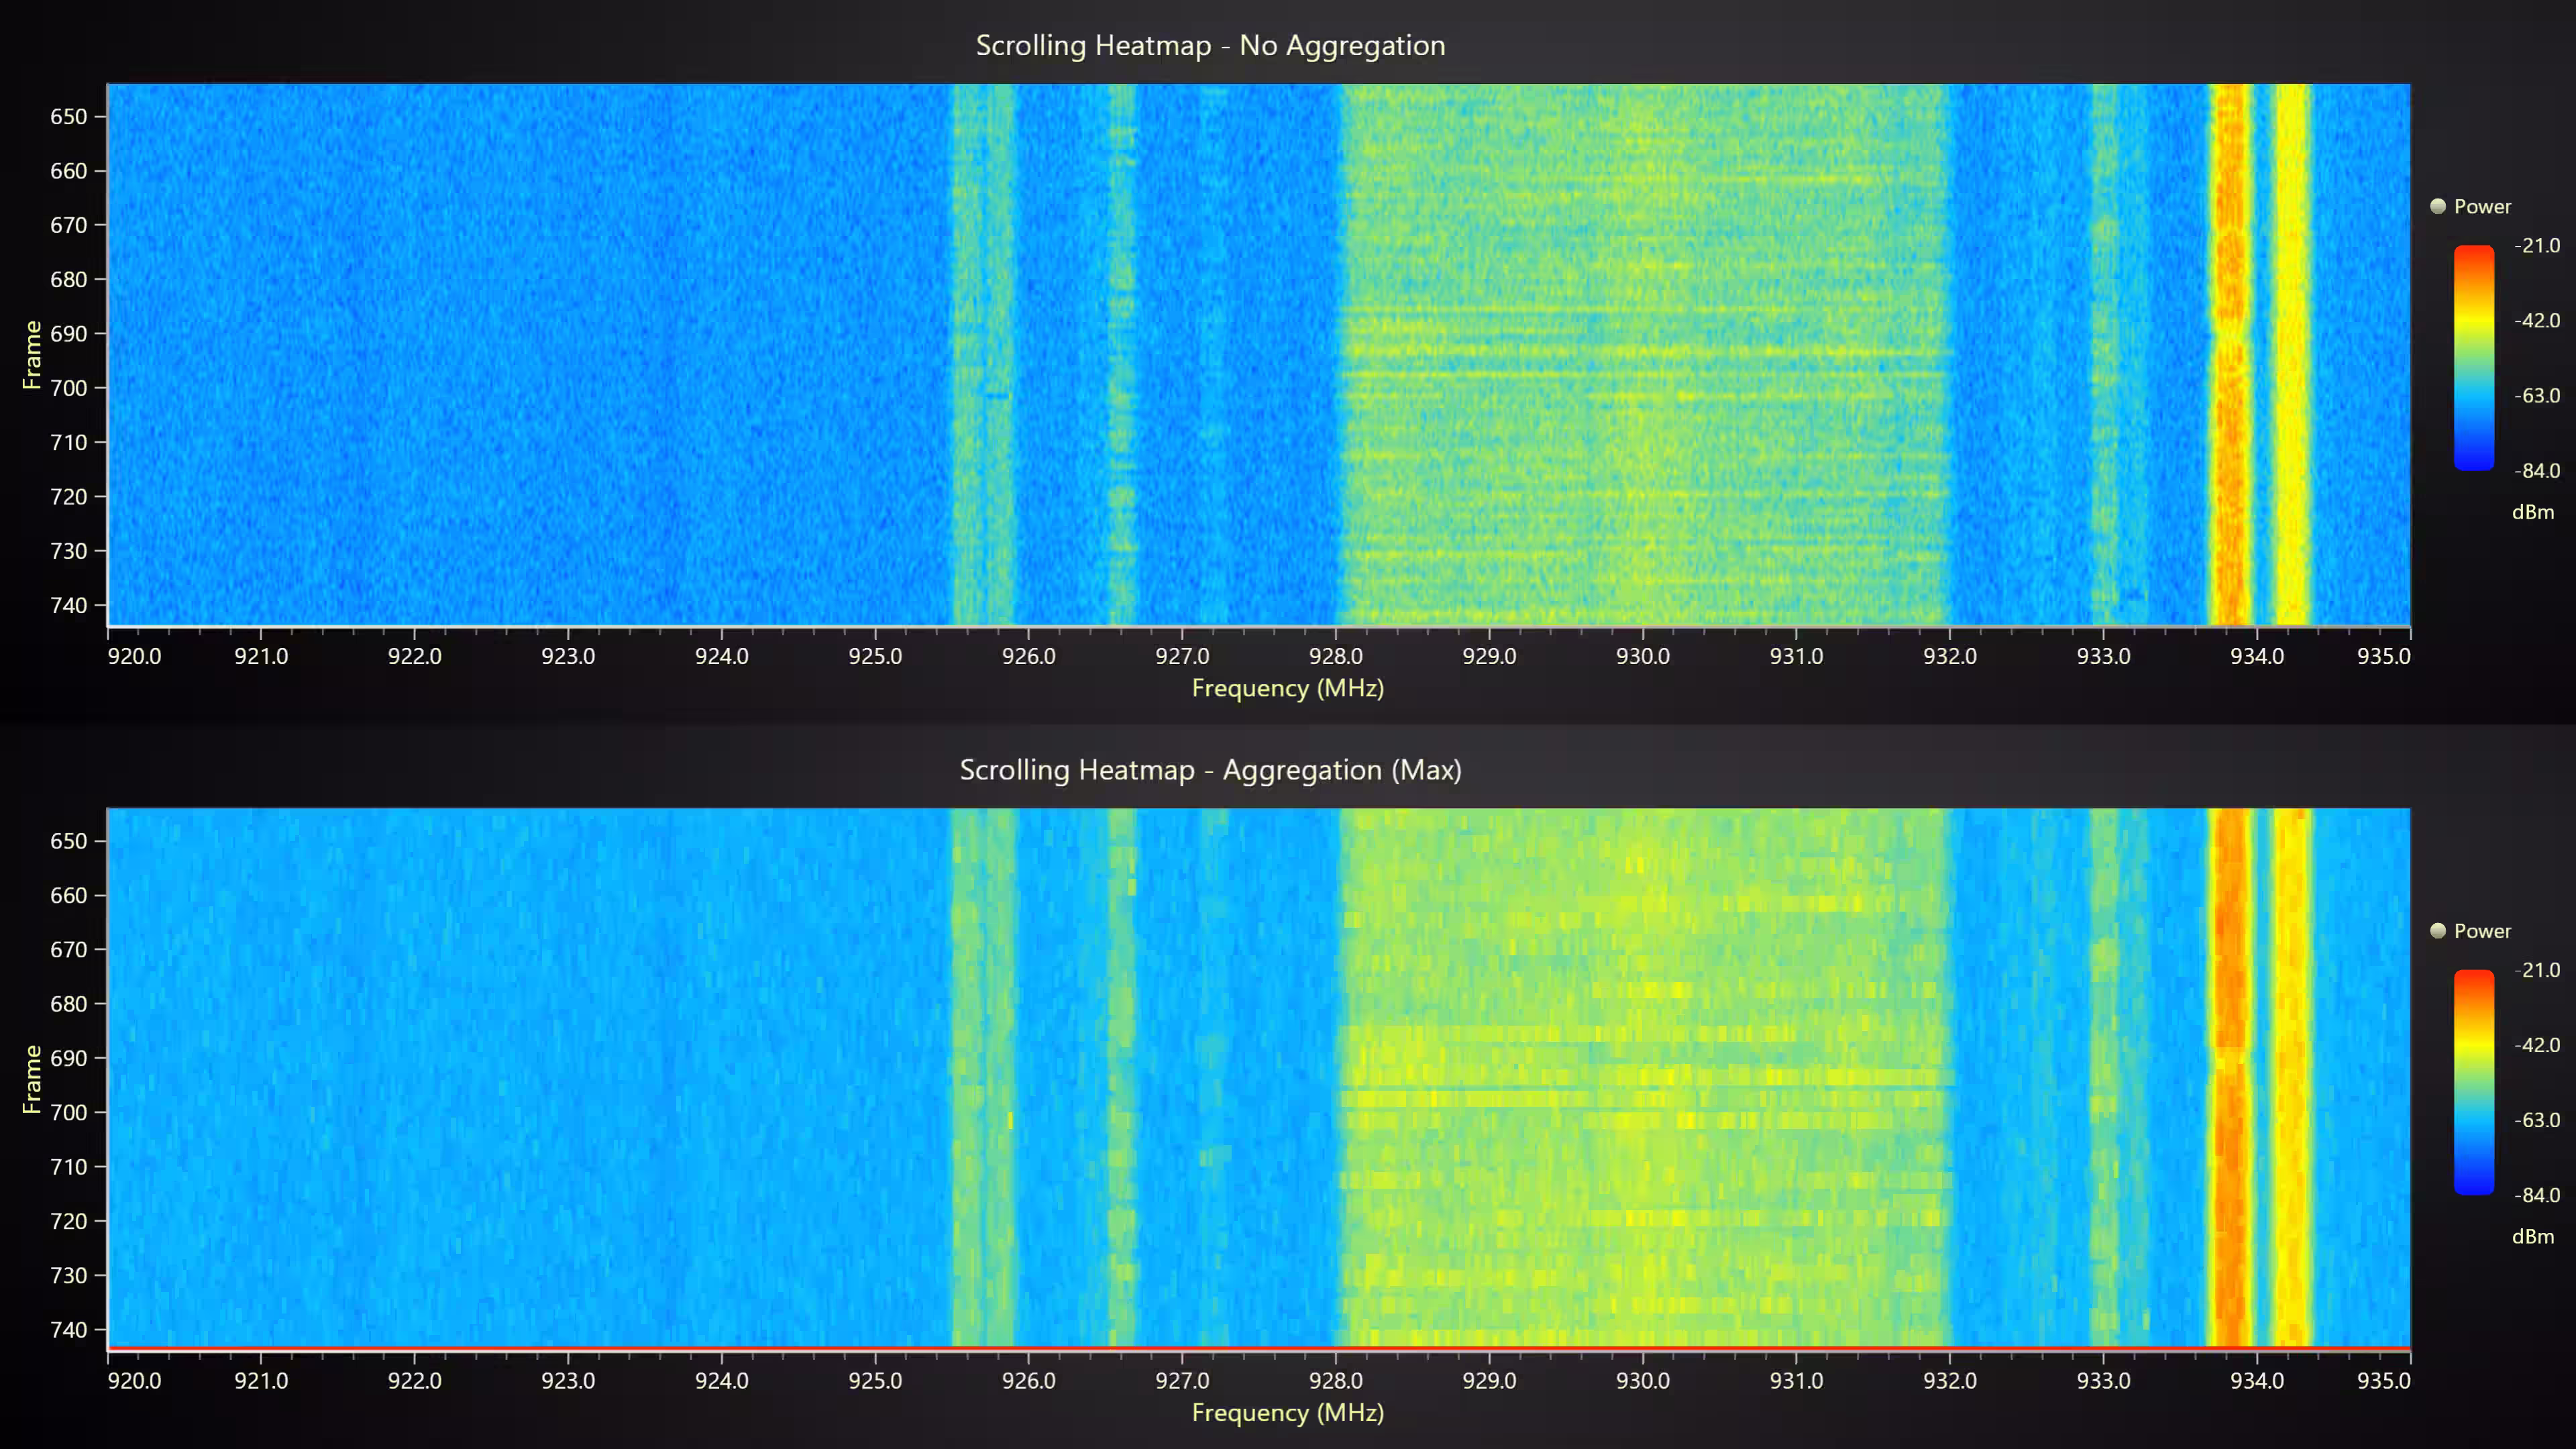
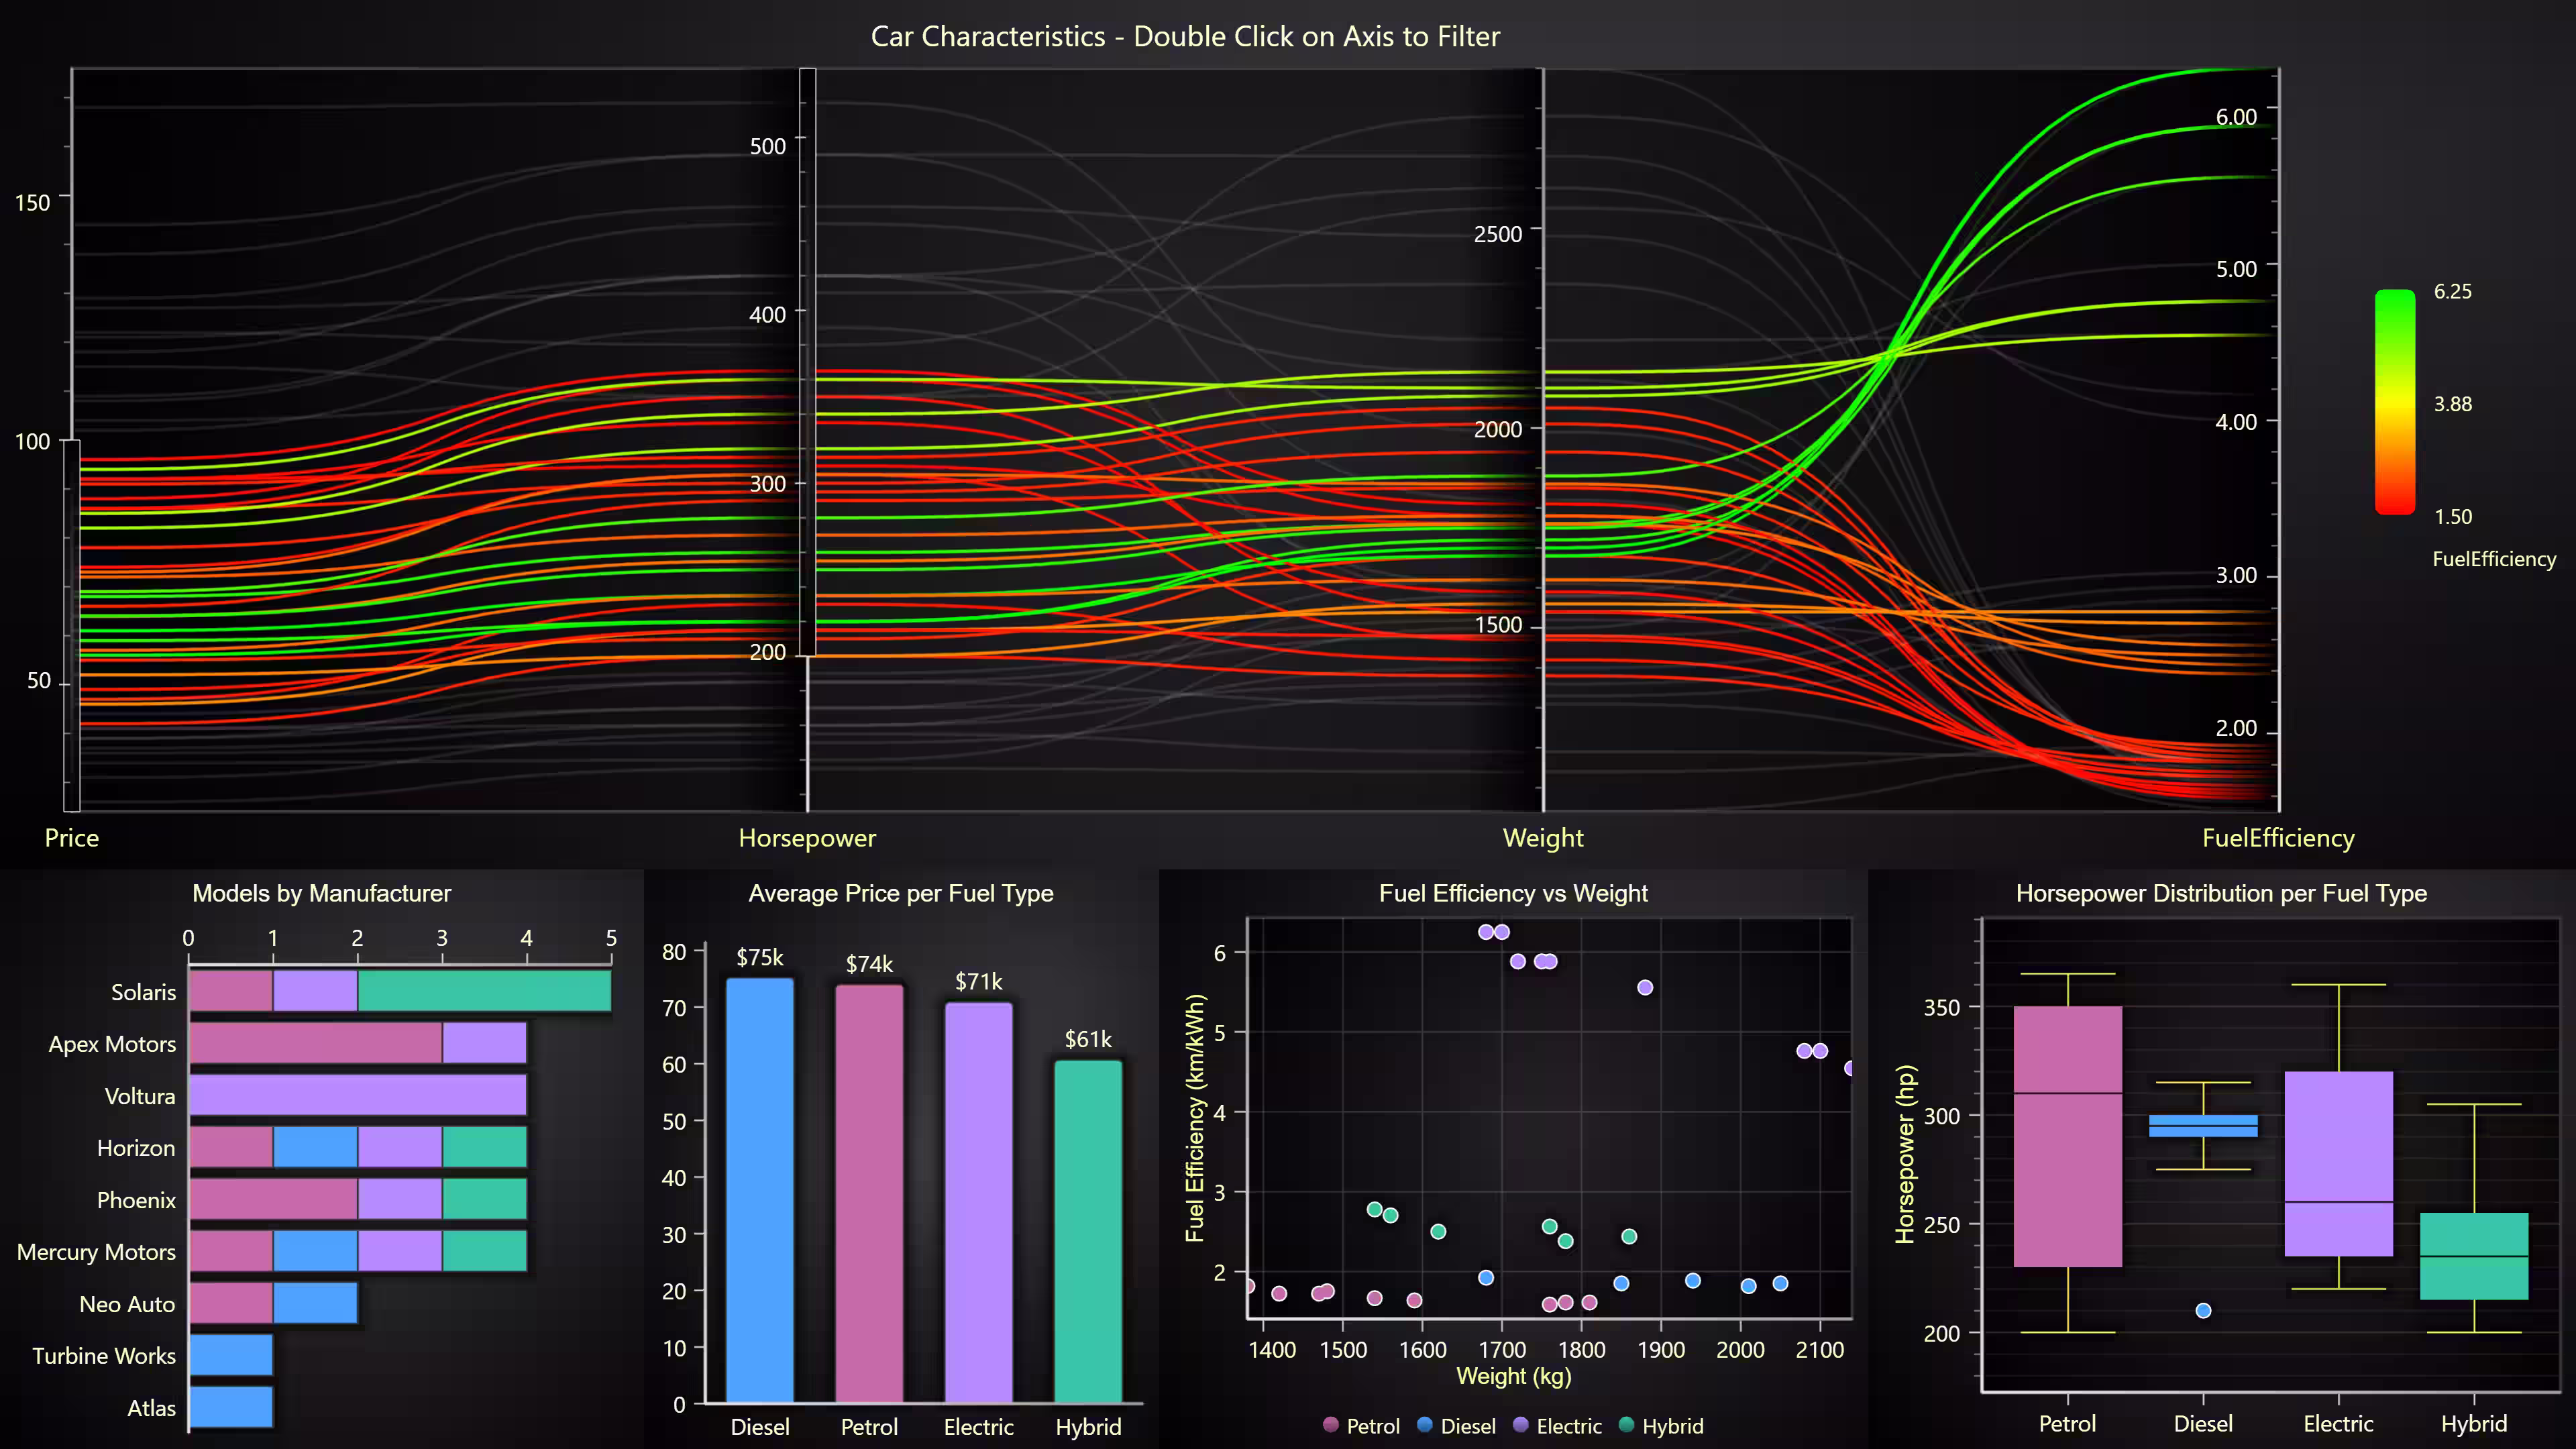
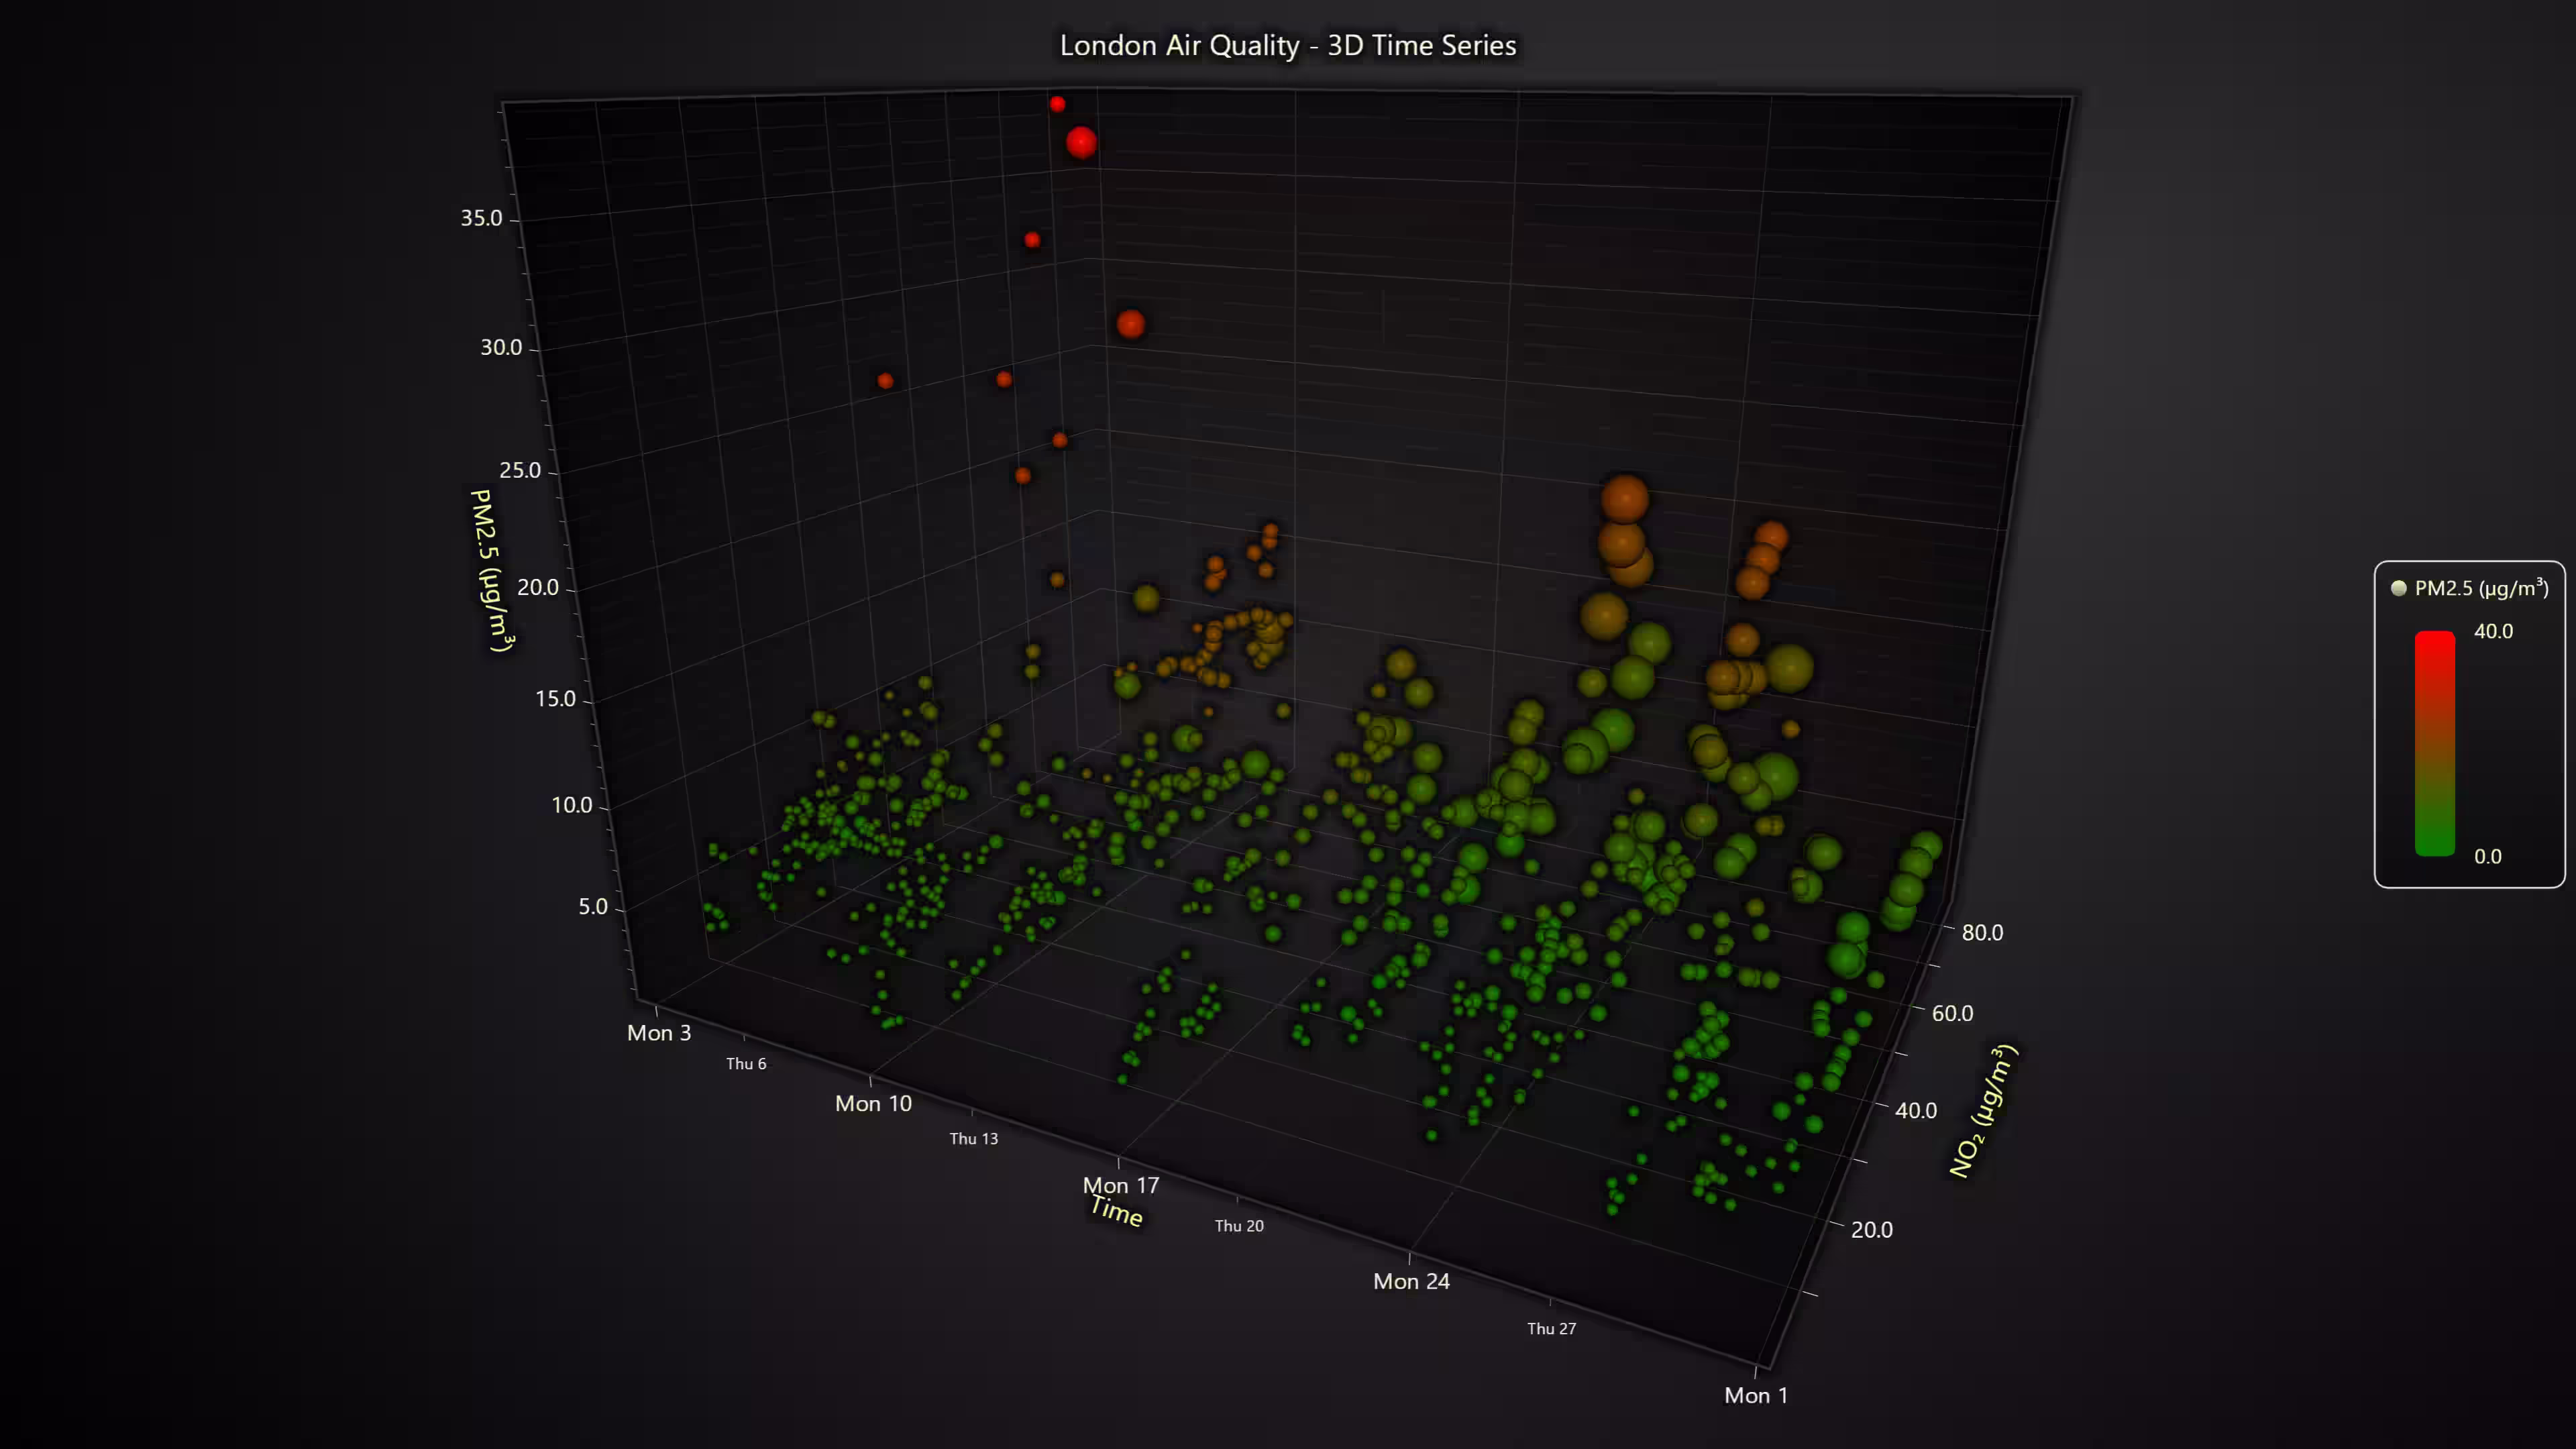
})New Chart Examples
This release introduces six new chart examples:
Get started with LightningChart JS v.8.2
To learn more about this release, visit the documentation.
See more news
Best DevExpress Charts Alternative in 2026: GPU Performance for Web and Desktop
DevExpress is one of the most comprehensive UI component suites in the .NET and web ecosystem. WinForms, WPF, ASP.NET, Blazor, JavaScript it covers the full Microsoft-aligned development stack with grids, schedulers, form components, reporting, and charting all...
Best Chart.js Alternatives in 2026: When You’ve Outgrown the Basics
Chart.js is the correct answer for a lot of chart projects. MIT license with no commercial restrictions, ~14KB gzipped, documentation that is genuinely among the best in the ecosystem, 65,000+ GitHub stars, and the largest community of any JavaScript chart library by...
Best AnyChart Alternatives in 2026: GPU Performance, Transparent Pricing, Free Trials
AnyChart is a commercially-oriented JavaScript charting library that markets itself on enterprise reliability, used by over 75% of Fortune 500 companies per their own claims, with a broad catalog of 70+ chart types covering Gantt, maps, stock charts, and more. The...
LightningChart Python Trader v1.2
Announcing LightningChart Python Trader v1.2 New Product Features LightningChart Python Trader V1.2 introduces a couple of new technical indicators and drawing tools. Furthermore, several user-requested features and improvements have been added to the library. New...


If you have any questions, feel free to contact us!
©LightningChart Ltd 2026. All rights reserved.