



LightningChart Python Trader is out now!
The most complete Python library for visualizing financial data.
What is LightningChart Python Trader?
LightingChart Python Trader is today’s most complete Python library for visualizing financial data. Version 1.0 delivers unmatched technical analysis features, flexible dashboard layouts, extensive customization options, downloadable examples, and programmatic access to chart data. LightningChart Python Trader significantly reduces development time while enabling advanced financial and trading use cases.
Features
In this section, you can read more about the latest features introduced in version 1.0. You may also refer to the documentation for implementation guidance.
Technical Indicators
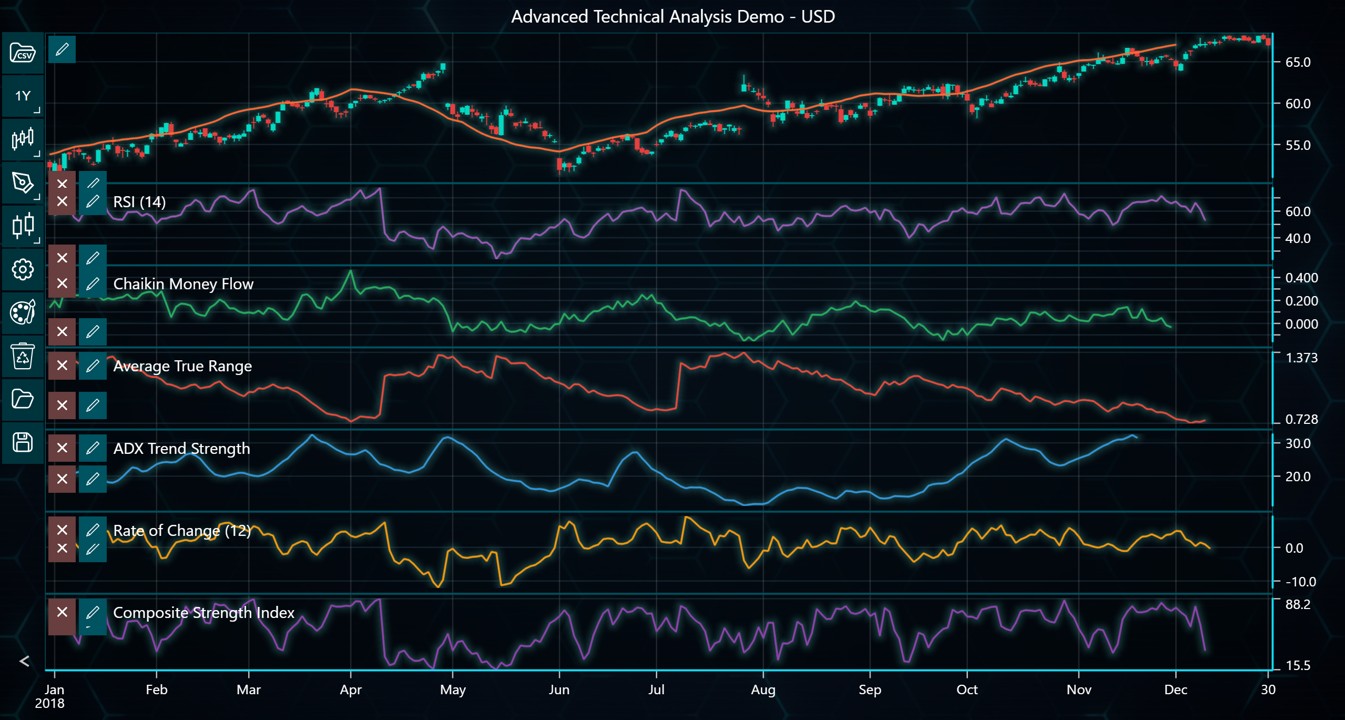
LightningChart Python Trader features more than 100 technical indicators. Some of the technical indicator types included are:
- Envelopes: Bollinger Band, Donchian Channels, Fractal Chaos Bands…
- Moving Averages: EMA, SMA, TMA…
- Oscillators – Money Flow: A/D, Chaikin Money Flow, Ease of Movement…
- Oscillators – Price: Aroon Oscillator, Awesome Oscillator, Balance of Power…
- Statistics: Correlation coefficient, Kurtosis, Median Price…
- Trend Indicators: ASI, ADX, Aroon
- Volatility: Average True Range, Chaikin Volatility, Z-Value…
Dashboards
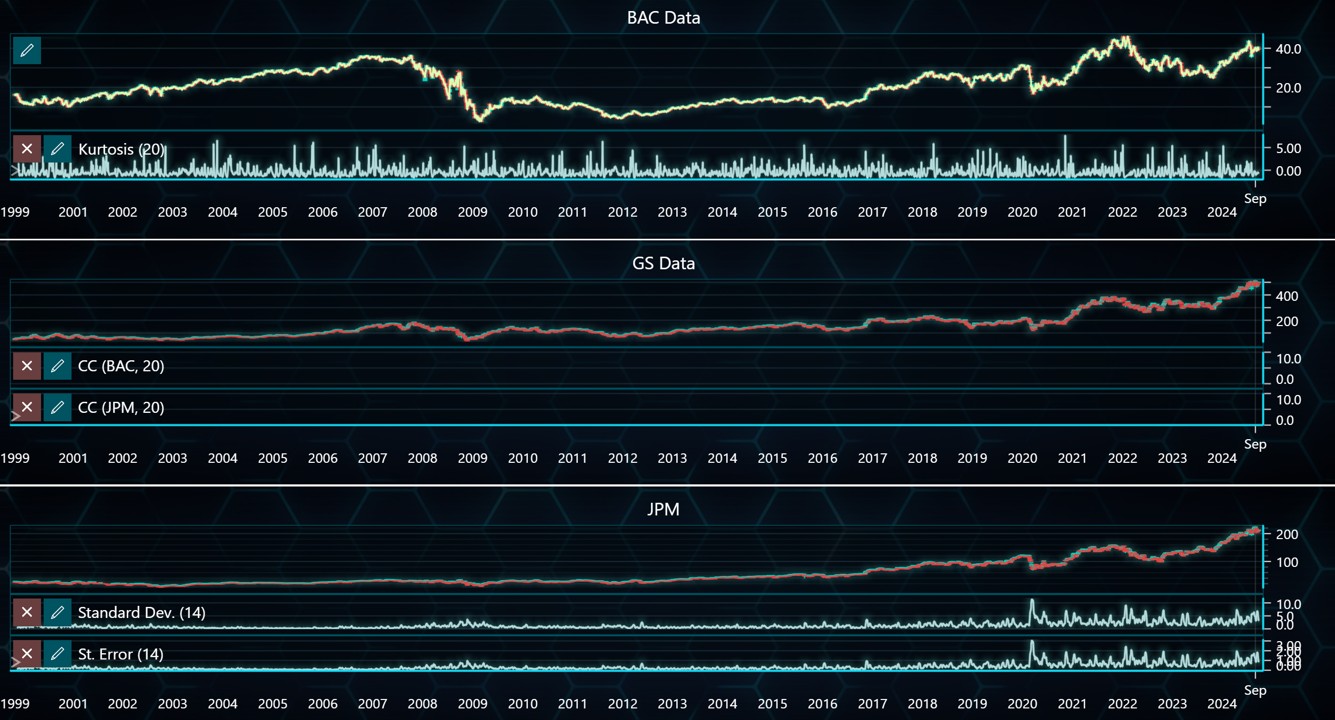
LightningChart Python Trader introduces the dashboard feature, allowing users to add multiple charts in fully customizable layouts. It is possible to create custom workspaces with different chart types, timeframes, and indicators in the same view.
Technical Analysis Chart (TAChart) Constructor
When creating a new chart, it is possible to define values for theme, load_from_store, axis position, and HTML text rendering. There are also helper methods available, including set_dat, add_data_array, and load_csv, now supporting unsorted datasets.
trader = TAChart(
    license_key,
    html_text_rendering=True,
    load_from_storage=False,
    theme='turquoiseHexagon',
    axis_on_right=True
)
Data Retrieval Methods
A new set of helper methods (named like get_*) lets users easily access things like chart data, buttons and inputs, symbol tables, time settings, and volume info—all through code. This means you can now fully control and analyze charts automatically, or build your custom user interfaces using this data.
Menu Options Control
LightningChart Python introduces 41 new menu_options()to show/hide UI elements. This is helpful to build custom data visualization interfaces and simpler experiences.
menu = trader.menu_options()

menu.show_chart_title_input(False)
menu.show_currency_input(False)
menu.show_watermark_text_input(False)
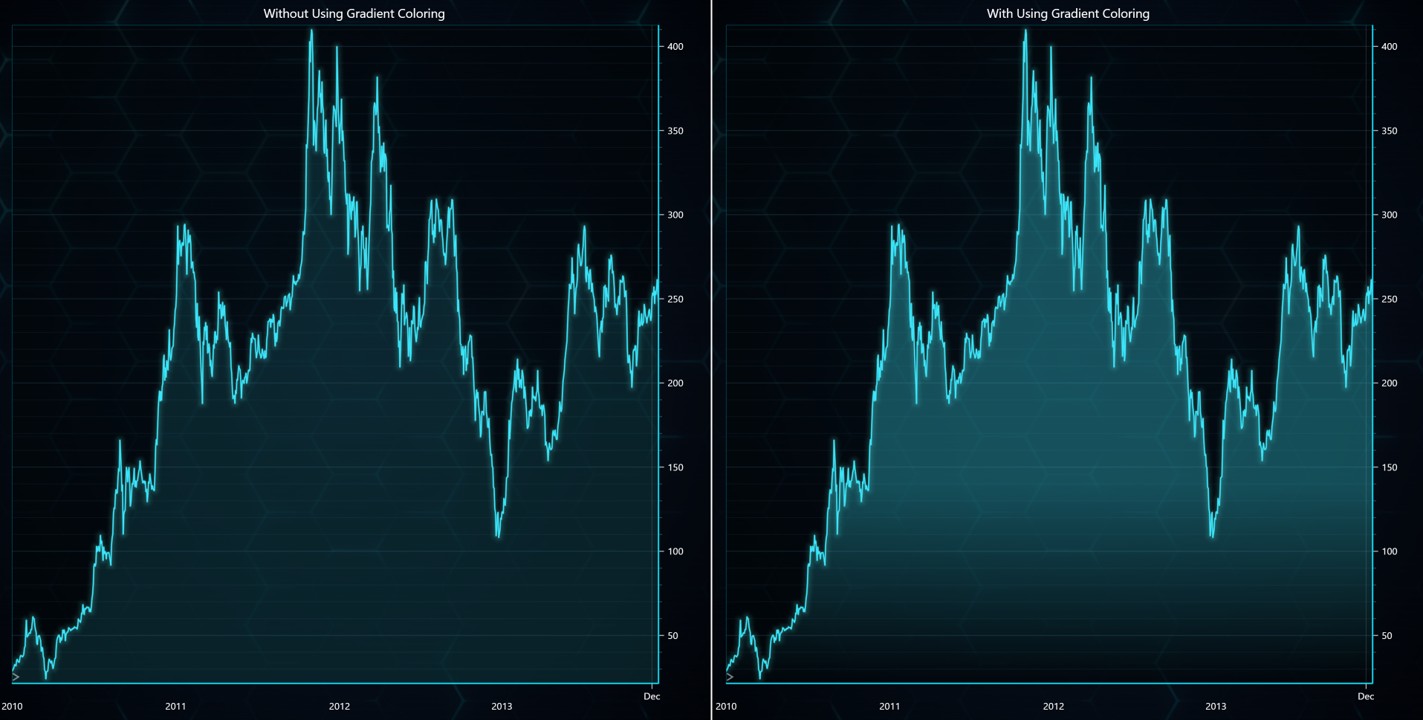
Mountain Gradients
LightningChart Python 1.0 introduces better gradient options to different chart types including mountain charts.
Explore the LightningChart Python Trader
Getting started with LightningChart Python Trader is easy. We’ve compiled a comprehensive documentation and 26+ examples that can be easily downloaded as ZIP files (requires a license key to run) to help you get started visualizing financial data in Python.
See more news
LightningChart .NET v.12.6.1
LightningChart .NET v.12.6.1 is out now!Features of LightningChart® .NET version 12.6.1In this release we added new features, made several improvements and fixed dozens of errors. We upgraded target framework (from .NET 8.0 to 10.0), added Universal-Data-Parser...
Trend Lines in Trading
Trend lines are among the simplest yet most powerful tools in technical analysis. They help traders visualize market direction, identify potential support and resistance levels, and make more informed trading decisions. Despite their simplicity, trend lines remain a...
Announcement: Baumer as LightningChart customer
Enabling High-Performance Visualization of Industrial Sensor Data with LightningChartDiscover how Baumer uses LightningChart to configure and visualize data from a wide variety of industrial sensors and create responsive, data-rich visualization...
Best Python Charting Library in 2026
Python's charting ecosystem is large, overlapping, and regularly misunderstood. Most comparison guides stop at Matplotlib, Plotly, and Seaborn. This one goes further: it covers what happens when your datasets grow large, your update rates increase, or your chart types...



If you have any questions, feel free to contact us!



©LightningChart Ltd 2026. All rights reserved.





