v1.2.0
Zoom Band Chart
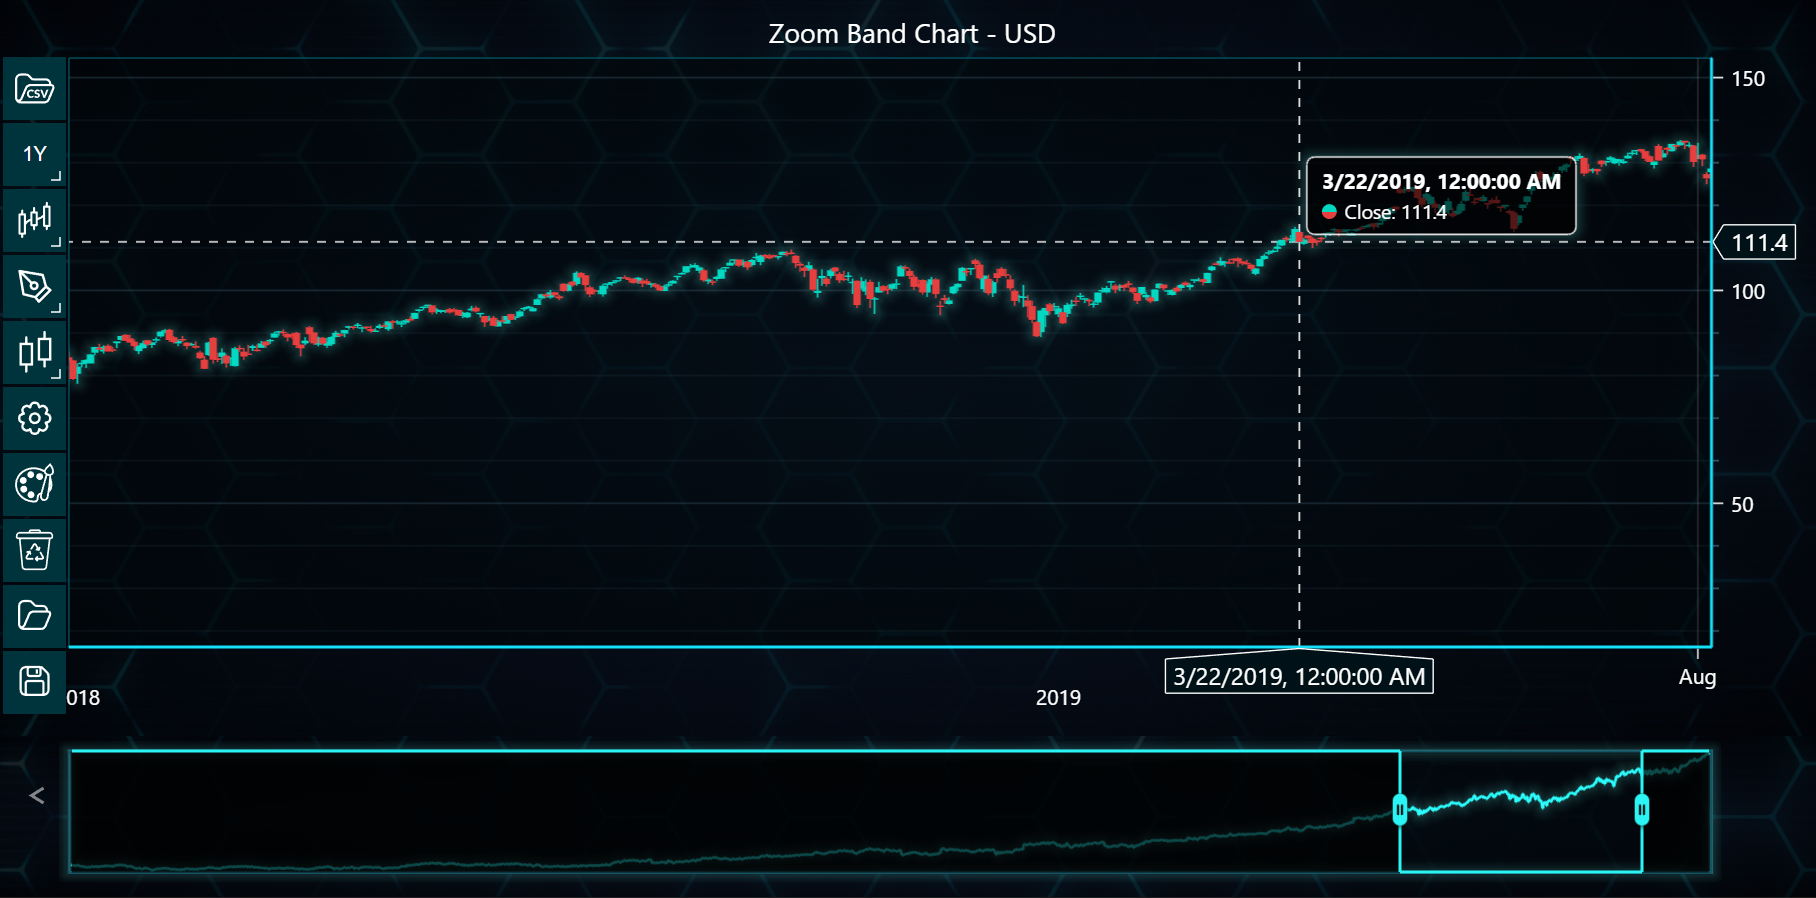
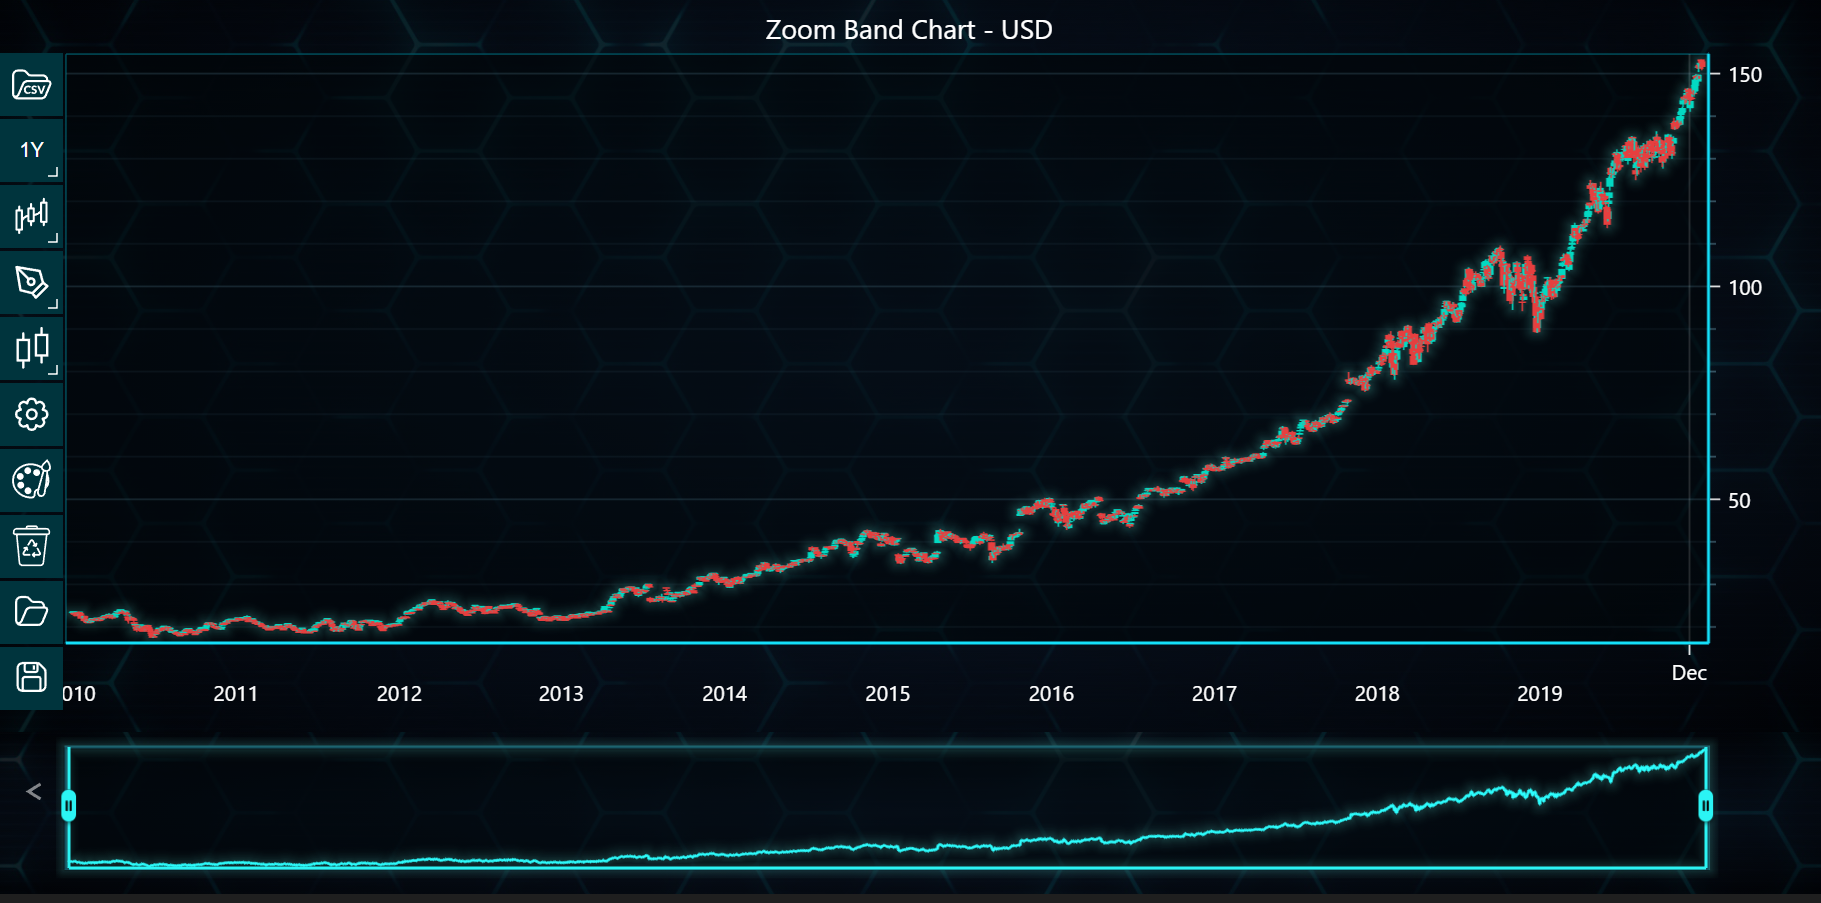
In the example below, you will see how to create a Zoom Band Chart using the LightningChart Python Trader. Full code and dataset are provided at the bottom of the page.
from datetime import datetime, timedelta
from lightningchart_trader import TAChart

LICENSE_KEY_PATH = "license_key.txt"
DATA_PATH = "Microsoft Corporation (MSFT).csv"

# Load the license key
license_key = open(LICENSE_KEY_PATH).read()

chart = TAChart(license_key)
chart.set_chart_title("Zoom Band Chart")

# Create a trading chart with custom settings
trading_chart = chart.set_color_theme('turquoiseHexagon')

# Enable zoom band chart
trading_chart.show_zoom_band_chart(True)

# Set custom time range (last 18 months)
end_time = datetime.now()
start_time = end_time - timedelta(days=18 * 30)  # Approximation of 18 months

# Load data from CSV file
trading_chart.load_csv(DATA_PATH)

# Set currency to USD
trading_chart.set_currency('USD')

# Open the chart
chart.open()
After changing the zoom range: