v1.2.0
Envelope indicators
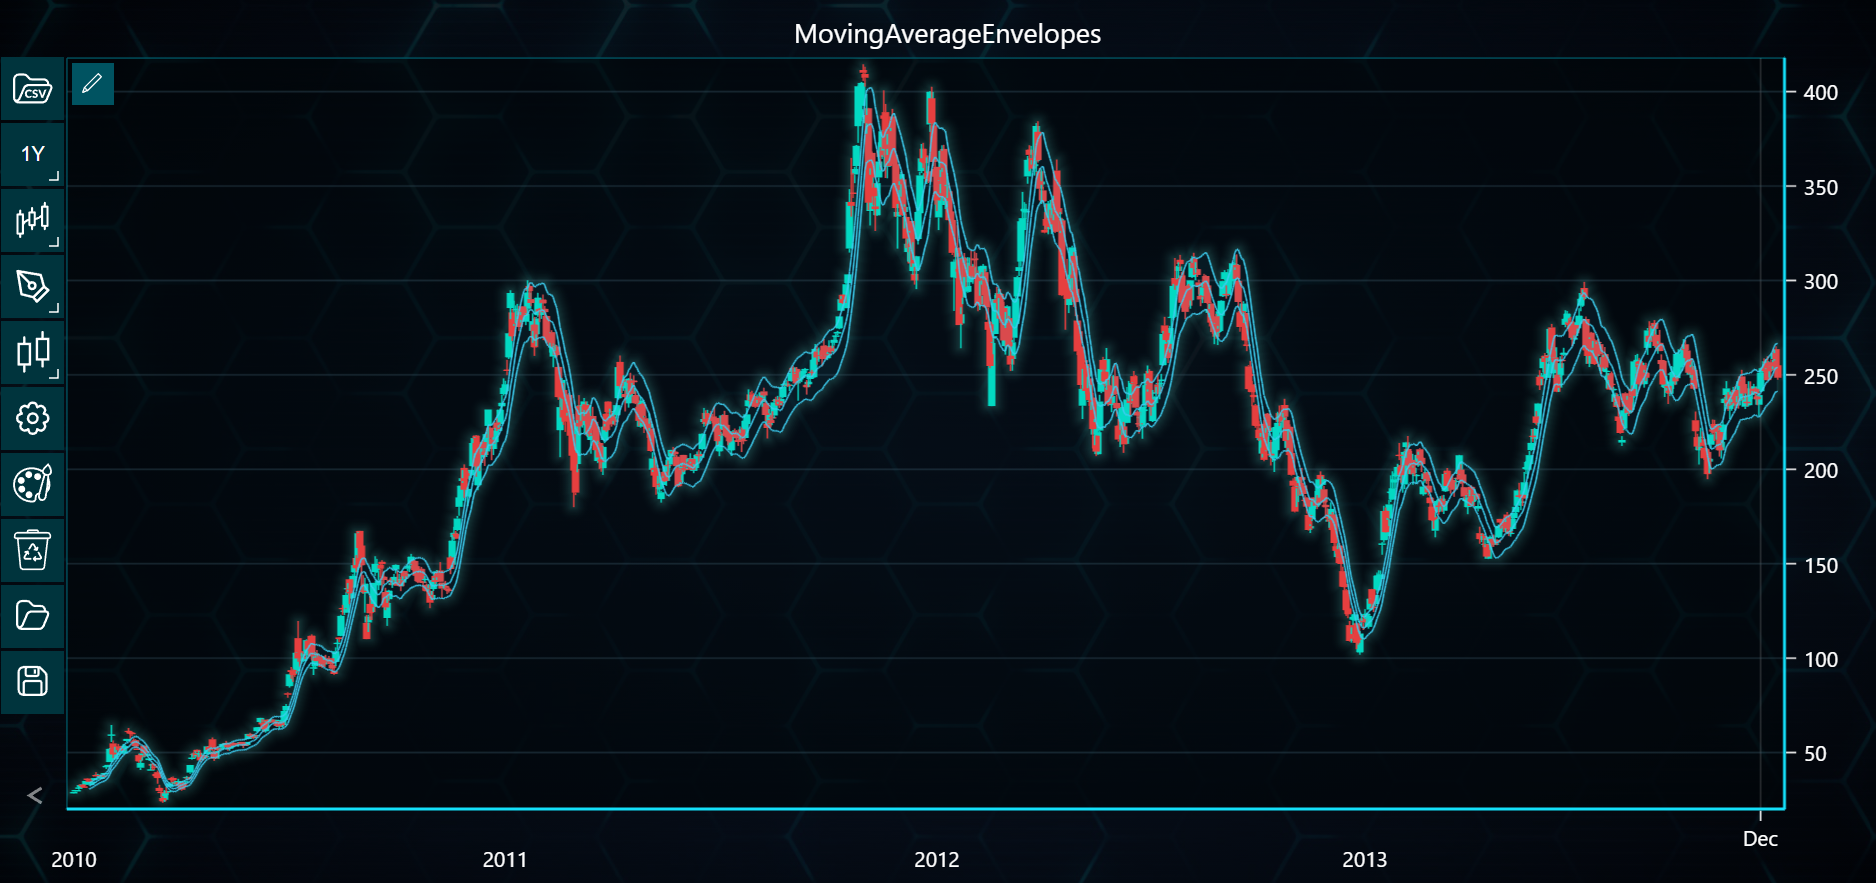
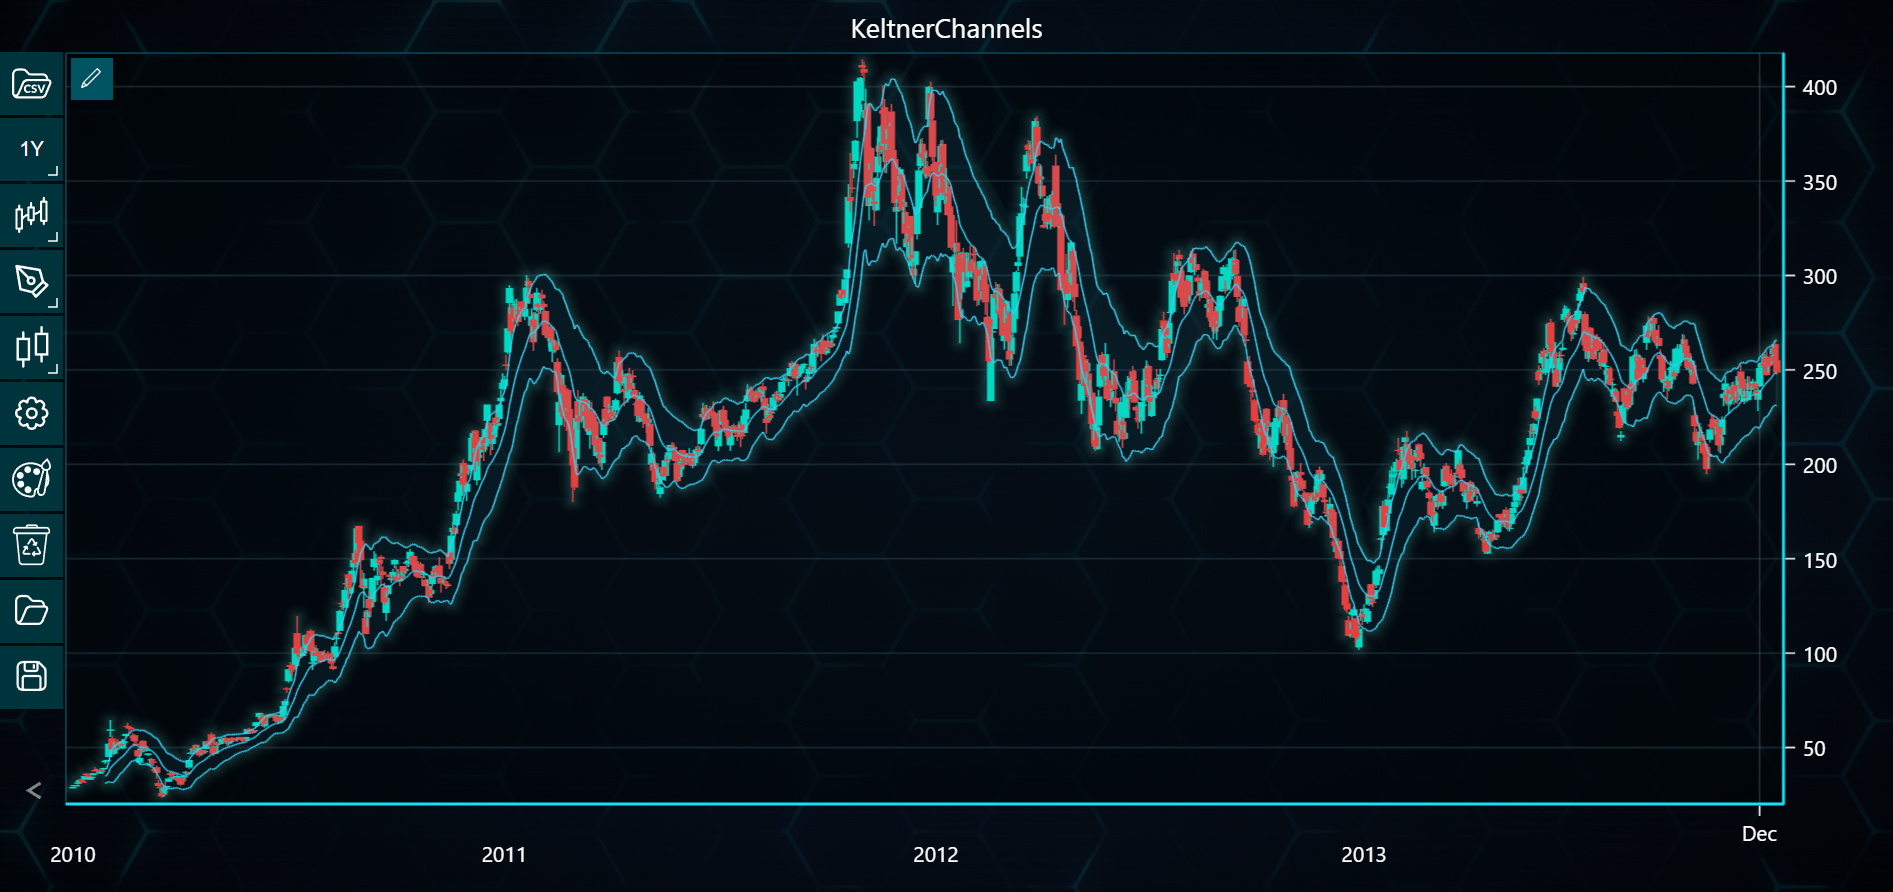
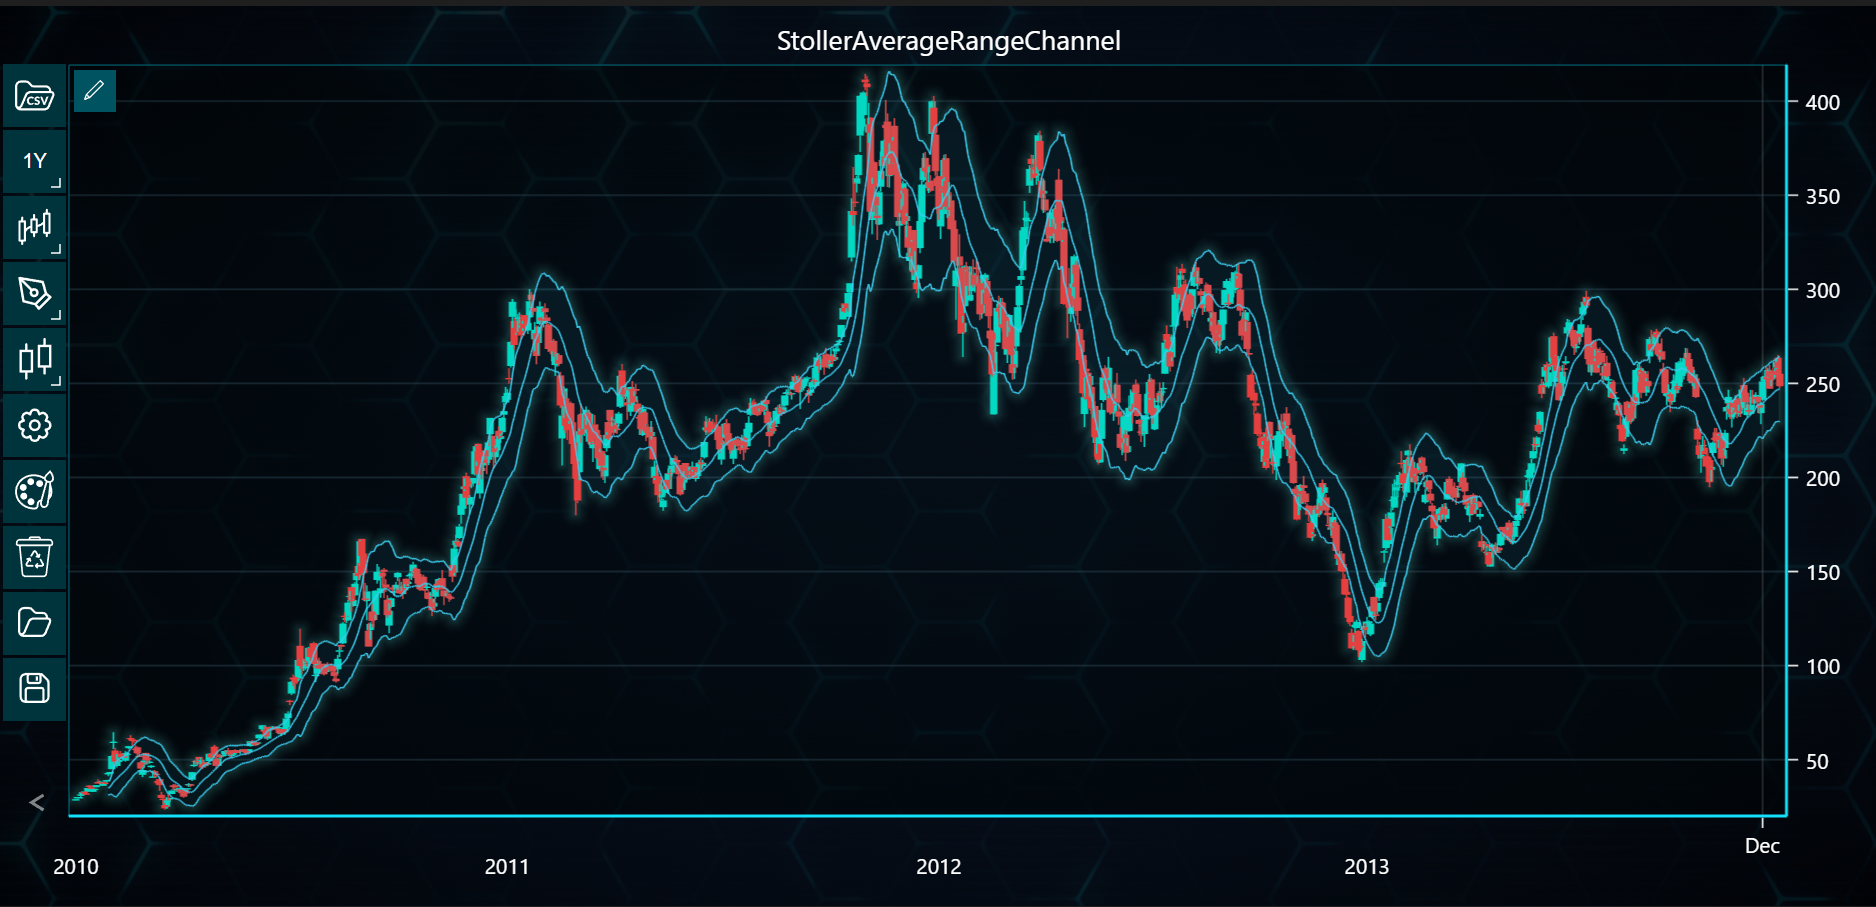
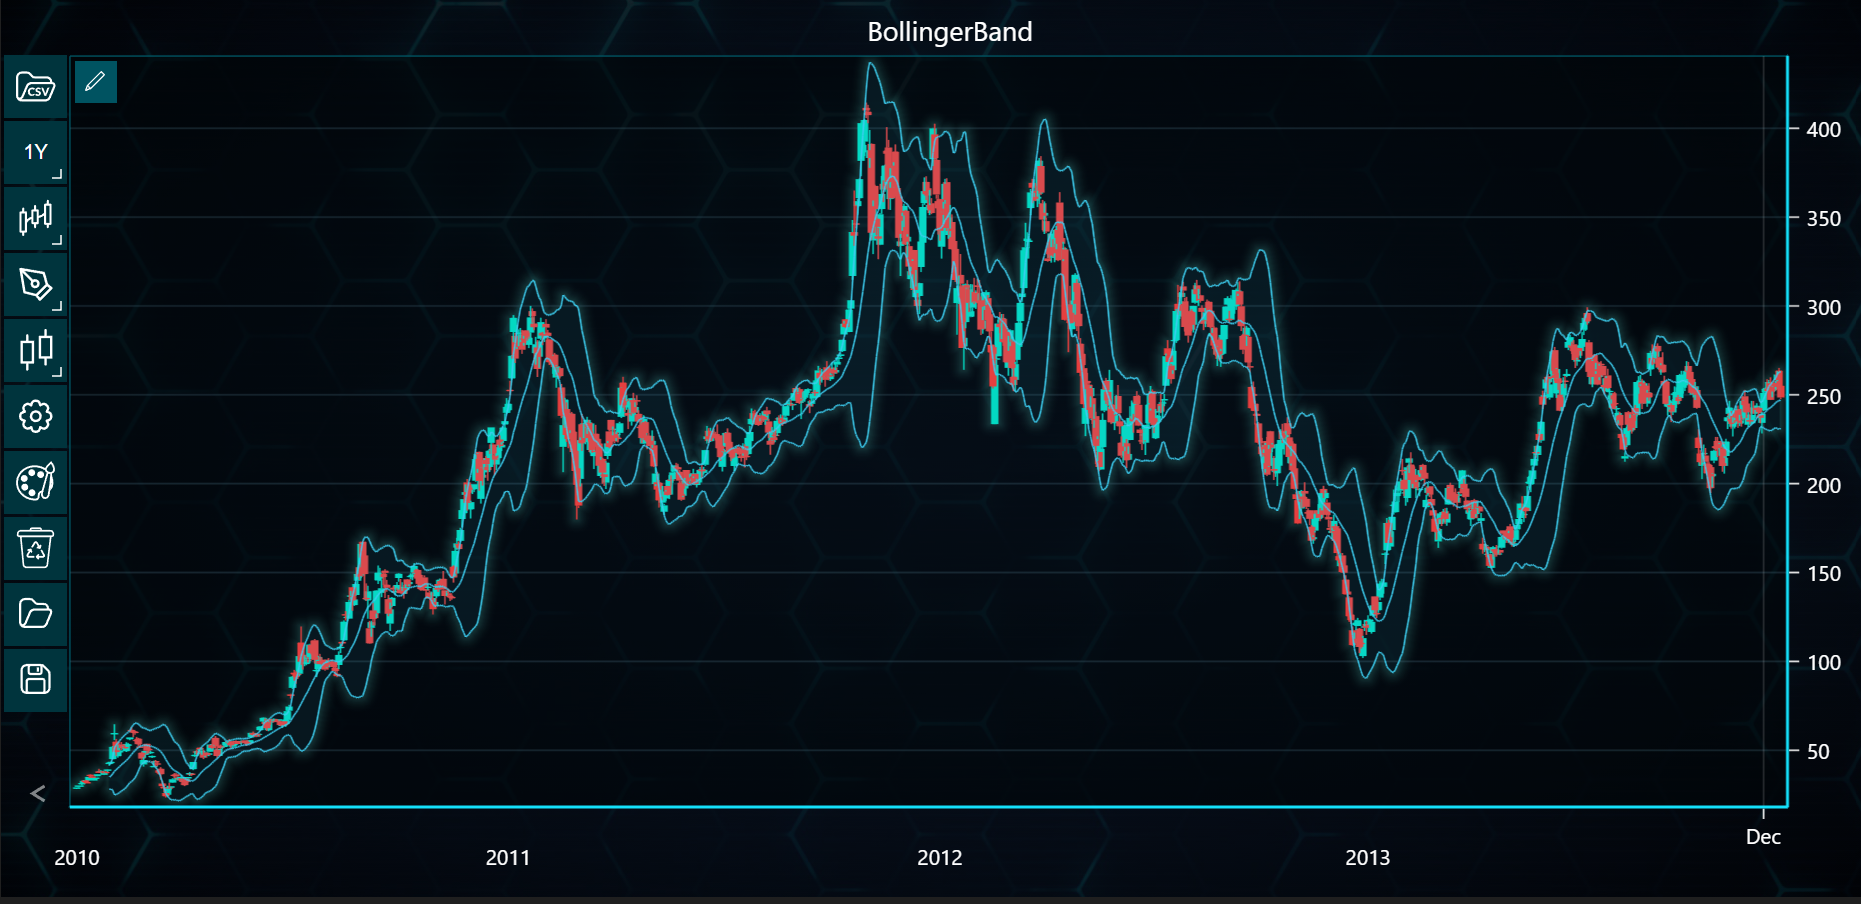
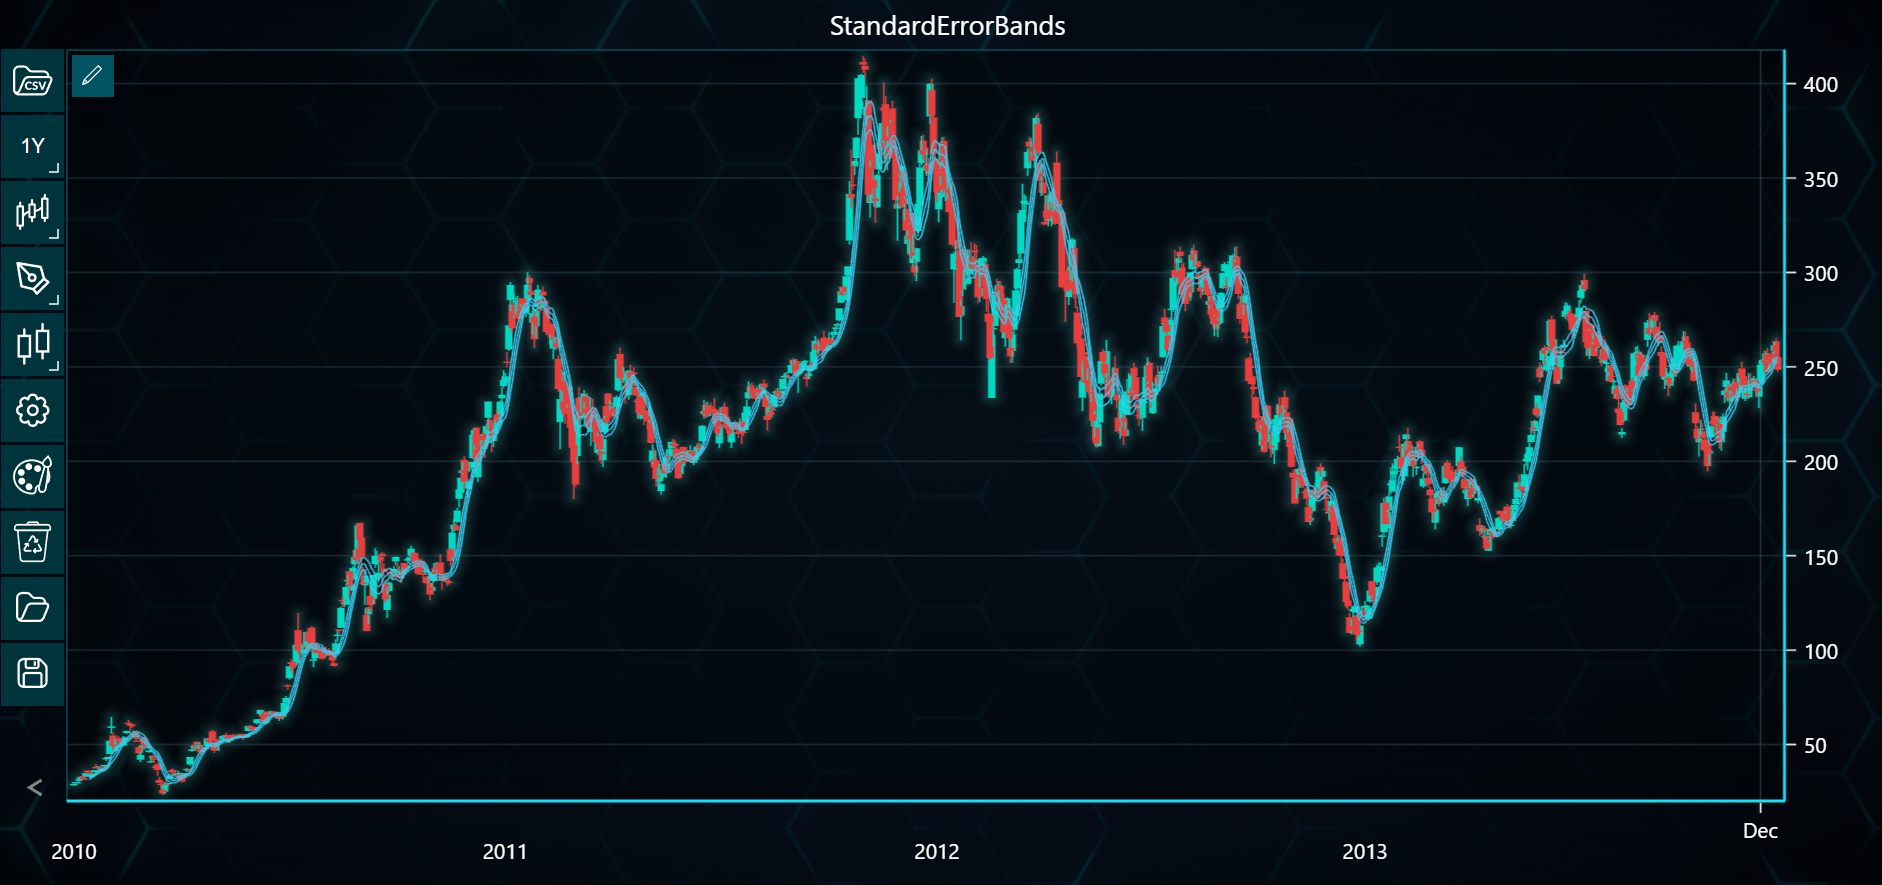
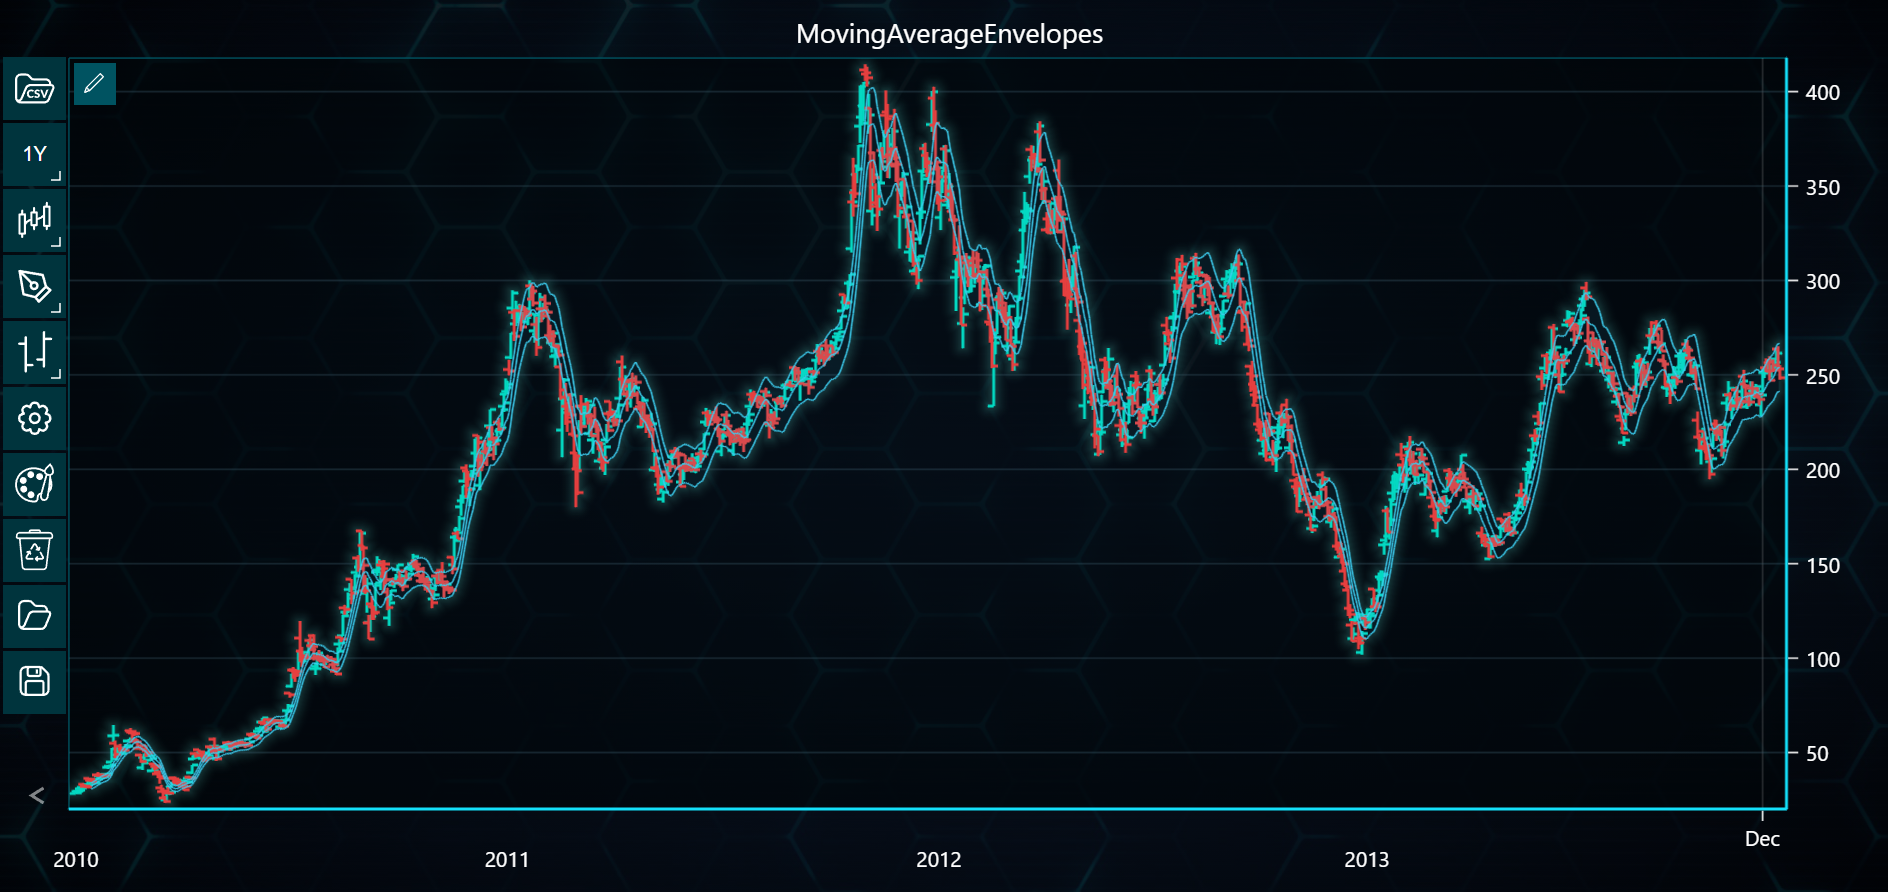
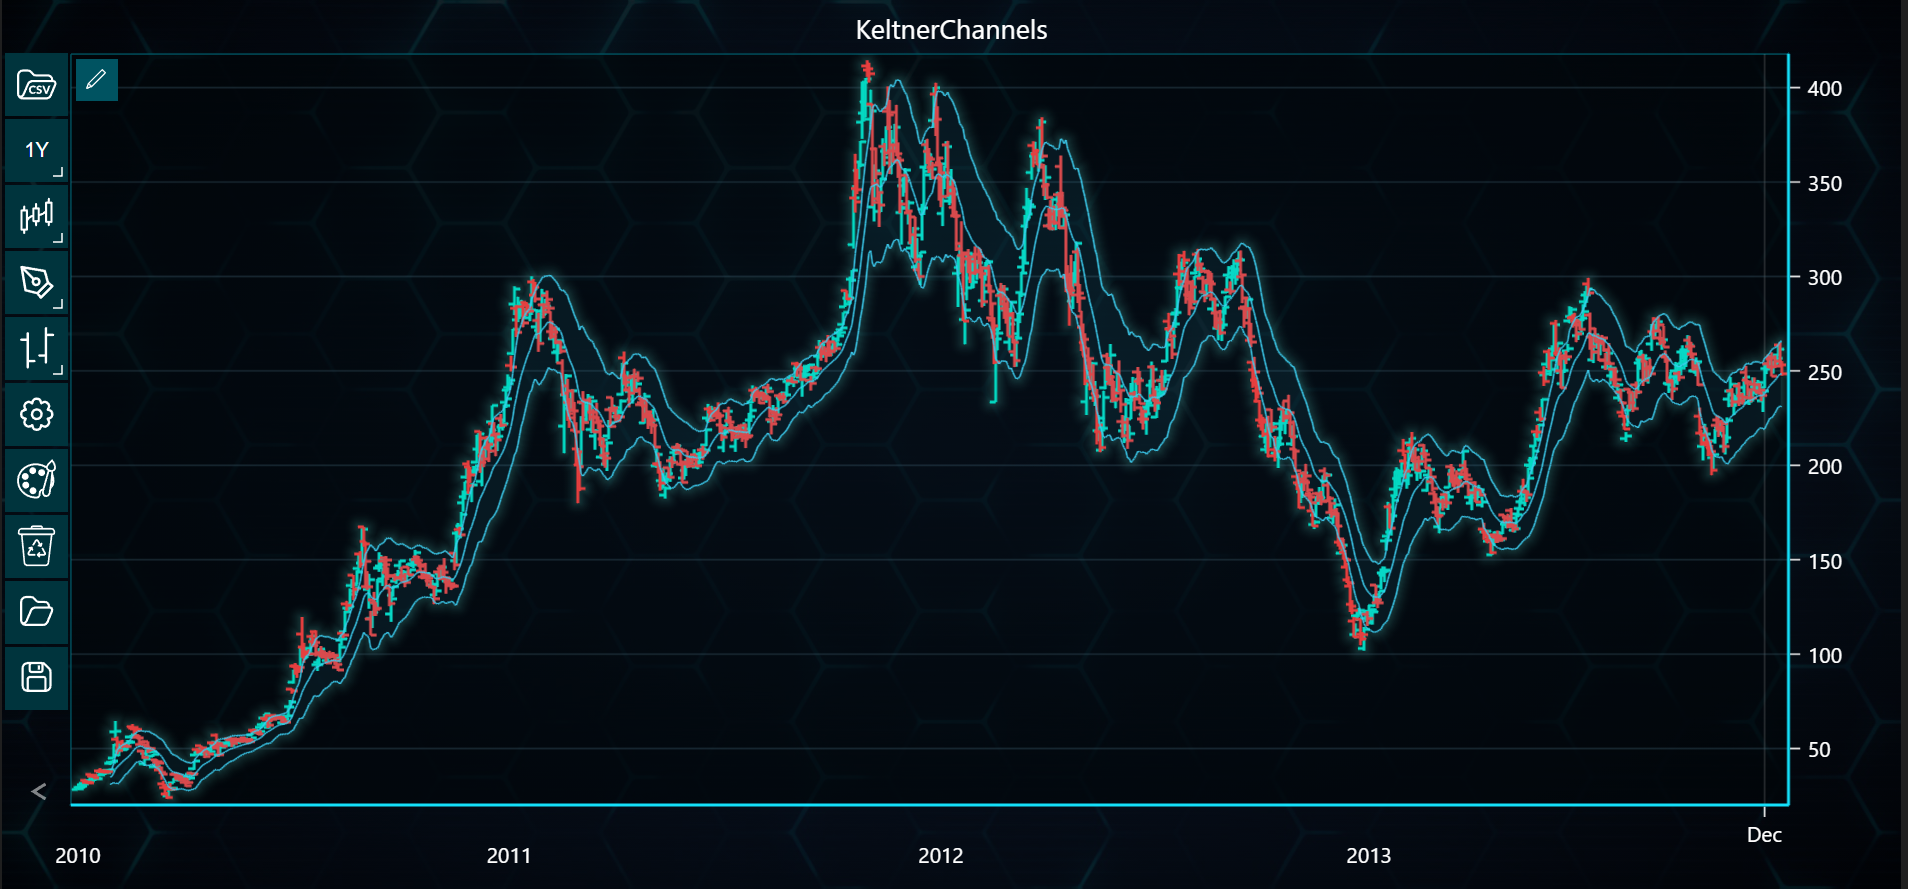
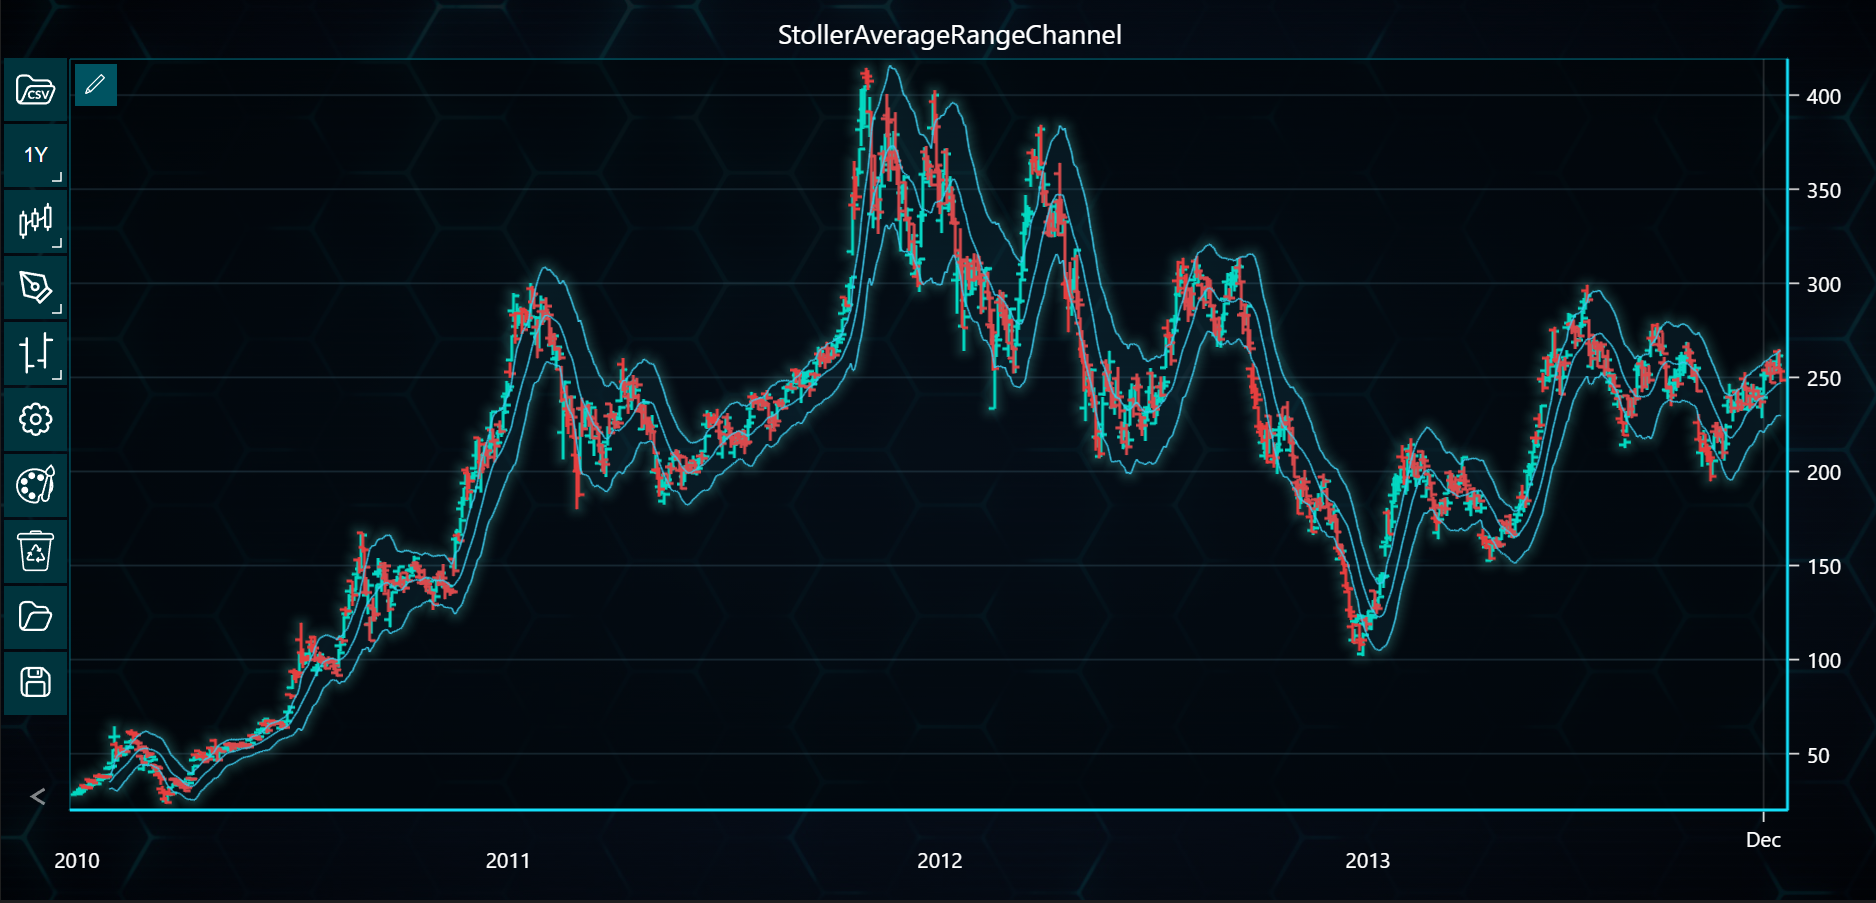
This guide demonstrates how to create and visualize nine types of envelope indicators (e.g., Bollinger Bands, Keltner Channels) using both Bar and CandleStick charts in LightningChart Python Trader. Full code and dataset are provided at the bottom of the page.
Using Bar Chart
from lightningchart_trader import TAChart
LICENSE_KEY_PATH = "license_key.txt"
DATA_PATH = "Tesla.csv"
# Load the license key
license_key = open(LICENSE_KEY_PATH).read()
# List of envelope indicators to chartly
envelope_indicators = [
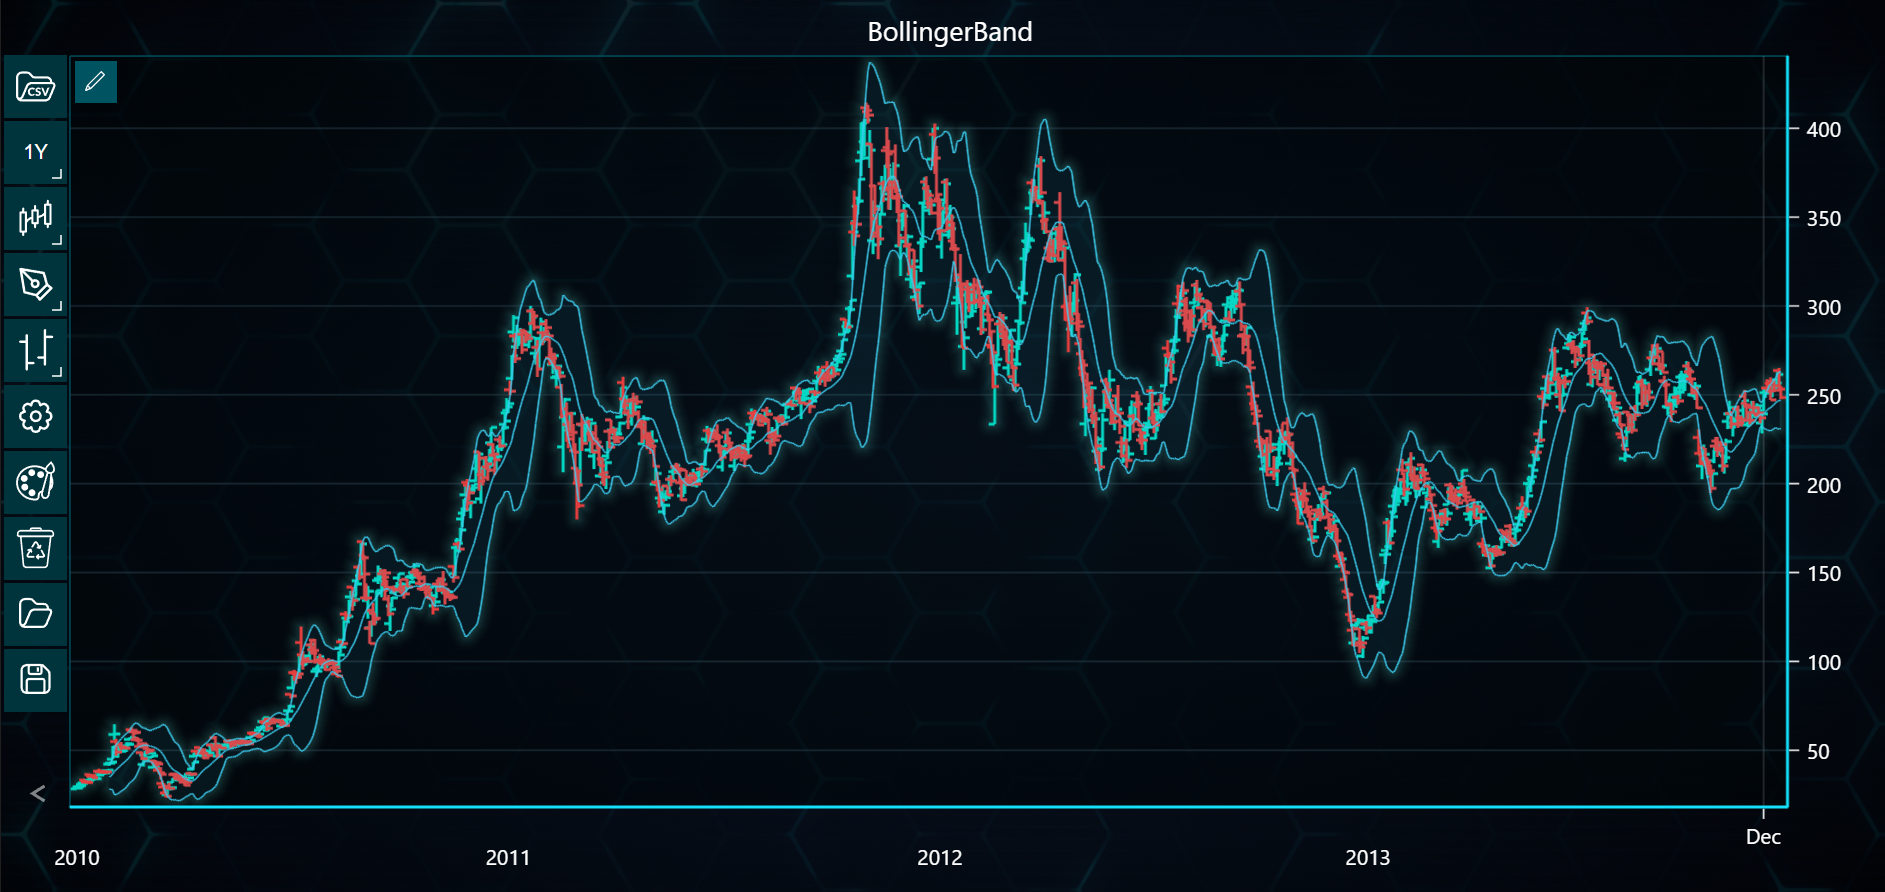
'BollingerBand',
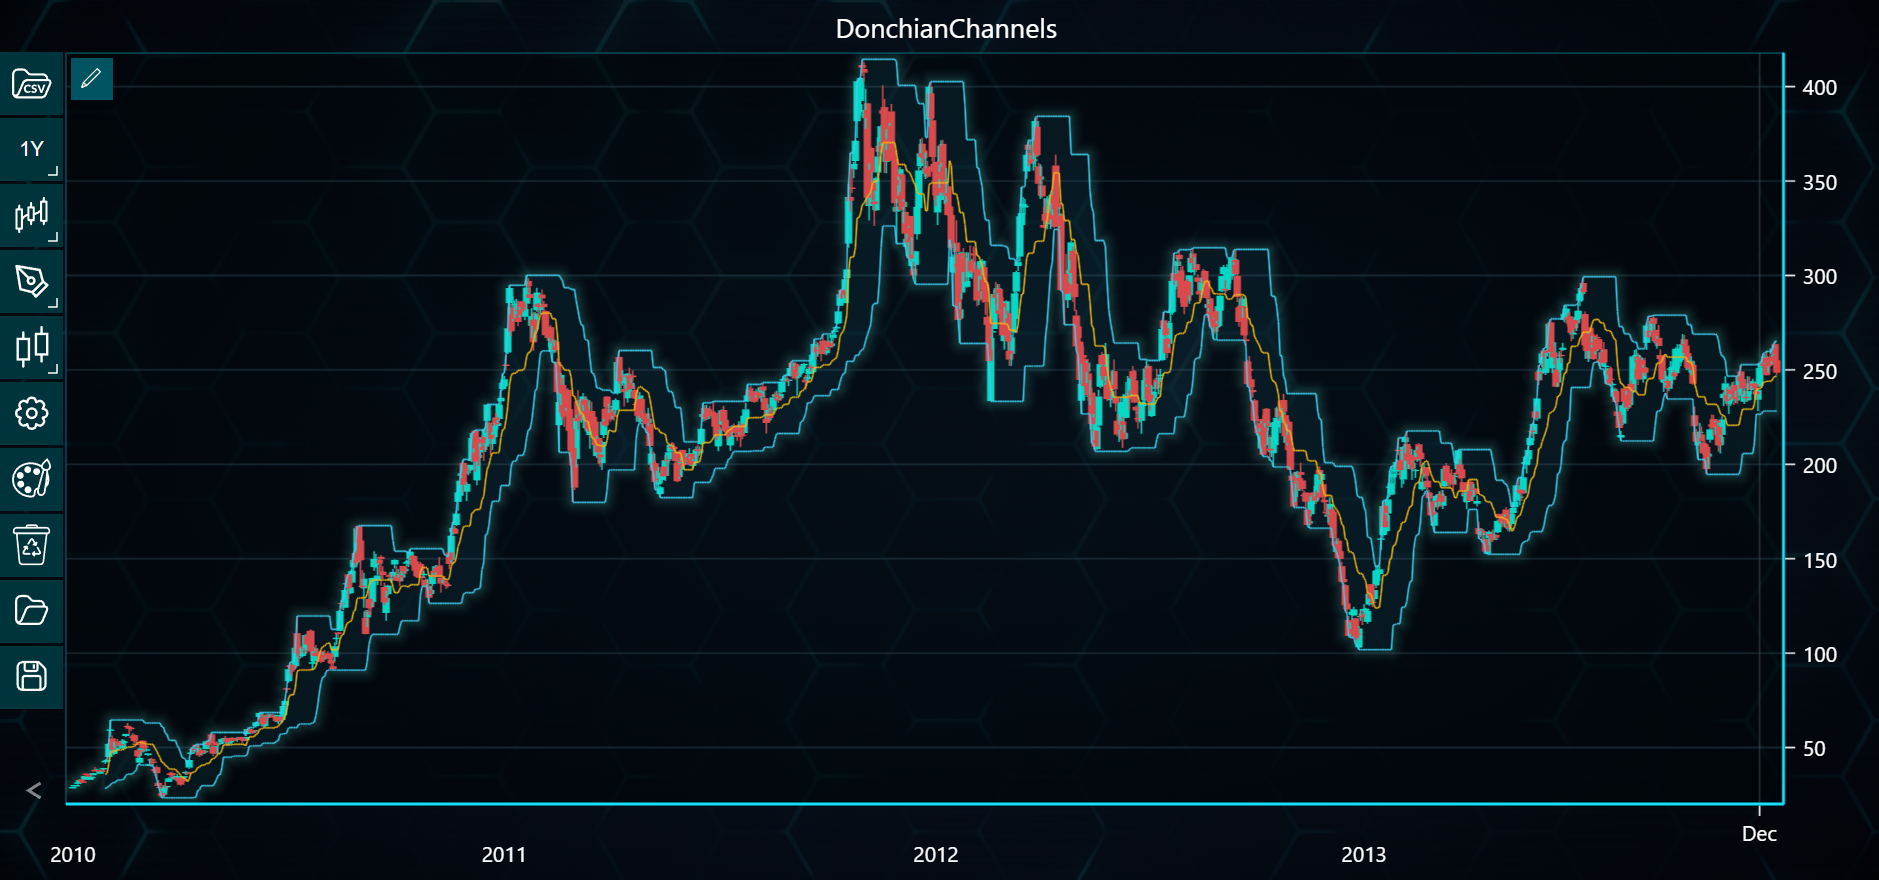
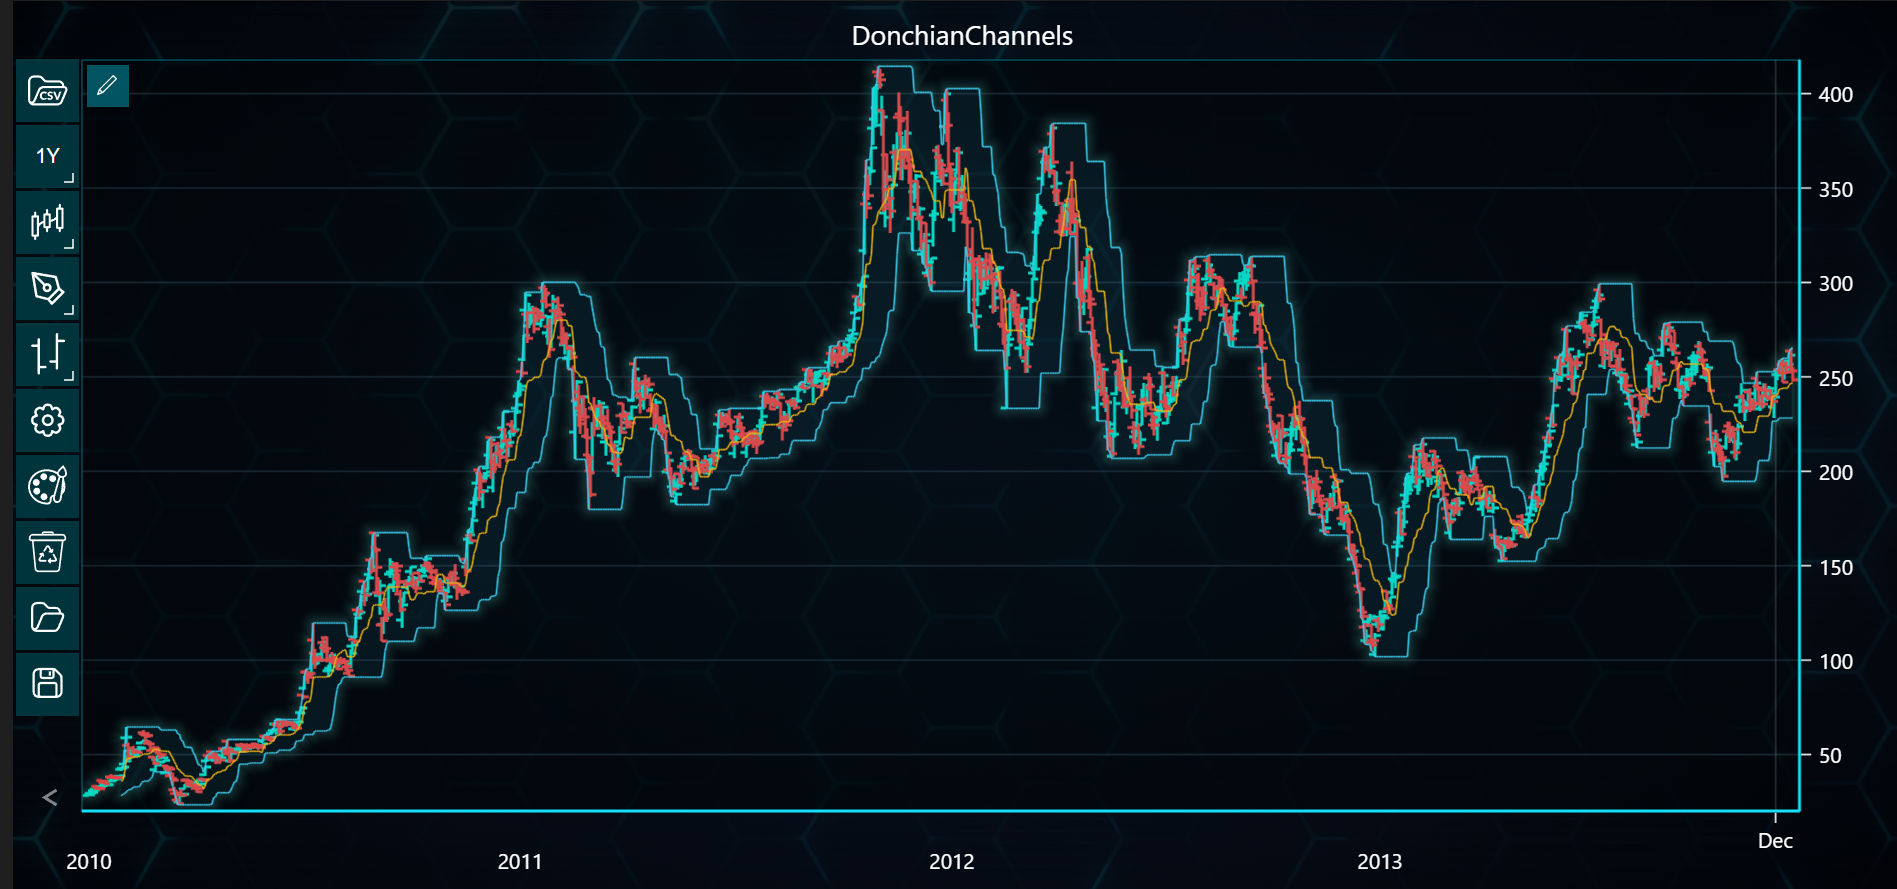
'DonchianChannels',
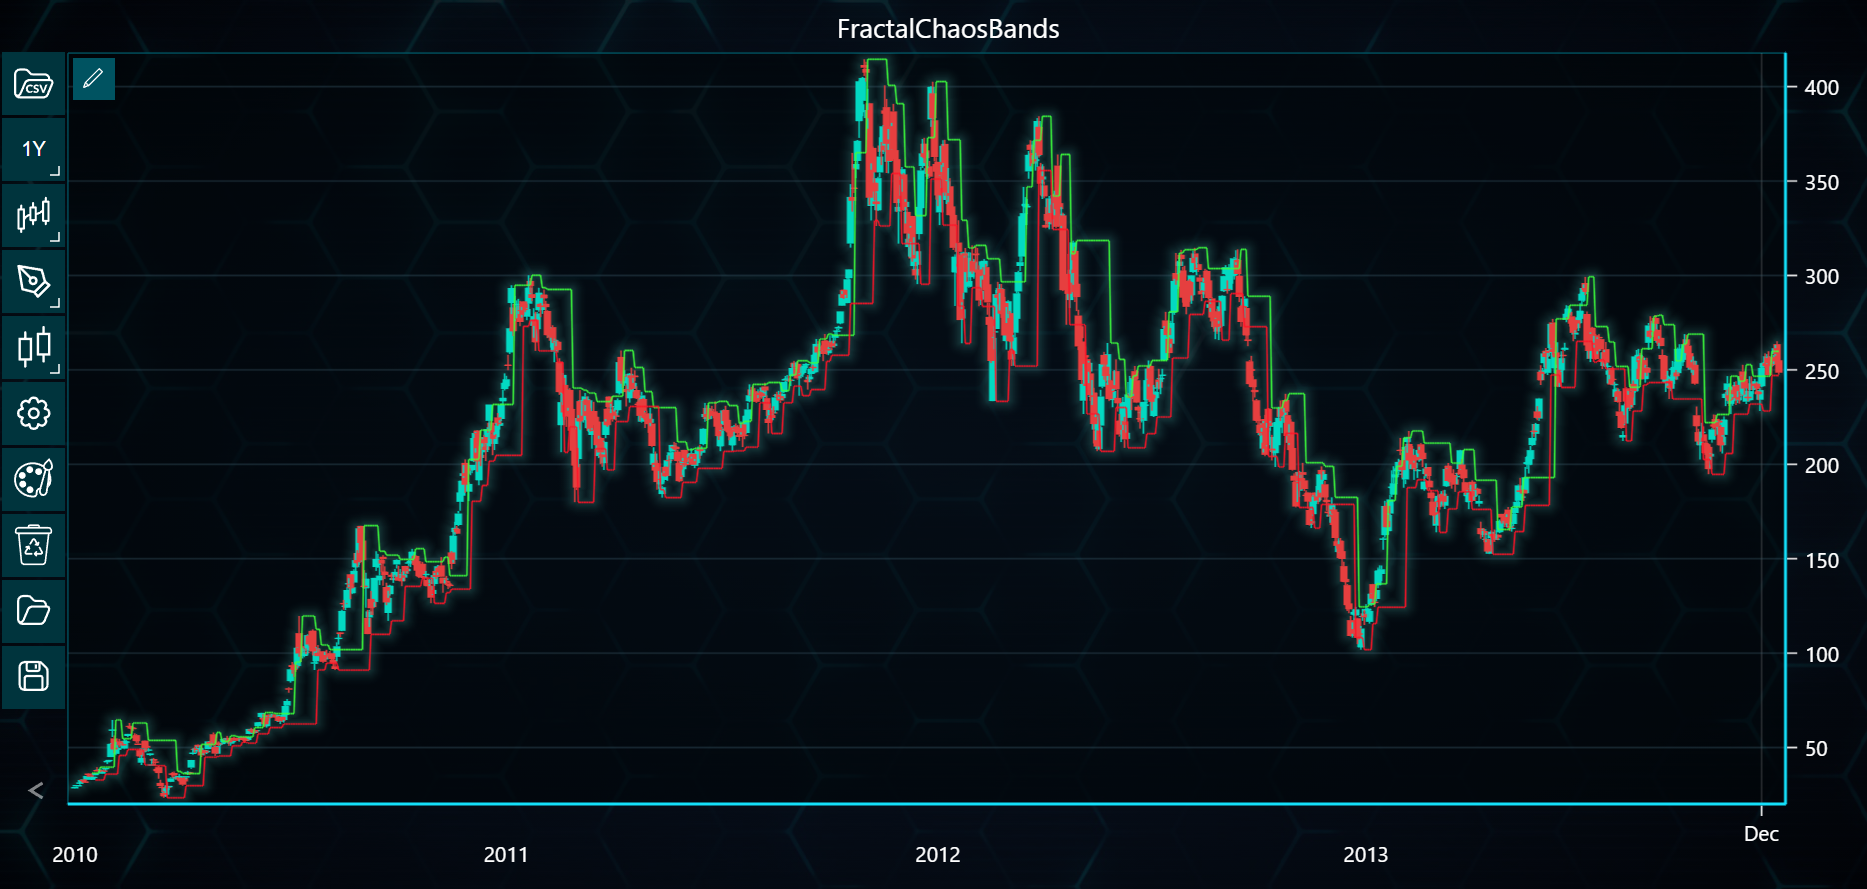
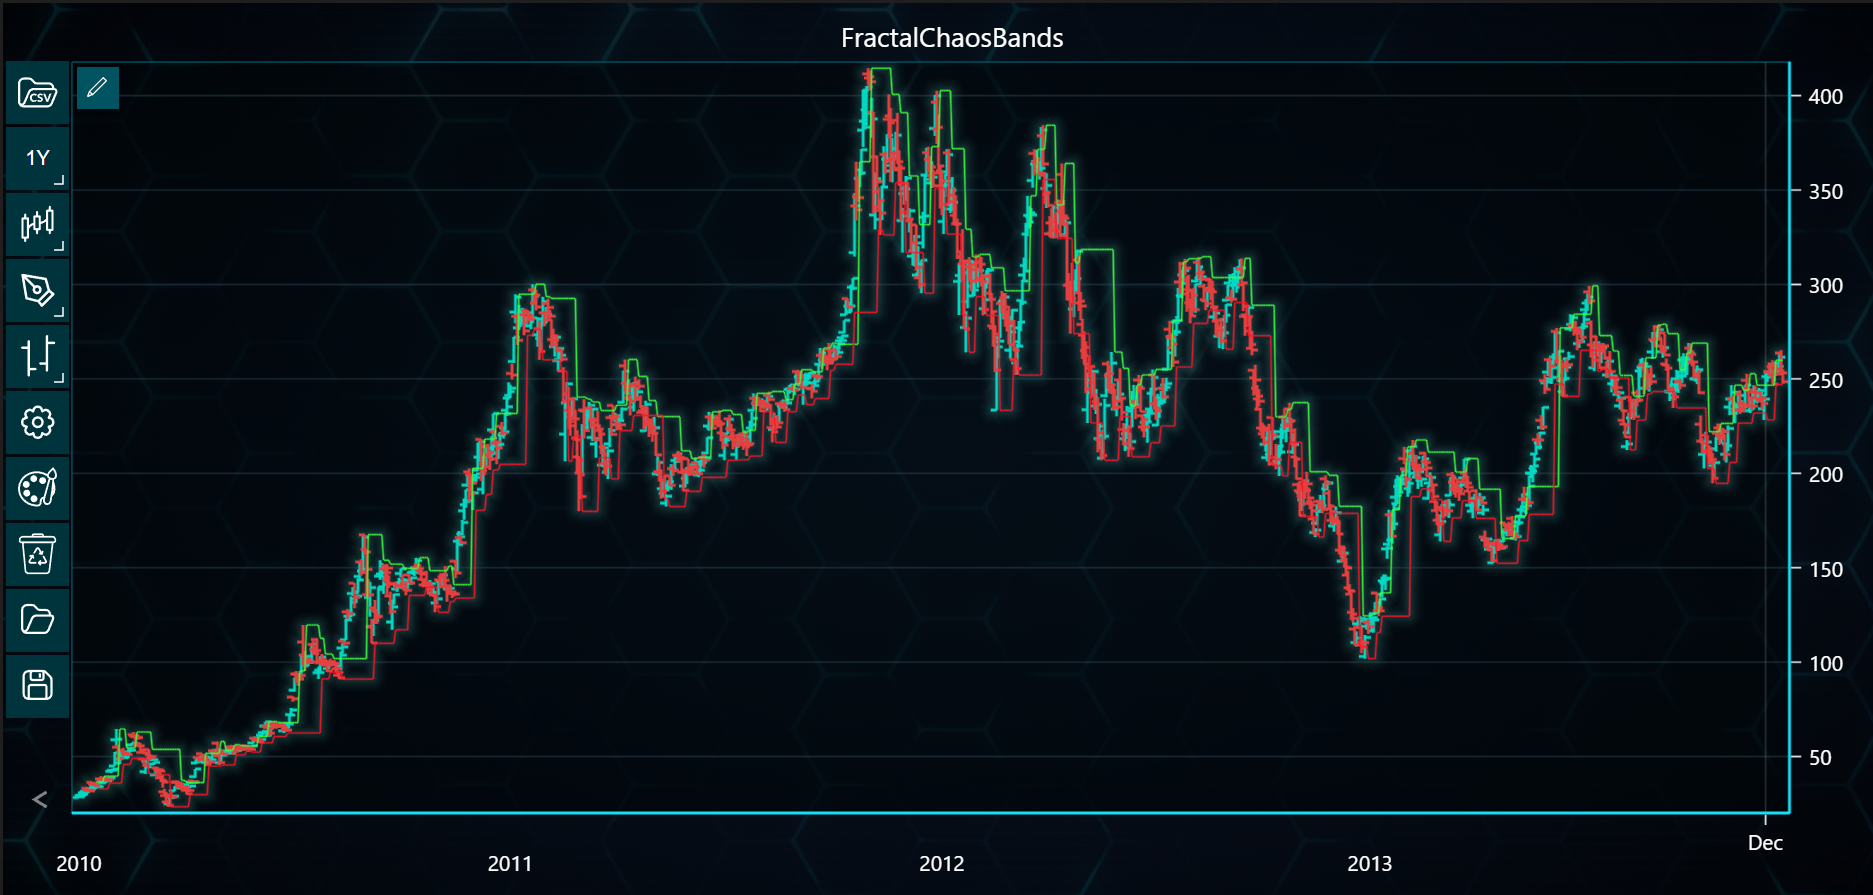
'FractalChaosBands',
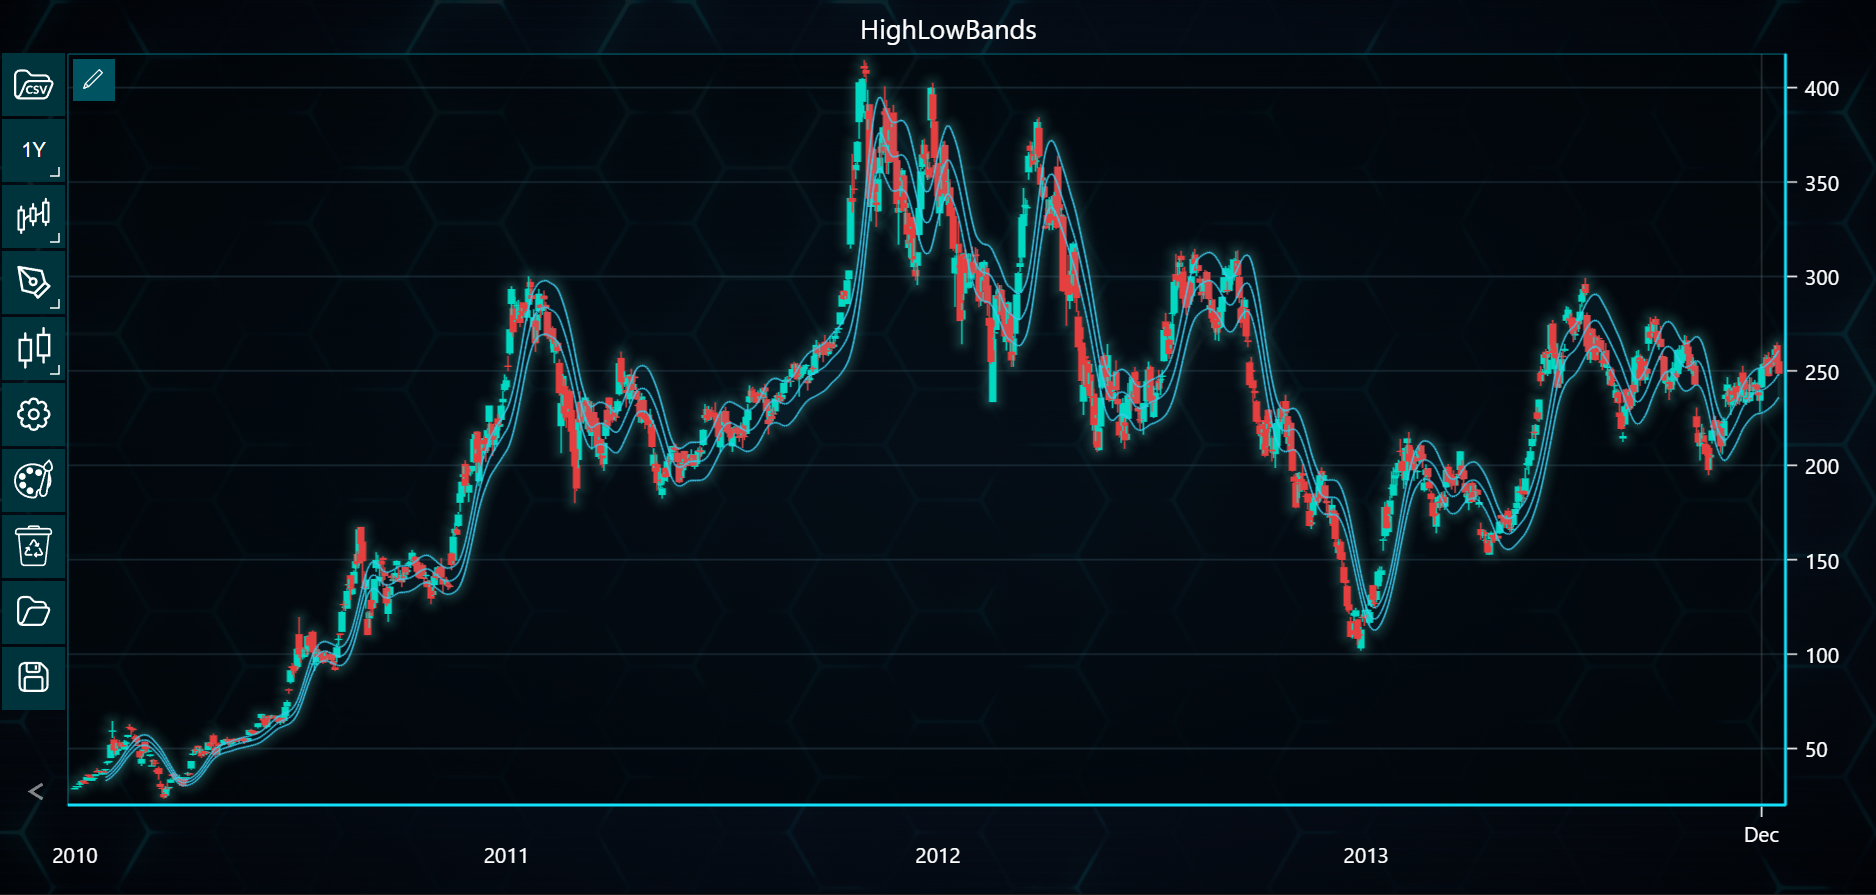
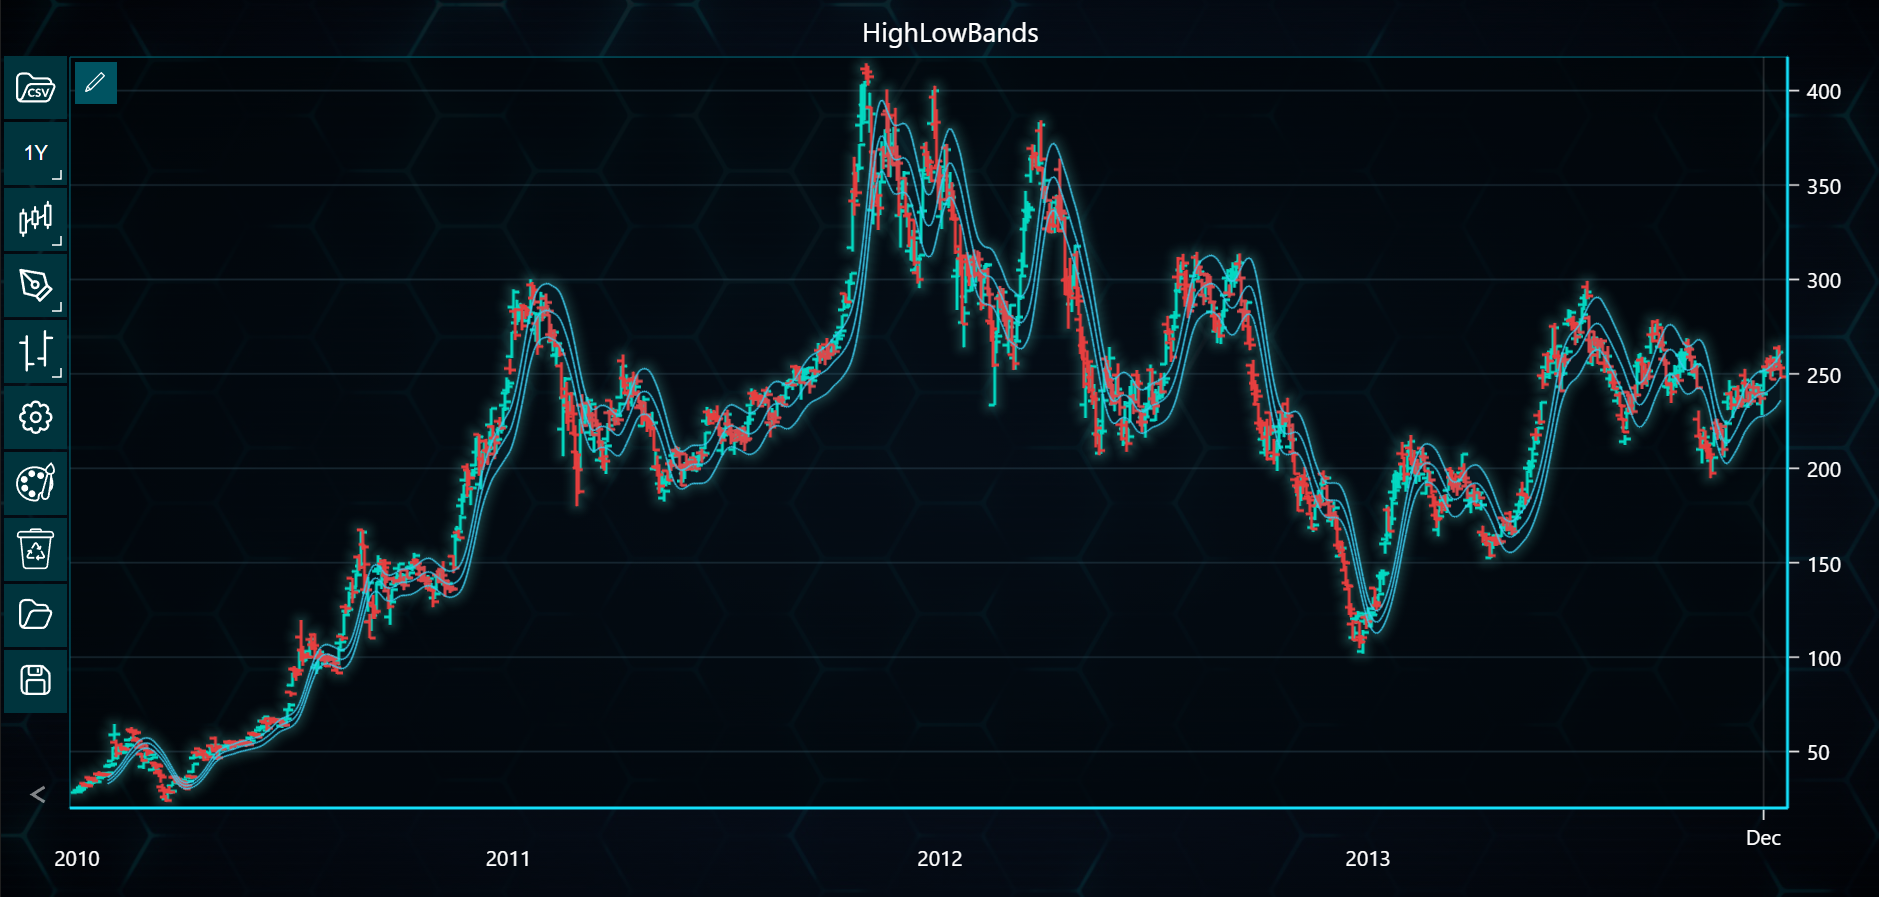
'HighLowBands',
'KeltnerChannels',
'MovingAverageEnvelopes',
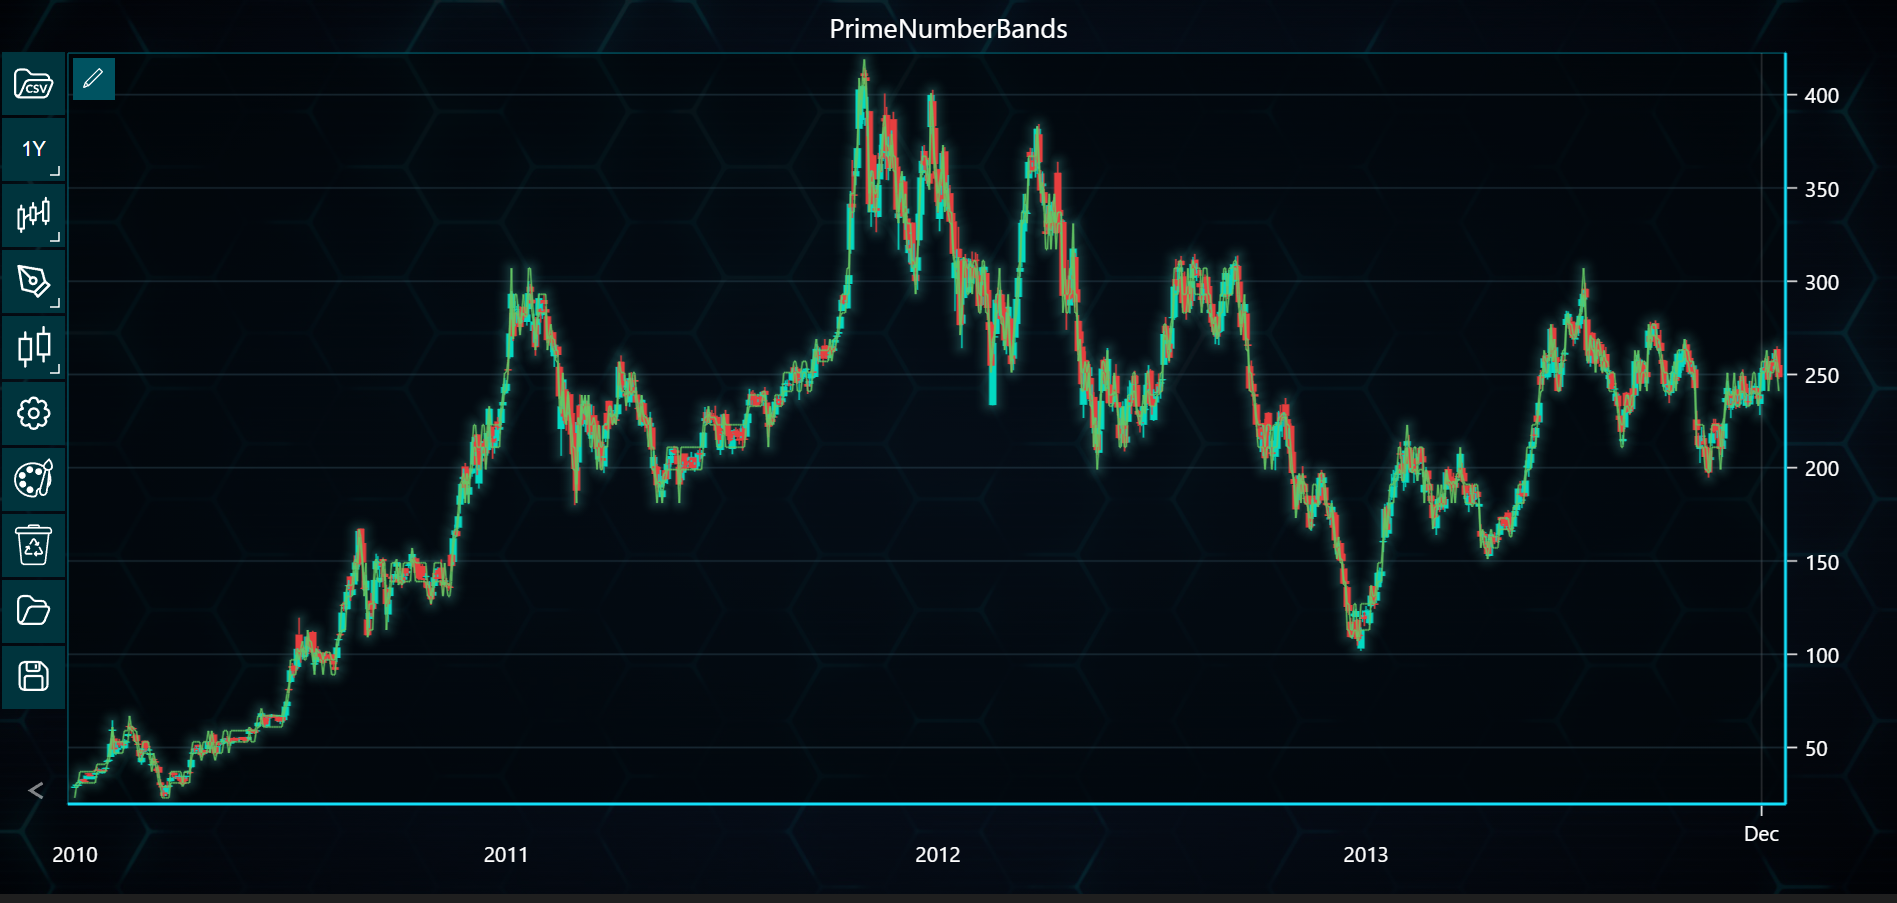
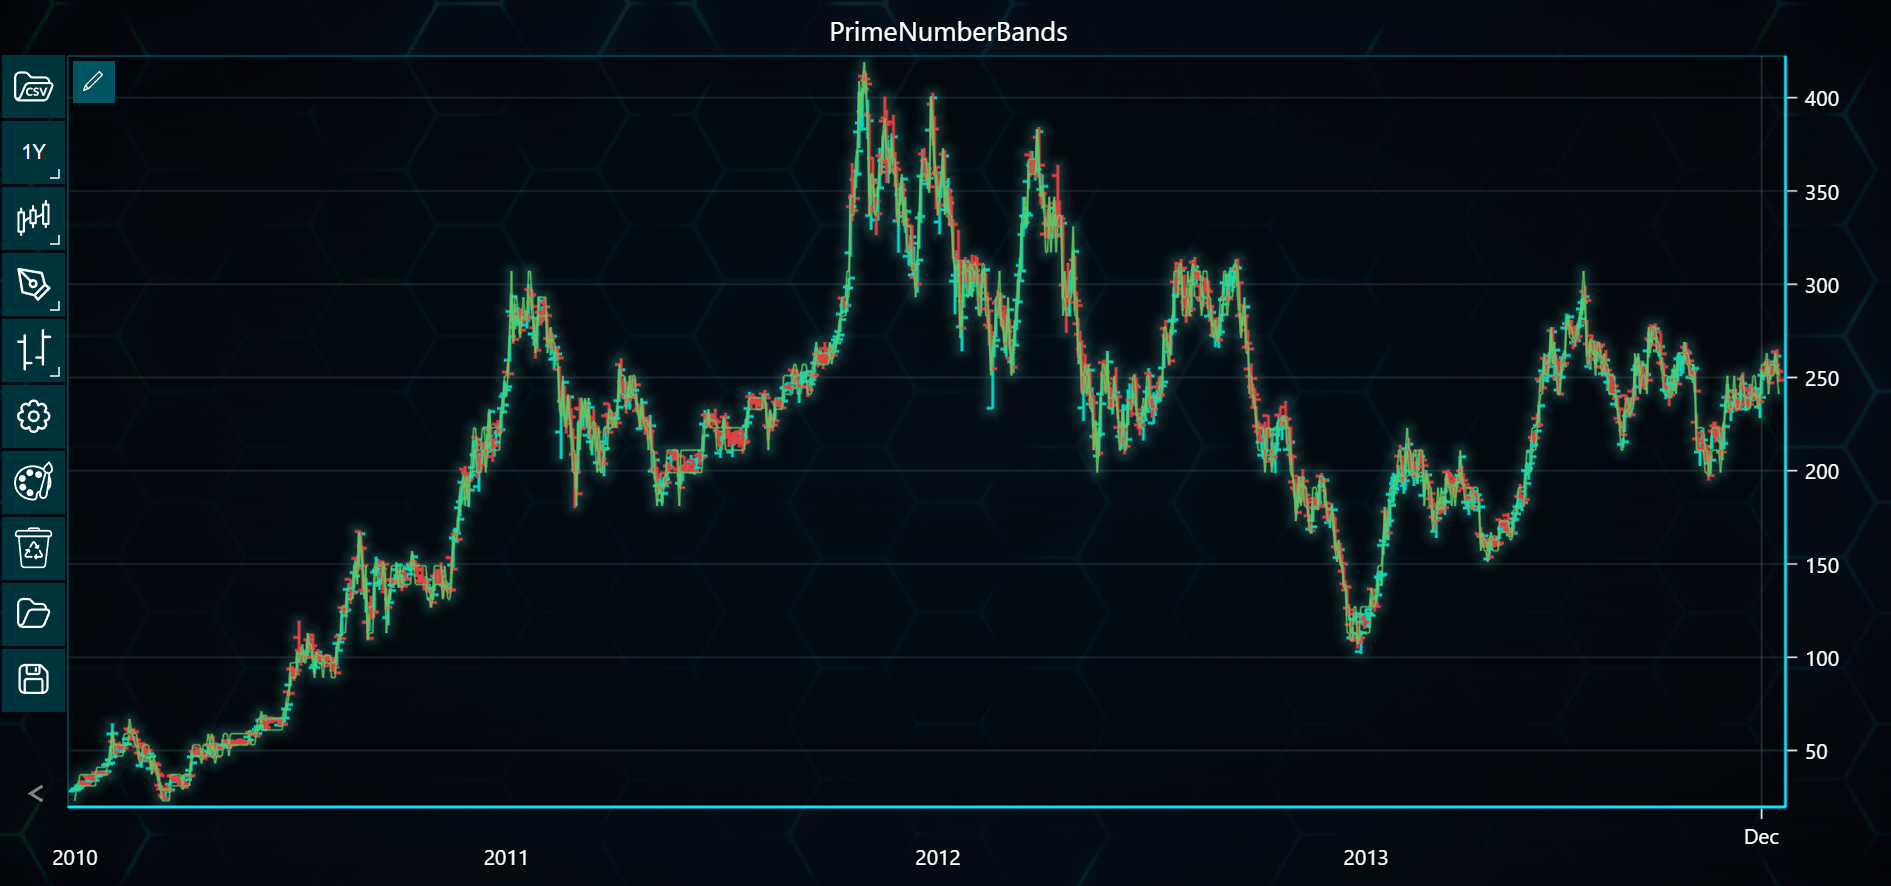
'PrimeNumberBands',
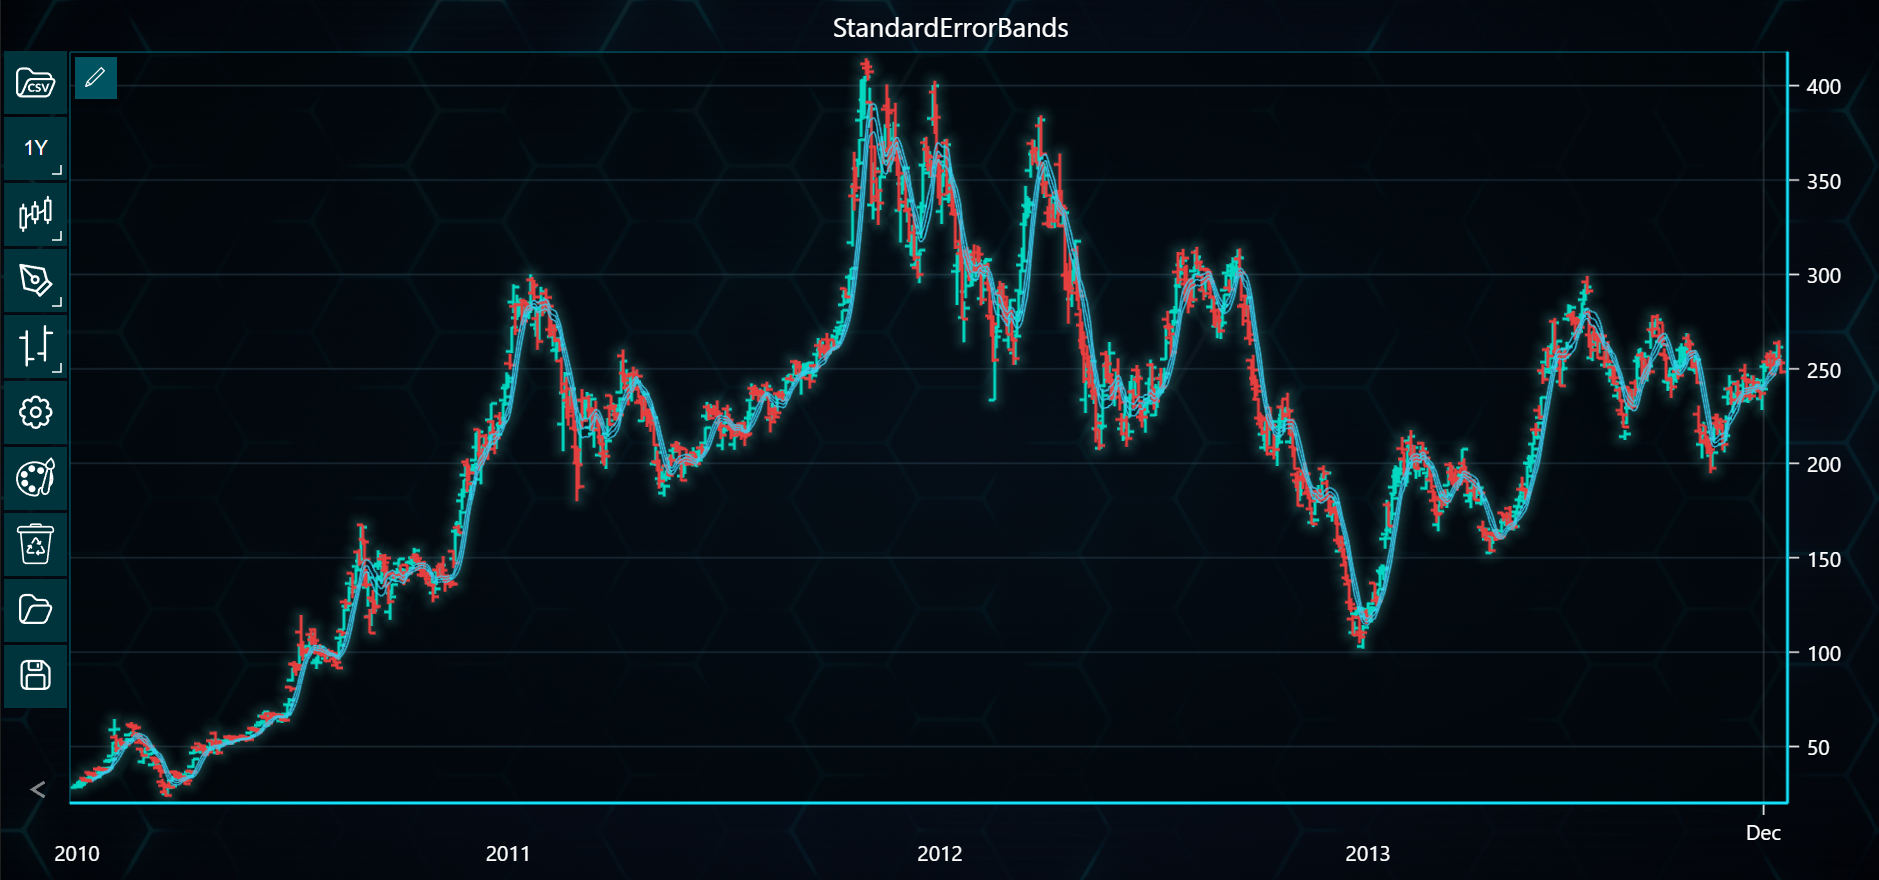
'StandardErrorBands',
'StollerAverageRangeChannel',
]
# Create an chartlication instance for each indicator
charts = []
for indicator_name in envelope_indicators:
chart = TAChart(license_key=license_key)
# Load the CSV data
chart.load_csv(csv=DATA_PATH, dataset_name='Tesla Data')
# Set the chart type to CandleStick
chart.set_price_chart_type('Bar')
# Set the chart title as the indicator name
chart.set_chart_title(indicator_name)
# Add the indicator to the chart with the correct method names and parameters
if indicator_name == 'MovingAverageEnvelopes':
# Moving Average Envelopes require a period parameter
chart.add_moving_average_envelopes(period_count=20)
elif indicator_name == 'KeltnerChannels':
chart.add_keltner_channels()
elif indicator_name == 'StollerAverageRangeChannel':
chart.add_stoller_average_range_channel()
elif indicator_name == 'BollingerBand':
chart.add_bollinger_band(period_count=20) # Added period_count for Bollinger Band
elif indicator_name == 'DonchianChannels':
chart.add_donchian_channels(
period_count=20
) # Added period_count for Donchian Channels
elif indicator_name == 'FractalChaosBands':
chart.add_fractal_chaos_bands()
elif indicator_name == 'HighLowBands':
chart.add_high_low_bands()
elif indicator_name == 'PrimeNumberBands':
chart.add_prime_number_bands()
elif indicator_name == 'StandardErrorBands':
chart.add_standard_error_bands()
# append the chart instance to the list for display later
charts.append(chart)
# Display each chart stacked vertically in Jupyter Notebook
for chart in charts:
chart.open()
Using CandleStick Chart
from lightningchart_trader import TAChart

LICENSE_KEY_PATH = "license_key.txt"
DATA_PATH = "Tesla.csv"

# Load the license key
license_key = open(LICENSE_KEY_PATH).read()

# Defining a list of envelope indicators
envelope_indicators = [
    'BollingerBand',
    'DonchianChannels',
    'FractalChaosBands',
    'HighLowBands',
    'KeltnerChannels',
    'MovingAverageEnvelopes',
    'PrimeNumberBands',
    'StandardErrorBands',
    'StollerAverageRangeChannel',
]

# List to hold chart instances for each chart
charts = []

# Open all charts and store them in variables
for indicator_name in envelope_indicators:
    chart = TAChart(license_key=license_key)

    # Load the CSV data
    chart.load_csv(csv=DATA_PATH, dataset_name='Tesla Data')

    # Defining chart type
    chart.set_price_chart_type('CandleStick')

    # Set the chart title as the indicator name
    chart.set_chart_title(indicator_name)

    # Add the indicators to chart
    if indicator_name == 'MovingAverageEnvelopes':
        chart.add_moving_average_envelopes(period_count=20)
    elif indicator_name == 'KeltnerChannels':
        chart.add_keltner_channels()
    elif indicator_name == 'StollerAverageRangeChannel':
        chart.add_stoller_average_range_channel()
    elif indicator_name == 'BollingerBand':
        chart.add_bollinger_band(period_count=20)
    elif indicator_name == 'DonchianChannels':
        chart.add_donchian_channels(period_count=20)
    elif indicator_name == 'FractalChaosBands':
        chart.add_fractal_chaos_bands()
    elif indicator_name == 'HighLowBands':
        chart.add_high_low_bands()
    elif indicator_name == 'PrimeNumberBands':
        chart.add_prime_number_bands()
    elif indicator_name == 'StandardErrorBands':
        chart.add_standard_error_bands()

    # Add chart instances to the list to prepare for display
    charts.append(chart)

# Open charts
for chart in charts:
    chart.open()