v1.2.0
Price Oscillators
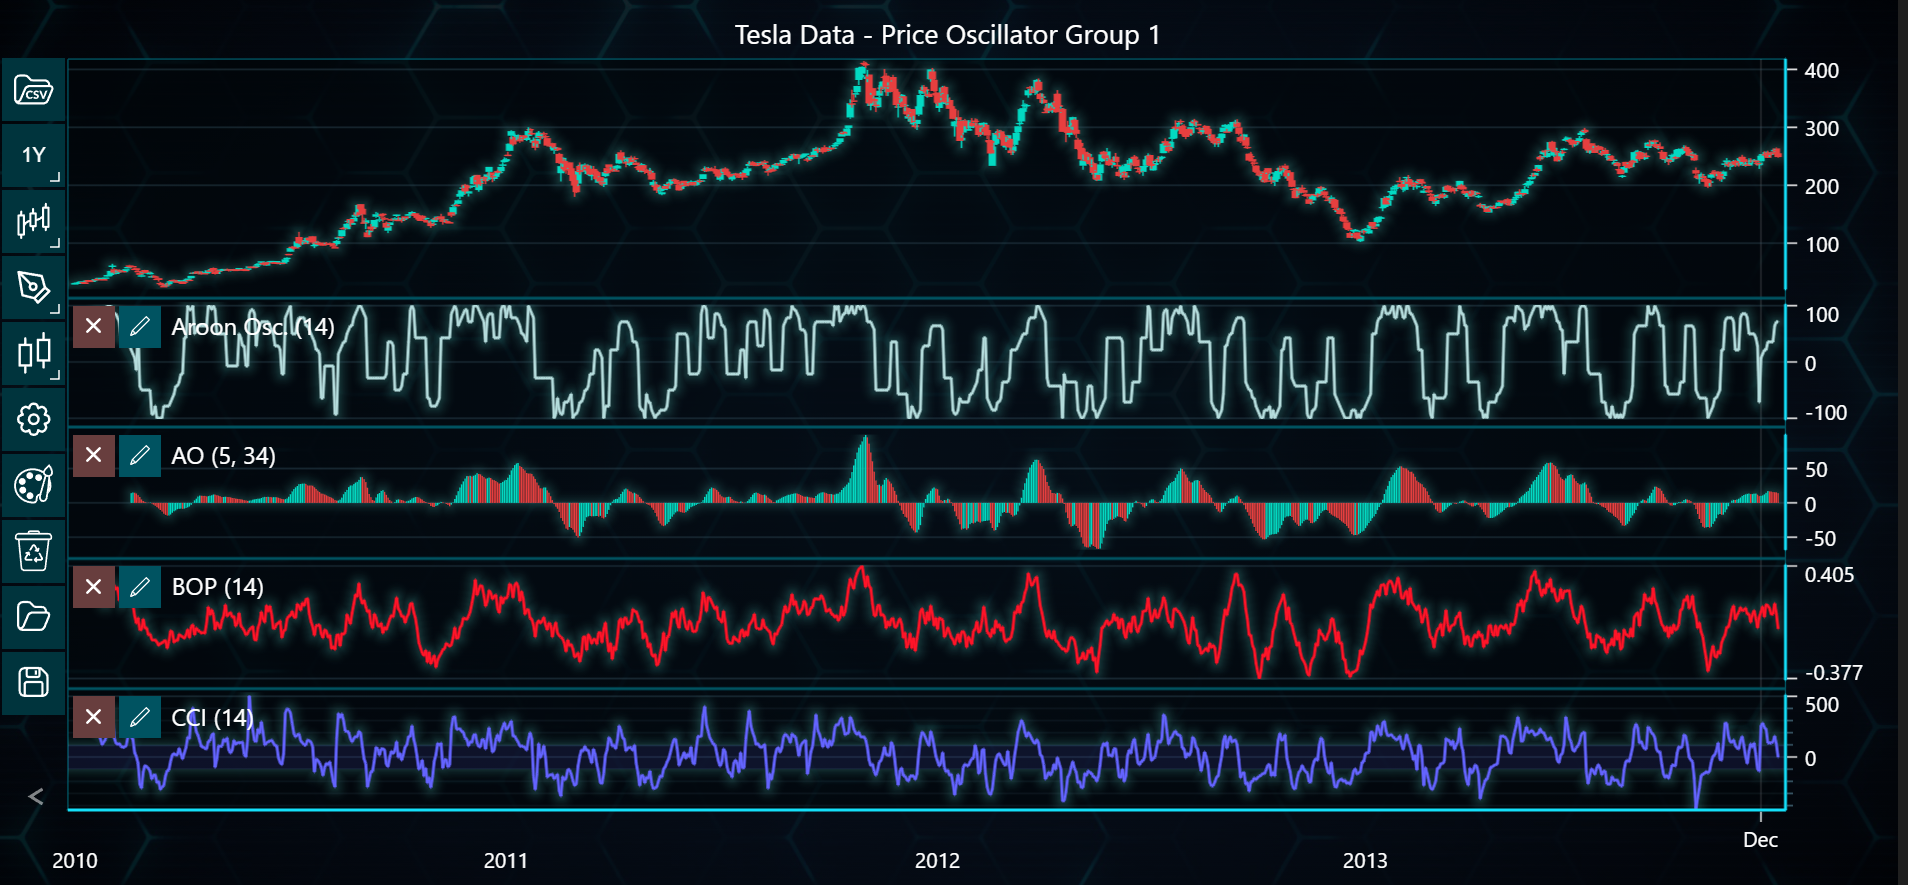
This example shows how to visualize over 30 price oscillators—like MACD, RSI, and Awesome Oscillator—using LightningChart Python Trader. Full code and dataset are provided at the bottom of the page.
from lightningchart_trader import TAChart
LICENSE_KEY_PATH = "license_key.txt"
DATA_PATH = "Tesla.csv"
# Load the license key
license_key = open(LICENSE_KEY_PATH).read()
# Defining oscillator groups
price_oscillator_groups = [
[
'aroon_oscillator',
'awesome_oscillator',
'balance_of_power',
'commodity_channel_index',
],
[
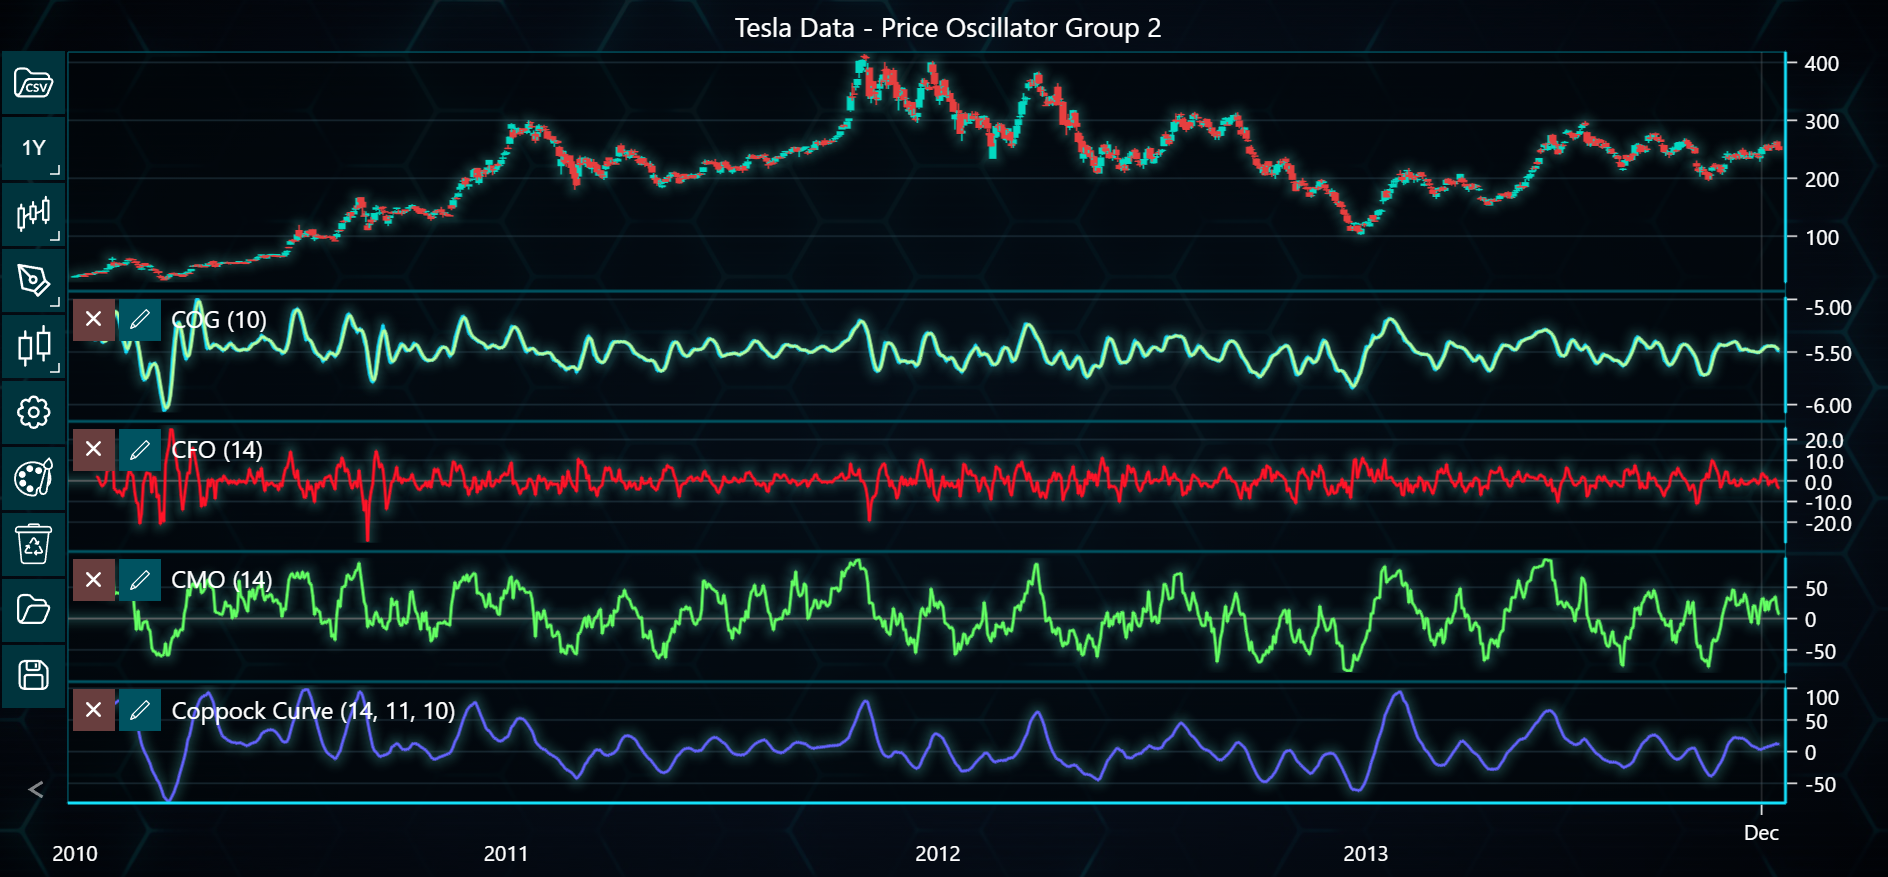
'center_of_gravity',
'chande_forecast_oscillator',
'chande_momentum_oscillator',
'coppock_curve',
],
[
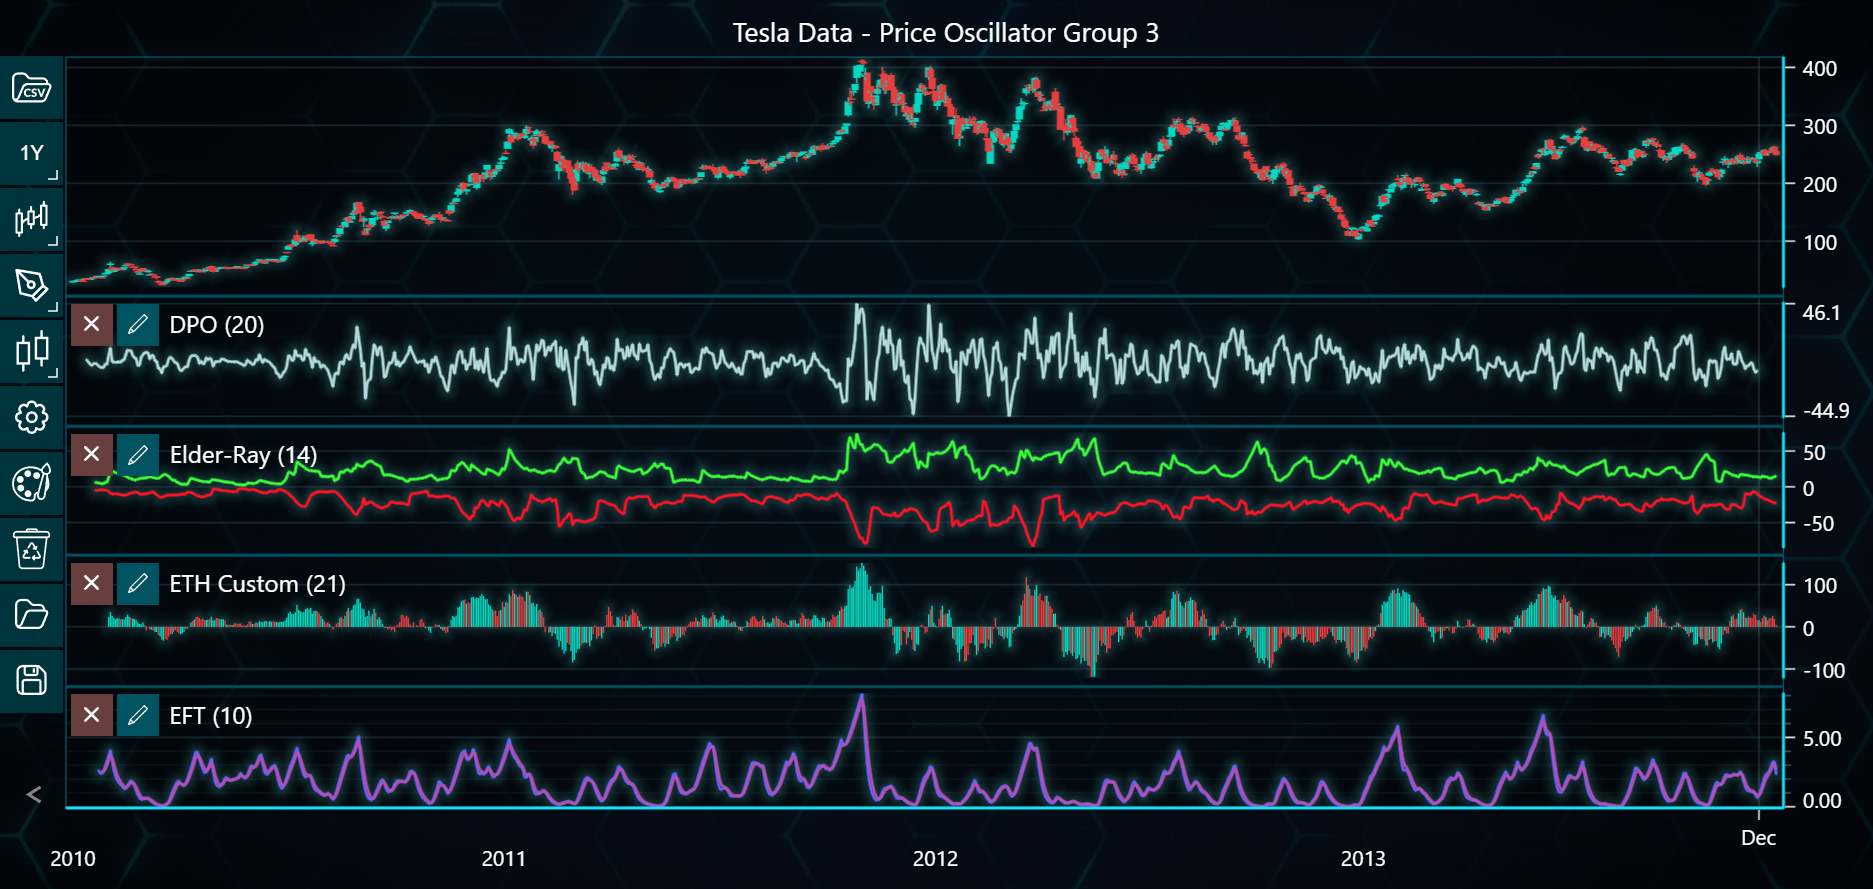
'detrended_price_oscillator',
'elder_ray_index',
'elder_thermometer_custom',
'fisher_transform',
],
[
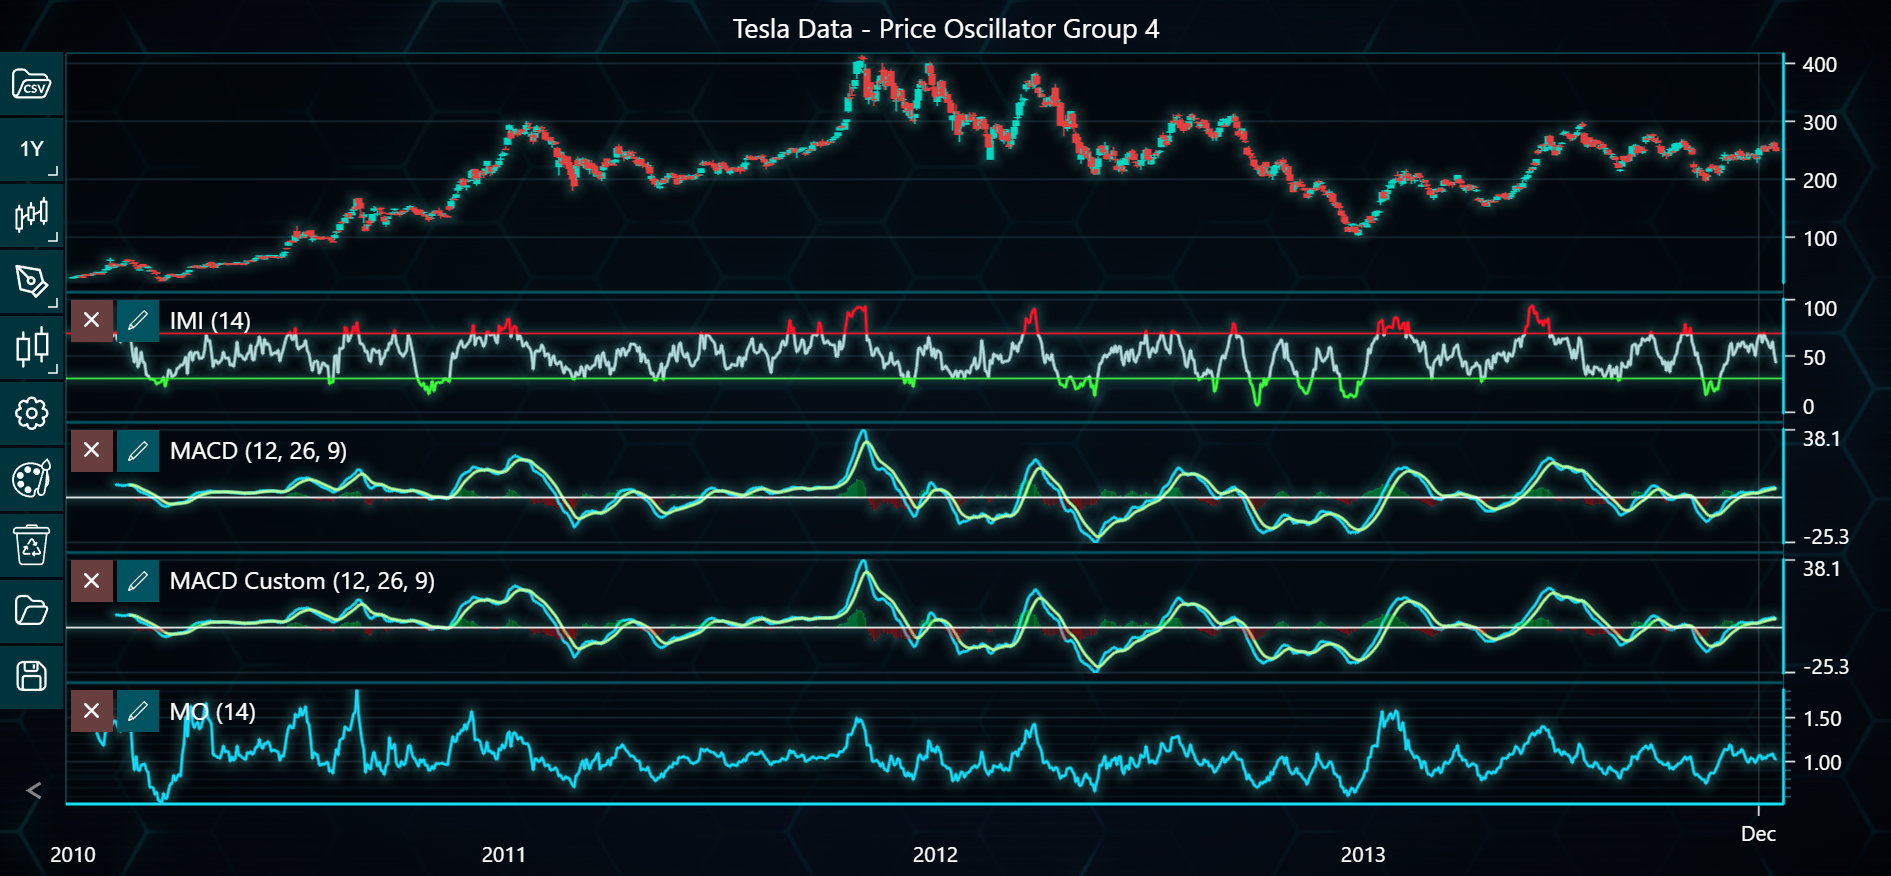
'intraday_momentum_index',
'moving_average_convergence_divergence',
'moving_average_convergence_divergence_custom',
'momentum_oscillator',
],
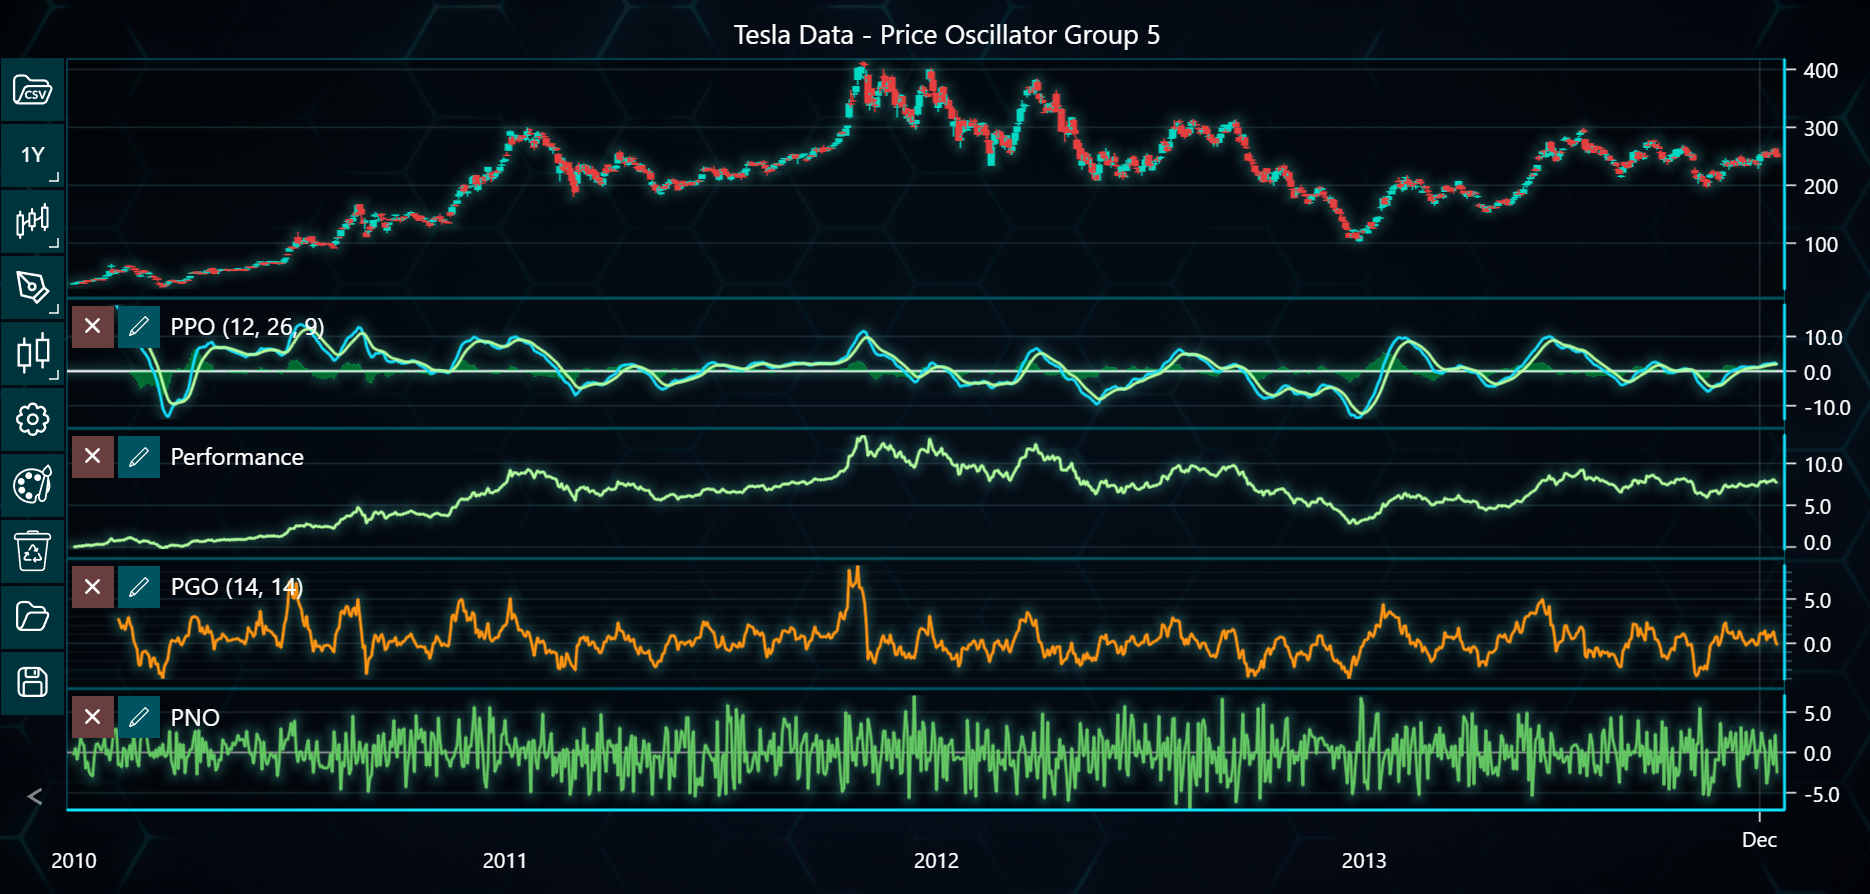
[
'percentage_price_oscillator',
'performance_index',
'pretty_good_oscillator',
'prime_number_oscillator',
],
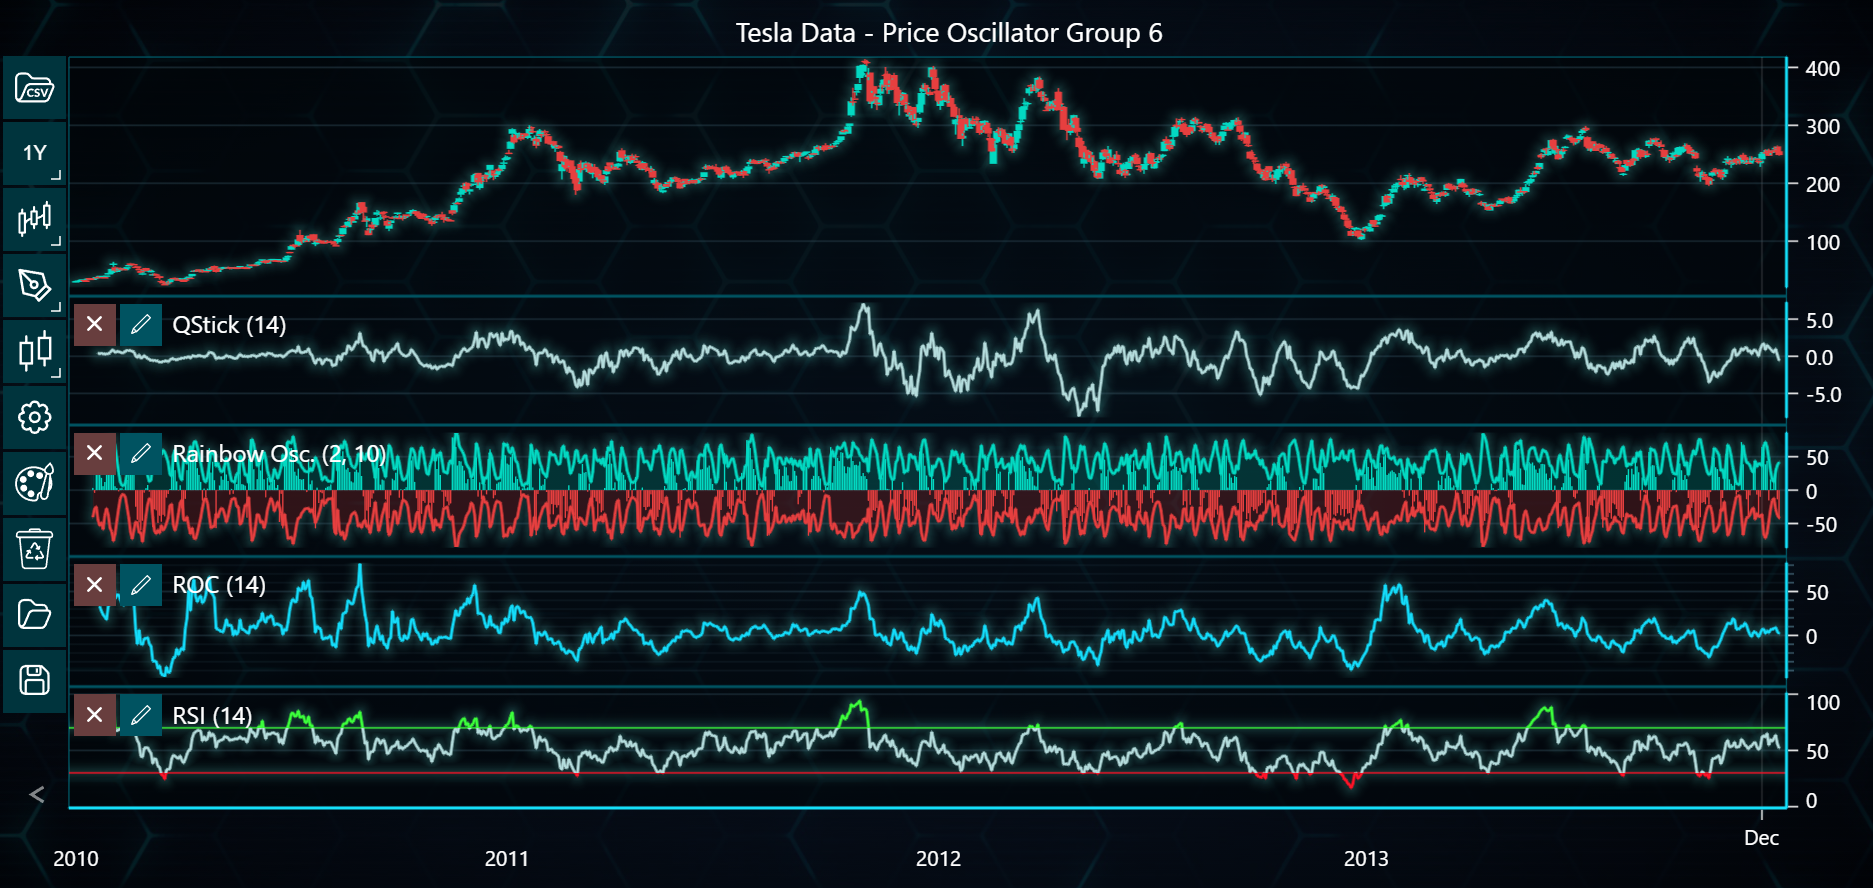
['qstick', 'rainbow_oscillator', 'rate_of_change', 'relative_strength_index'],
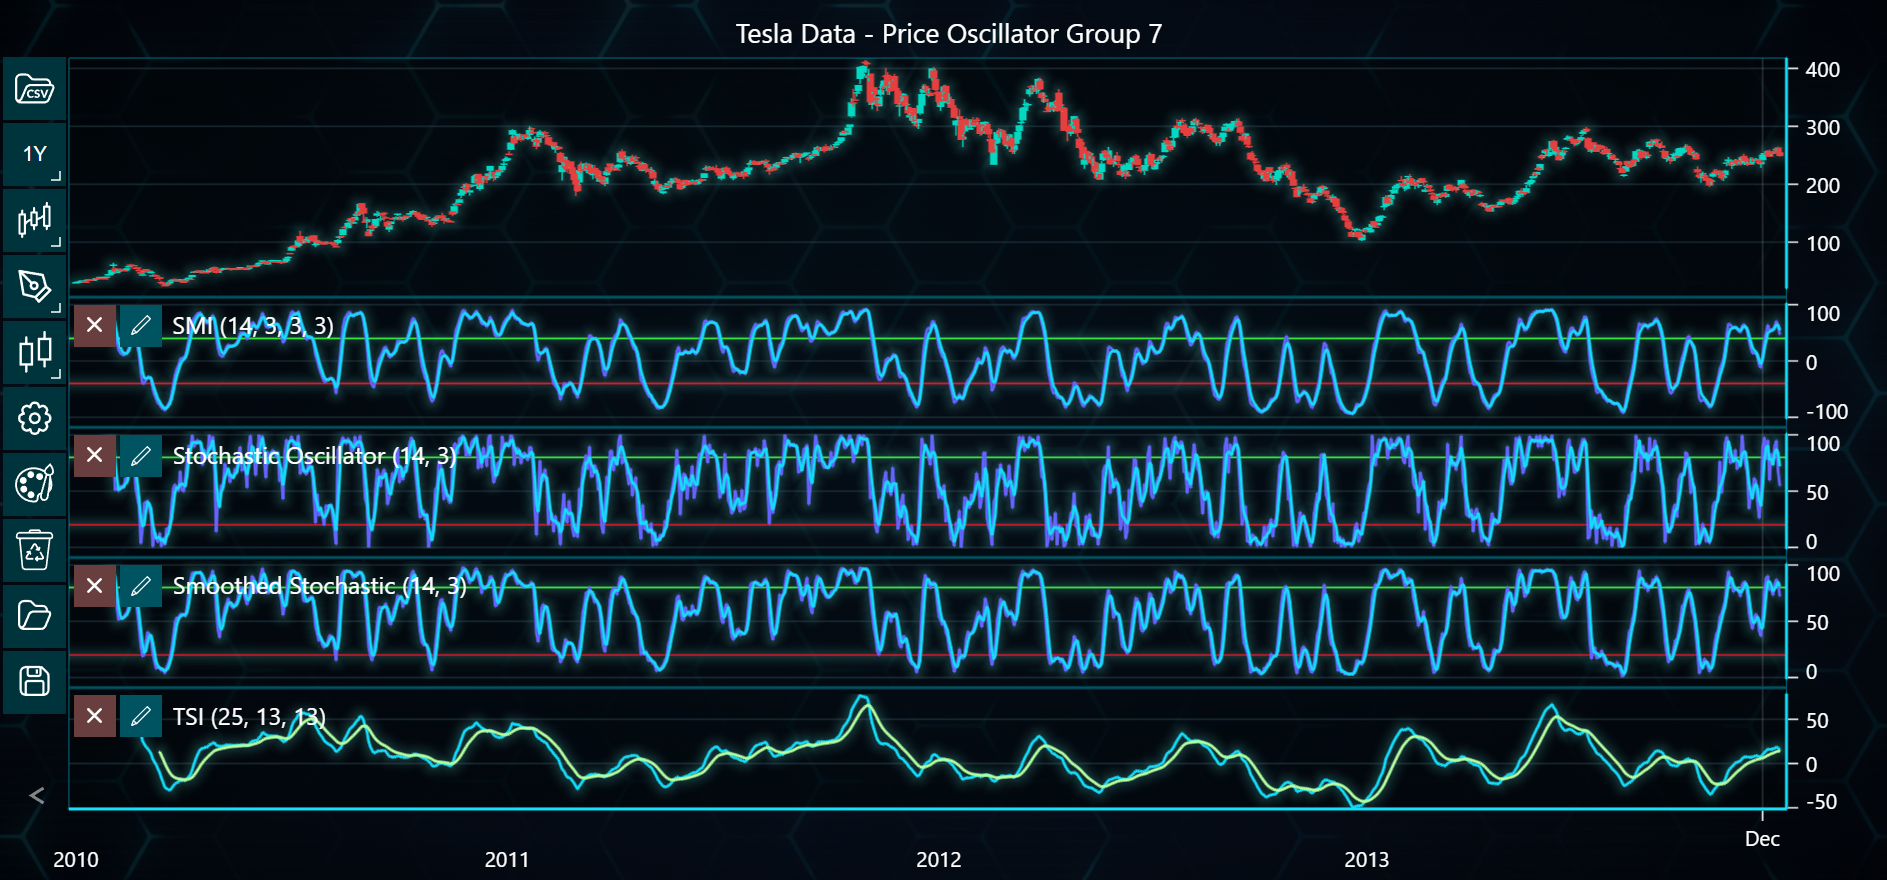
[
'stochastic_momentum_index',
'stochastic_oscillator',
'stochastic_oscillator_smoothed',
'true_strength_index',
],
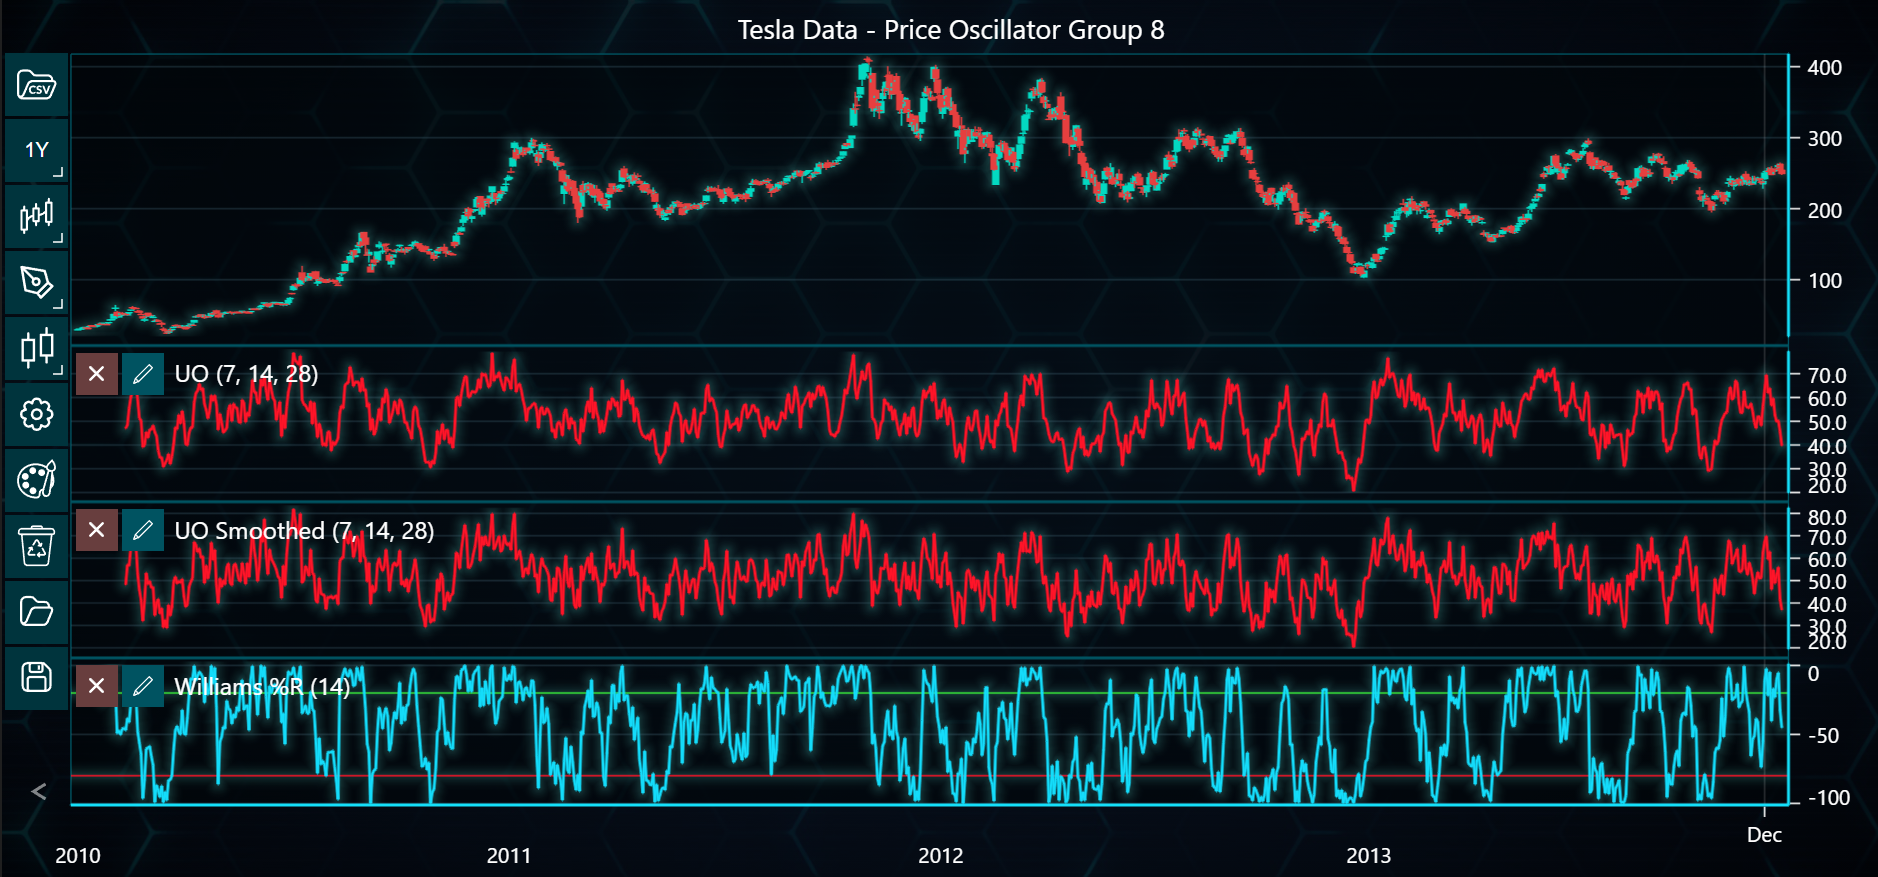
['ultimate_oscillator', 'ultimate_oscillator_smoothed', 'williams_percent_range'],
]
# List to hold the chart instances
charts = []
# Loop through each oscillator group
for i, indicators in enumerate(price_oscillator_groups, start=1):
chart = TAChart(license_key=license_key)
chart.load_csv(
csv=DATA_PATH, dataset_name=f'Tesla Data - Price Oscillator Group {i}'
)
chart.set_price_chart_type('CandleStick')
# Configure indicators
for indicator_name in indicators:
if indicator_name == 'aroon_oscillator':
chart.add_aroon_oscillator(period_count=14)
elif indicator_name == 'awesome_oscillator':
chart.add_awesome_oscillator()
elif indicator_name == 'balance_of_power':
chart.add_balance_of_power()
elif indicator_name == 'commodity_channel_index':
chart.add_commodity_channel_index(period_count=14)
elif indicator_name == 'center_of_gravity':
chart.add_center_of_gravity()
elif indicator_name == 'chande_forecast_oscillator':
chart.add_chande_forecast_oscillator(period_count=14)
elif indicator_name == 'chande_momentum_oscillator':
chart.add_chande_momentum_oscillator(period_count=14)
elif indicator_name == 'coppock_curve':
chart.add_coppock_curve()
elif indicator_name == 'detrended_price_oscillator':
chart.add_detrended_price_oscillator()
elif indicator_name == 'elder_ray_index':
chart.add_elder_ray_index(period_count=14)
elif indicator_name == 'elder_thermometer_custom':
chart.add_elder_thermometer_custom()
elif indicator_name == 'fisher_transform':
chart.add_ehler_fisher_transform()
elif indicator_name == 'intraday_momentum_index':
chart.add_intraday_momentum_index()
elif indicator_name == 'moving_average_convergence_divergence':
chart.add_moving_average_convergence_divergence()
elif indicator_name == 'moving_average_convergence_divergence_custom':
chart.add_moving_average_convergence_divergence_custom()
elif indicator_name == 'momentum_oscillator':
chart.add_momentum_oscillator(period_count=14)
elif indicator_name == 'percentage_price_oscillator':
chart.add_percentage_price_oscillator()
elif indicator_name == 'performance_index':
chart.add_performance_index()
elif indicator_name == 'pretty_good_oscillator':
chart.add_pretty_good_oscillator()
elif indicator_name == 'prime_number_oscillator':
chart.add_prime_number_oscillator()
elif indicator_name == 'qstick':
chart.add_qstick(period_count=14)
elif indicator_name == 'rainbow_oscillator':
chart.add_rainbow_oscillator()
elif indicator_name == 'rate_of_change':
chart.add_rate_of_change(period_count=14)
elif indicator_name == 'relative_strength_index':
chart.add_relative_strength_index(period_count=14)
elif indicator_name == 'stochastic_momentum_index':
chart.add_stochastic_momentum_index()
elif indicator_name == 'stochastic_oscillator':
chart.add_stochastic_oscillator()
elif indicator_name == 'stochastic_oscillator_smoothed':
chart.add_stochastic_oscillator_smoothed()
elif indicator_name == 'true_strength_index':
chart.add_true_strength_index()
elif indicator_name == 'ultimate_oscillator':
chart.add_ultimate_oscillator()
elif indicator_name == 'ultimate_oscillator_smoothed':
chart.add_ultimate_oscillator_smoothed()
elif indicator_name == 'williams_percent_range':
chart.add_williams_percent_range(period_count=14)
# Add chart instances to the list to prepare for display
charts.append(chart)
# Open charts
for chart in charts:
chart.open()