v1.2.0
Measurement Tools
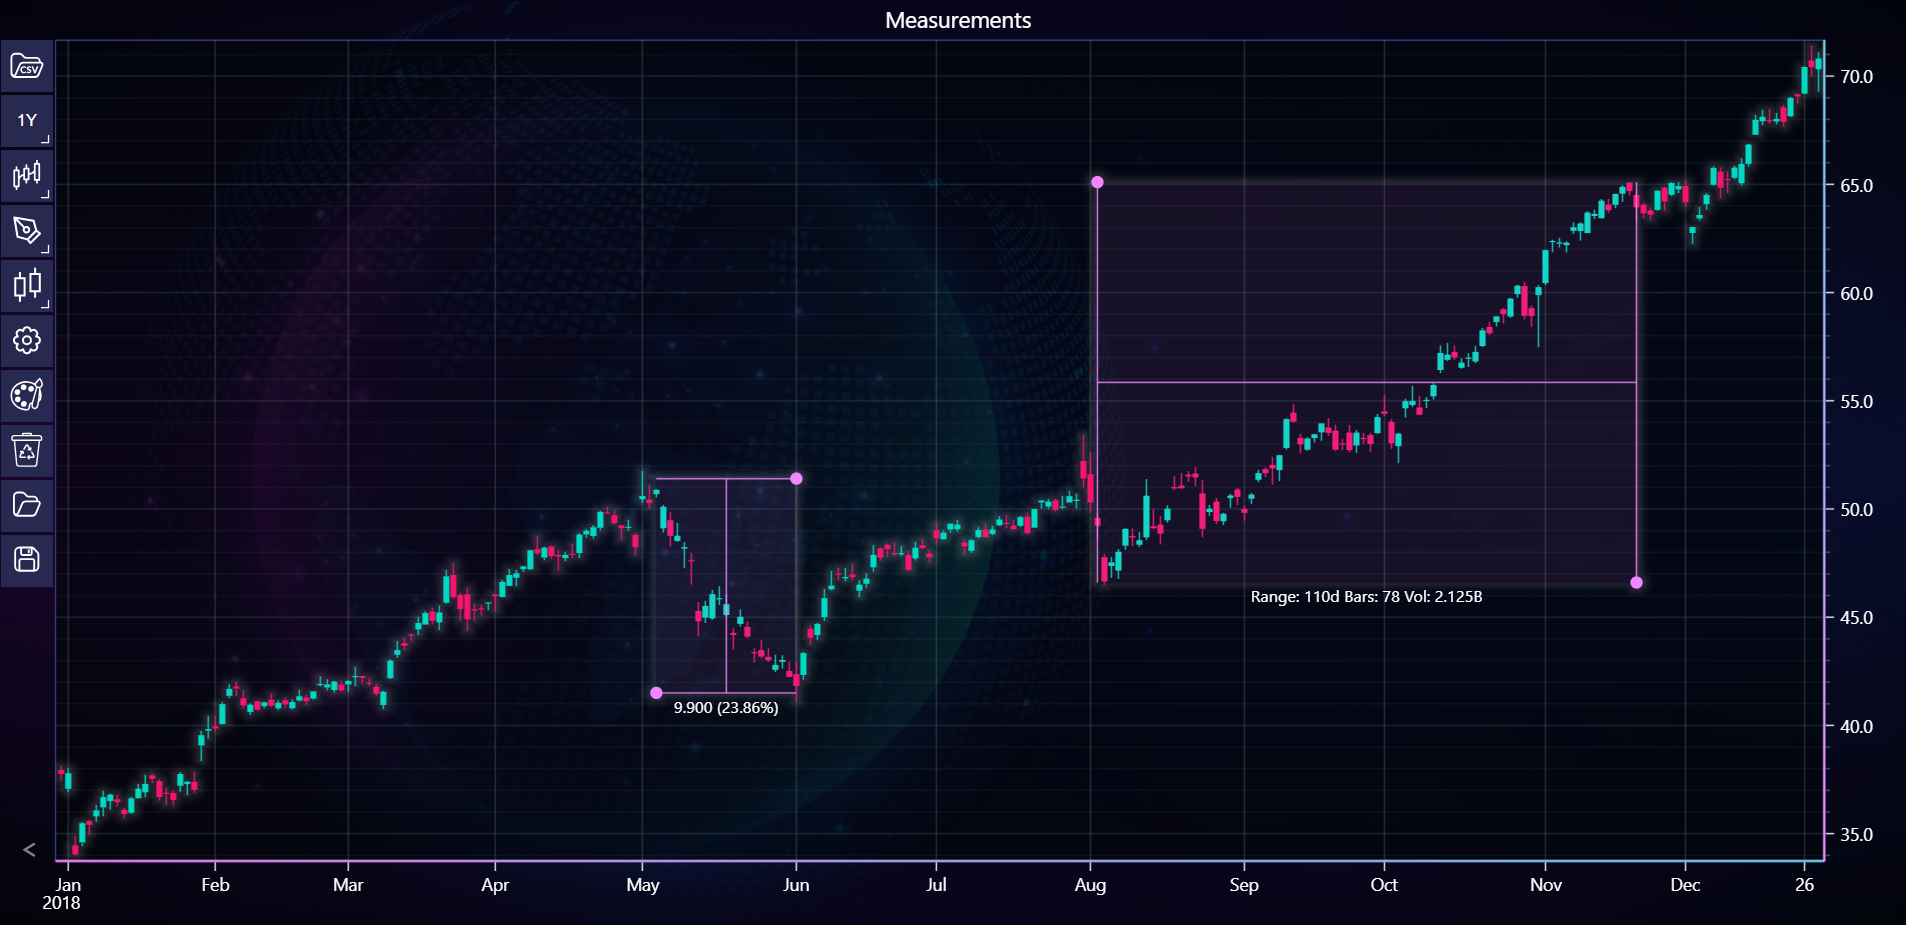
In the example below, you can explore how to add date range measurement tool to the chart to a chart using the LightningChart Python Trader. Full code and dataset are provided at the bottom of the page.
Download 'Apple Inc. (AAPL) - 10y.csv'
from lightningchart_trader import TAChart
from datetime import datetime

LICENSE_KEY_PATH = "license_key.txt"
DATA_PATH = "Apple Inc. (AAPL) - 10y.csv"

# Load the license key
license_key = open(LICENSE_KEY_PATH).read()

chart = TAChart(license_key=license_key)

# Set the chart type and title
chart.set_chart_title('Measurements')
chart.set_color_theme('cyberSpace')

# Load CSV data for Tesla
chart.load_csv(DATA_PATH)

# Set time range
start_time = datetime(2018, 12, 31)
end_time = datetime(2019, 12, 30)
chart.set_time_range(start_time, end_time)

# Adding Date Range
date_range = chart.add_date_range(225, 46.6, 148, 65.1)
date_range.set_fill_enabled(True)

# Adding Price Range
price_range = chart.add_price_range(85, 41.5, 105, 51.4)
price_range.set_extend_lines(False, False)
price_range.set_fill_enabled(True)

# Open Chart
chart.open()