v1.2.0
Heatmap
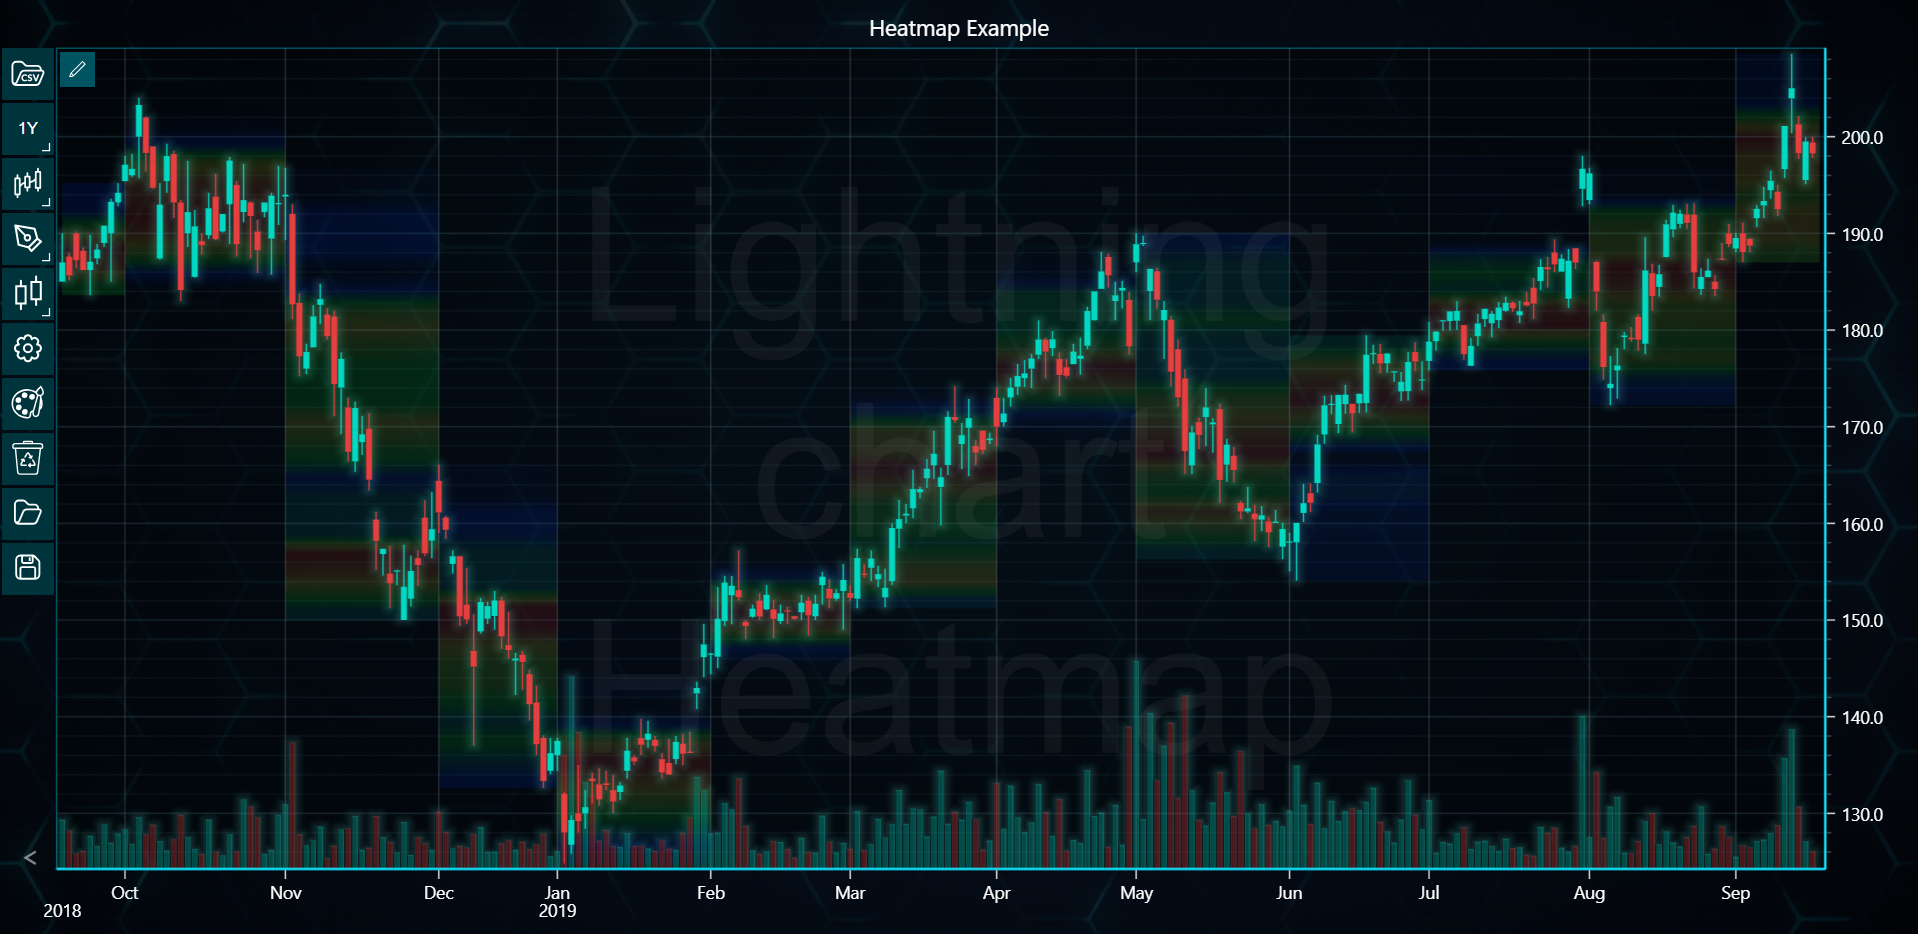
In the example below, you can explore how to create a Heatmap using the LightningChart Python Trader. Full code and dataset are provided at the bottom of the page.
import csv
from lightningchart_trader import TAChart
from datetime import datetime

LICENSE_KEY_PATH = "license_key.txt"
DATA_PATH = "DemoData2.csv"

# Load the license key
license_key = open(LICENSE_KEY_PATH).read()

# Initialize the TAChart
chart = TAChart(license_key)
chart.set_color_theme('turquoiseHexagon')
chart.show_searchbar(False)

# Load the CSV file
chart.load_csv(DATA_PATH)

# Extract data from the CSV
dates = []
highs = []
lows = []
volumes = []

# Add volume indicator to the chart
chart.add_volume()

# Set chart title
chart.set_chart_title('Heatmap Example')

# Read data from CSV file
with open(DATA_PATH, 'r') as file:
    csv_reader = csv.DictReader(file)
    for row in csv_reader:
        dates.append(datetime.strptime(row['Date'], '%Y-%m-%d'))
        highs.append(float(row['High']))
        lows.append(float(row['Low']))
        volumes.append(int(row['Volume']))


# Creating heatmap based on high and low values
def create_heatmap(high_values, low_values, start_x, end_x):
    max_value = max(high_values)
    min_value = min(low_values)
    step = 2
    step_count = int((max_value - min_value) / step) + 1

    # Initialize node values for the heatmap
    node_values = [0] * step_count
    for i in range(len(high_values)):
        for j in range(step_count):
            if (
                min_value + (j + 1) * step >= low_values[i]
                and min_value + j * step <= high_values[i]
            ):
                node_values[j] += 1

    heatmap_values = [node_values, node_values]
    highest_node = max(node_values)

    # Add the heatmap series
    heatmap = chart.add_heatmap(
        start_x=start_x,
        start_y=min_value,
        end_x=end_x,
        end_y=max_value,
        data_values=heatmap_values,
    )

    # Modify the heatmap color palette
    heatmap.set_palette(
        [
            {'value': 0, 'color': '#00000000'},
            {'value': highest_node * 0.25, 'color': '#0032FF1E'},
            {'value': highest_node * 0.5, 'color': '#00FF321E'},
            {'value': highest_node * 0.75, 'color': '#FFFF321E'},
            {'value': highest_node, 'color': '#FF32321E'},
        ]
    )


# Loop through each month and create a heatmap
current_month = dates[0].month
prev_index = 0

for i in range(1, len(dates)):
    if dates[i].month != current_month:
        create_heatmap(highs[prev_index:i], lows[prev_index:i], prev_index, i)
        current_month = dates[i].month
        prev_index = i

# Creating heatmap for the last month's data
create_heatmap(highs[prev_index:], lows[prev_index:], prev_index, len(dates))

chart.show_symbol_watermark(True)
chart.set_watermark_text('Lightning chart Heatmap')

# Open the chart
chart.open()