v1.2.0
Dashboard
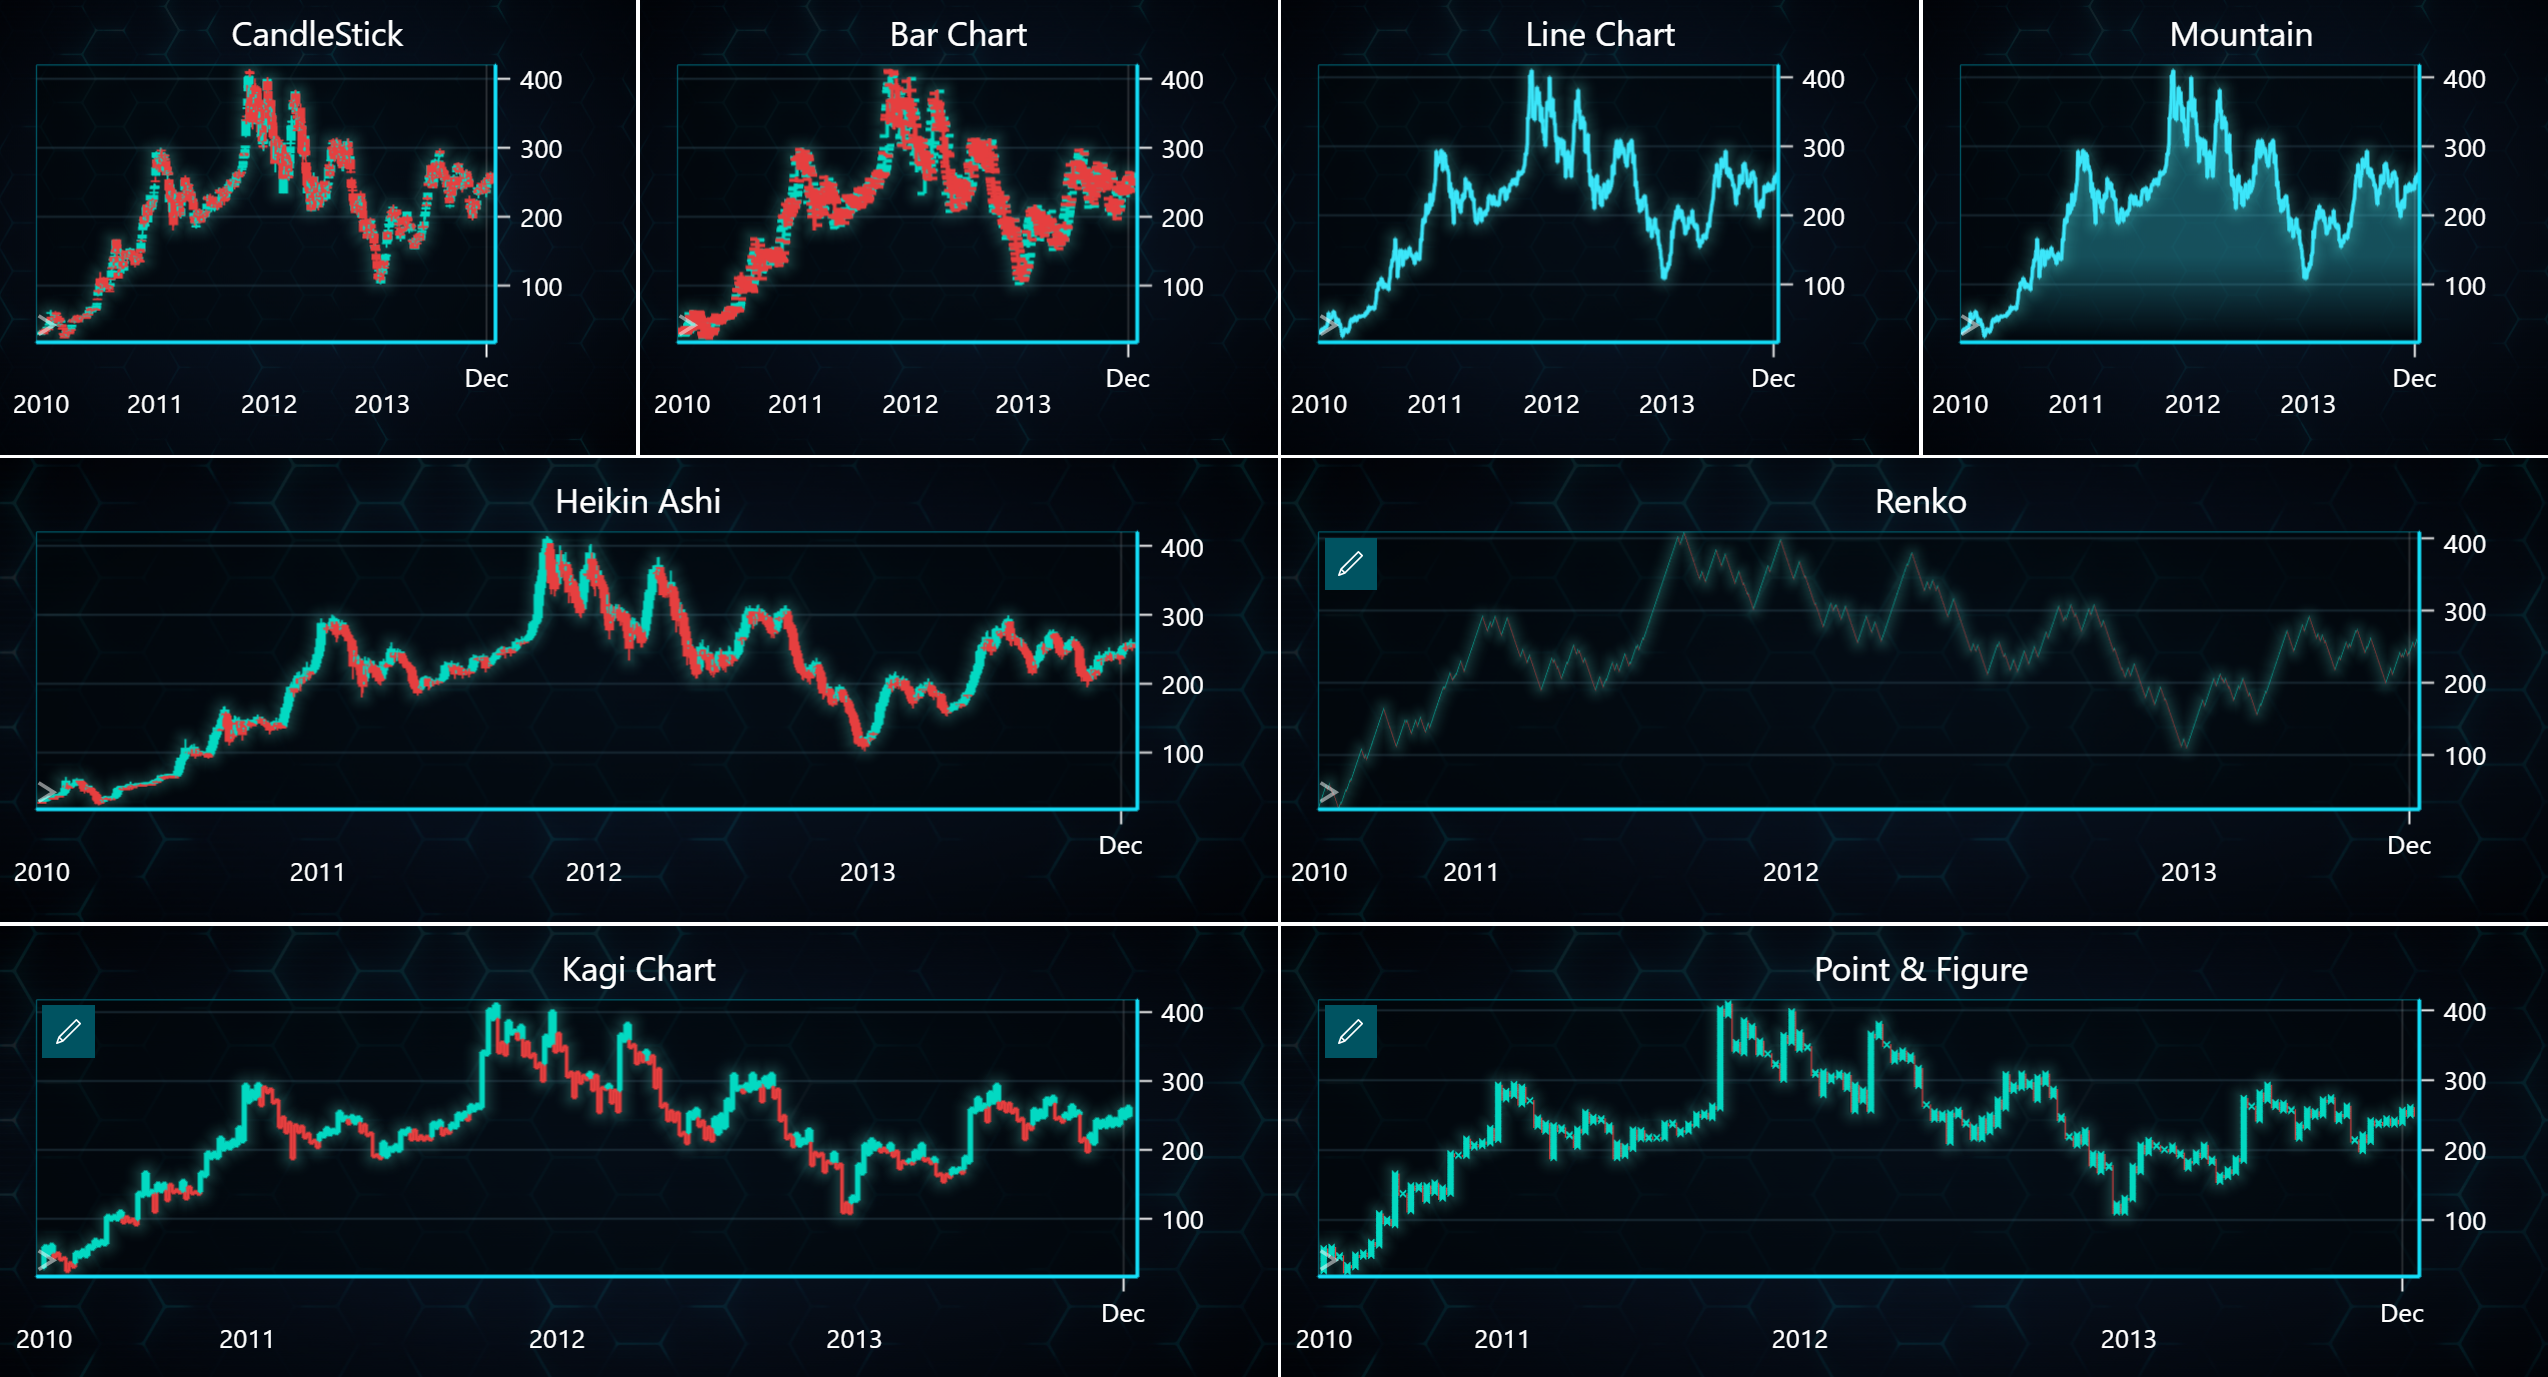
Here is a complete example showing how to create a dashboard containing all major chart types using the LightningChart Python Trader. Full code and dataset are provided at the bottom of the page.
from lightningchart_trader import TAChart

LICENSE_KEY_PATH = "license_key.txt"
DATA_PATH = "Tesla.csv"

# Load the license key
license_key = open(LICENSE_KEY_PATH).read()

trader = TAChart(license_key)

# Creating dashboard
dashboard = trader.create_dashboard(rows=3, cols=4)

# Adding charts to dashboard
Candlestick = dashboard.add_chart(
    chart_type='CandleStick',
    title= 'CandleStick',
    row_index=0,
    column_index=0,
    row_span=1,
    column_span=1
).load_csv(DATA_PATH)

bar_chart = dashboard.add_chart(
    chart_type='Bar',
    title='Bar Chart',
    row_index=0,
    column_index=1
).load_csv(DATA_PATH)

line_chart = dashboard.add_chart(
    chart_type='Line',
    title='Line Chart',
    row_index=0,
    column_index=2
).load_csv(DATA_PATH)

mountain_chart = dashboard.add_chart(
    chart_type='Mountain',
    title='Mountain',
    row_index=0,
    column_index=3
).load_csv(DATA_PATH)

heikinAshi_chart = dashboard.add_chart(
    chart_type='HeikinAshi',
    title='Heikin Ashi',
    row_index=1,
    column_index=0,
    column_span=2
).load_csv(DATA_PATH)

renko_chart = dashboard.add_chart(
    chart_type='Renko',
    title='Renko',
    row_index=1,
    column_index=2,
    column_span=2
).load_csv(DATA_PATH)

kagi_chart = dashboard.add_chart(
    chart_type='Kagi',
    title='Kagi Chart',
    row_index=2,
    column_index=0,
    row_span=1,
    column_span=2
).load_csv(DATA_PATH)

pointAndFigure_chart = dashboard.add_chart(
    chart_type='PointAndFigure',
    title='Point & Figure',
    row_index=2,
    column_index=2,
    column_span=2
).load_csv(DATA_PATH)

# You can use load_csv_to_all_charts method instead of adding the same CSV file to all charts one by one
# dashboard.load_csv_to_all_charts(DATA_PATH)

trader.open()