v1.2.0
Statistical Indicators
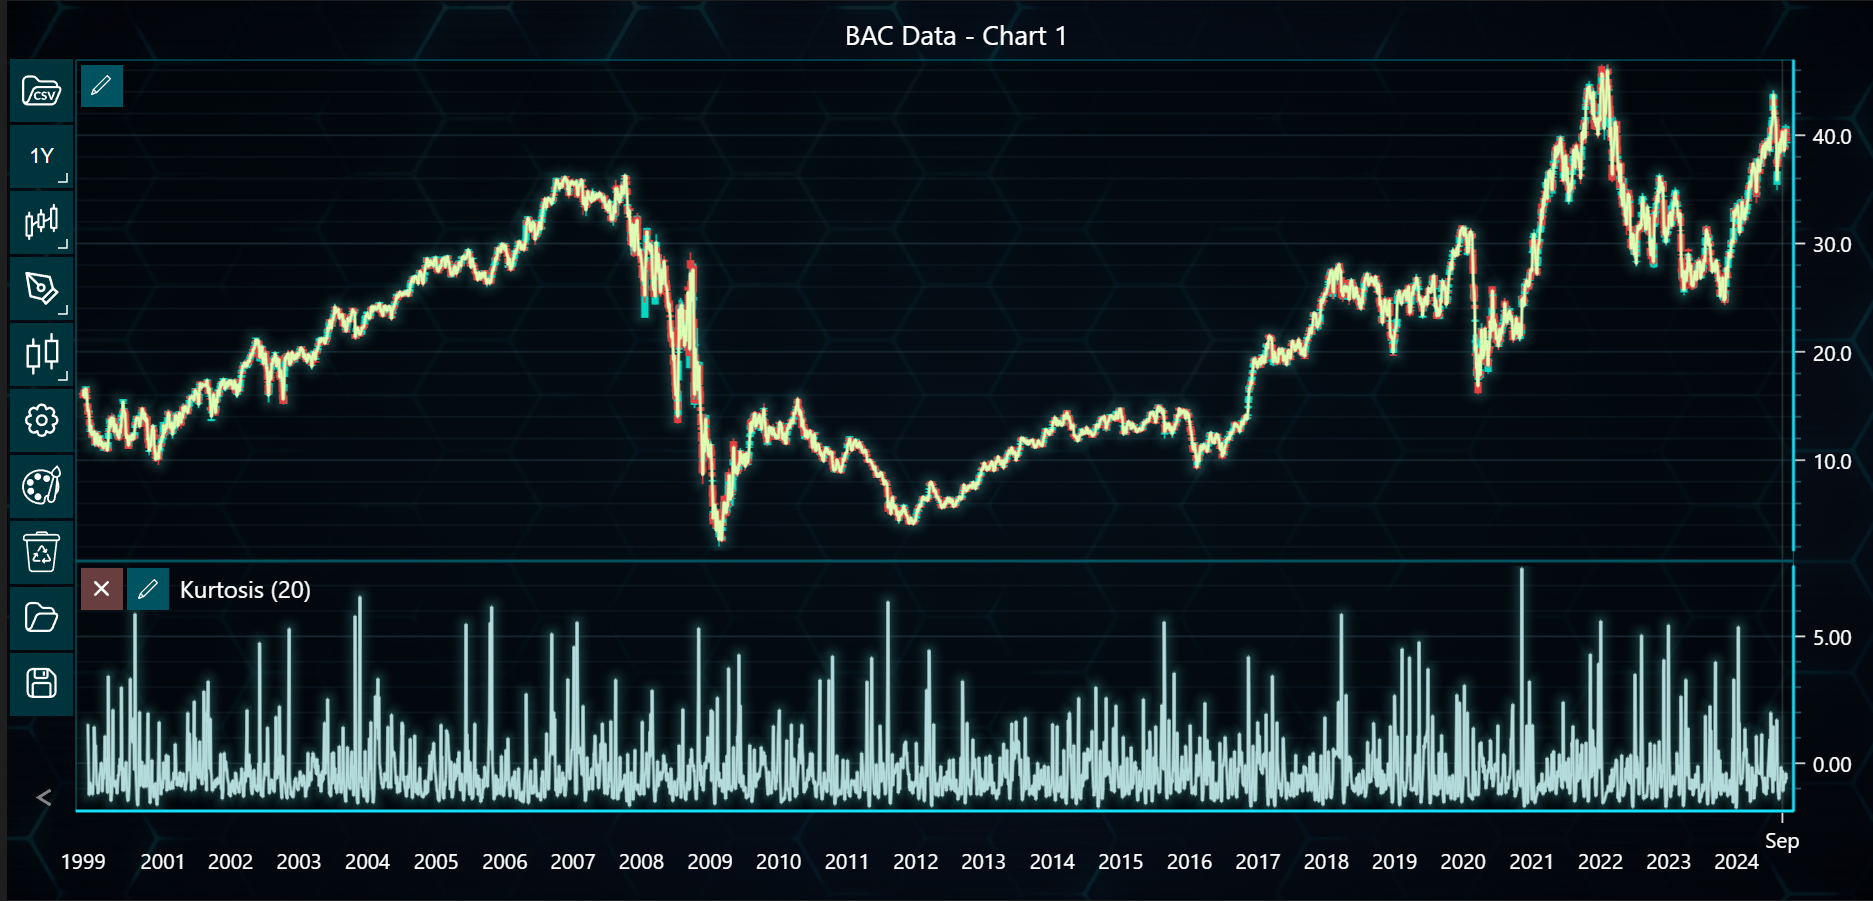
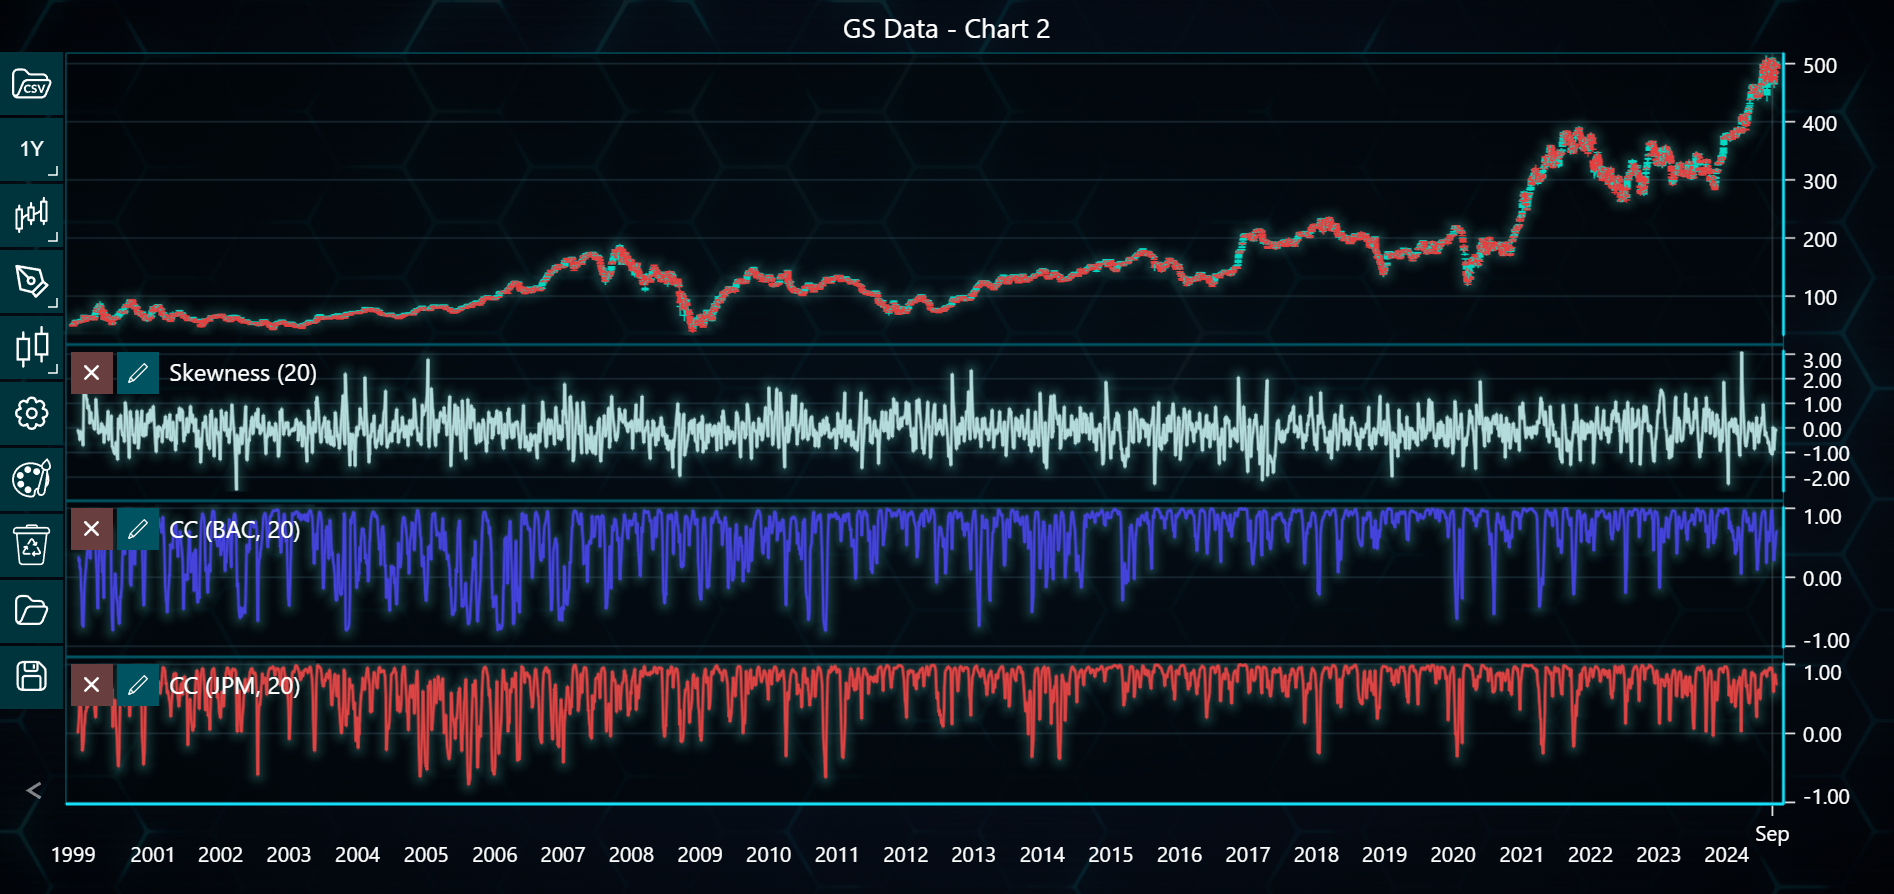
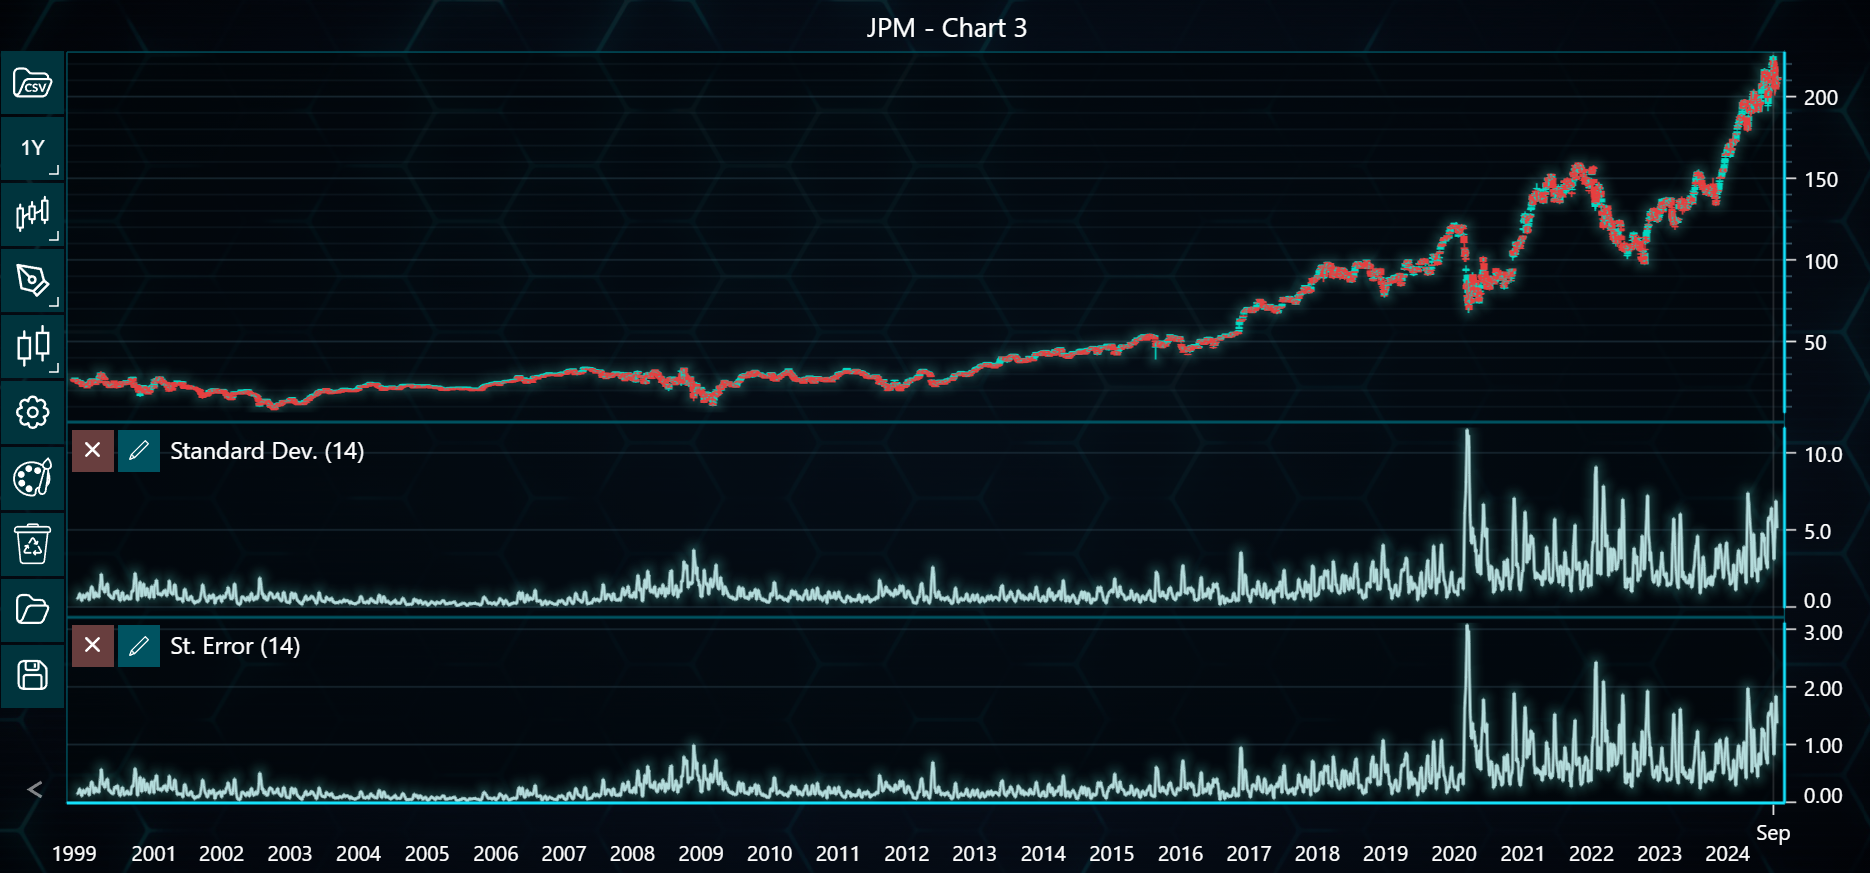
This example demonstrates how to use statistical indicators such as kurtosis, skewness, standard deviation, and correlation coefficients across multiple datasets (BAC, GS, JPM) in LightningChart Python Trader. Full code and datasets are included for download.
Download 'Bank of America Corp (BAC).csv'
Download 'The Goldman Sachs Group (GS).csv'
Download 'JPMorgan Chase & Co (JPM).csv'
from lightningchart_trader import TAChart
from lightningchart_trader.helper_routines import convert_to_xohlc

LICENSE_KEY_PATH = 'license_key.txt'
BAC_DATA_PATH = 'Bank of America Corp (BAC).csv'
GS_DATA_PATH = 'The Goldman Sachs Group (GS).csv'
JPM_DATA_PATH = 'JPMorgan Chase & Co (JPM).csv'

# Load the license key
license_key = open(LICENSE_KEY_PATH).read()

# Initialize Trading chartlications
chart1 = TAChart(license_key=license_key)
chart2 = TAChart(license_key=license_key)
chart3 = TAChart(license_key=license_key)

# Load CSV files into TAChart instances
chart1.load_csv(csv=BAC_DATA_PATH, dataset_name='BAC Data - Chart 1')
chart2.load_csv(csv=GS_DATA_PATH, dataset_name='GS Data - Chart 2')
chart3.load_csv(csv=JPM_DATA_PATH, dataset_name='JPM - Chart 3')

xohlc_data_BAC = convert_to_xohlc(BAC_DATA_PATH)
xohlc_data_GS = convert_to_xohlc(GS_DATA_PATH)
xohlc_data_JPM = convert_to_xohlc(JPM_DATA_PATH)


# Configure indicators for each chart
chart1.add_kurtosis()
chart1.add_median_price()

chart2.add_skewness()
cc1 = chart2.add_correlation_coefficient()
cc2 = chart2.add_correlation_coefficient()

chart3.add_standard_deviation(period_count=14)
chart3.add_standard_error(period_count=14)

# Assign Correctly Formatted Data to Correlation Coefficients
cc1.set_dataset(xohlc_data_BAC)
cc1.set_symbol('BAC')
cc1.set_line_color('#4444DD')

# cc2.set_dataset(jpm_data)
cc2.set_dataset(xohlc_data_JPM)
cc2.set_symbol('JPM')
cc2.set_line_color('#DD4444')

# Collect all chart instances in a list
charts = [chart1, chart2, chart3]

# Open all charts
for chart in charts:
    chart.open()