v1.2.0
Moving average indicators
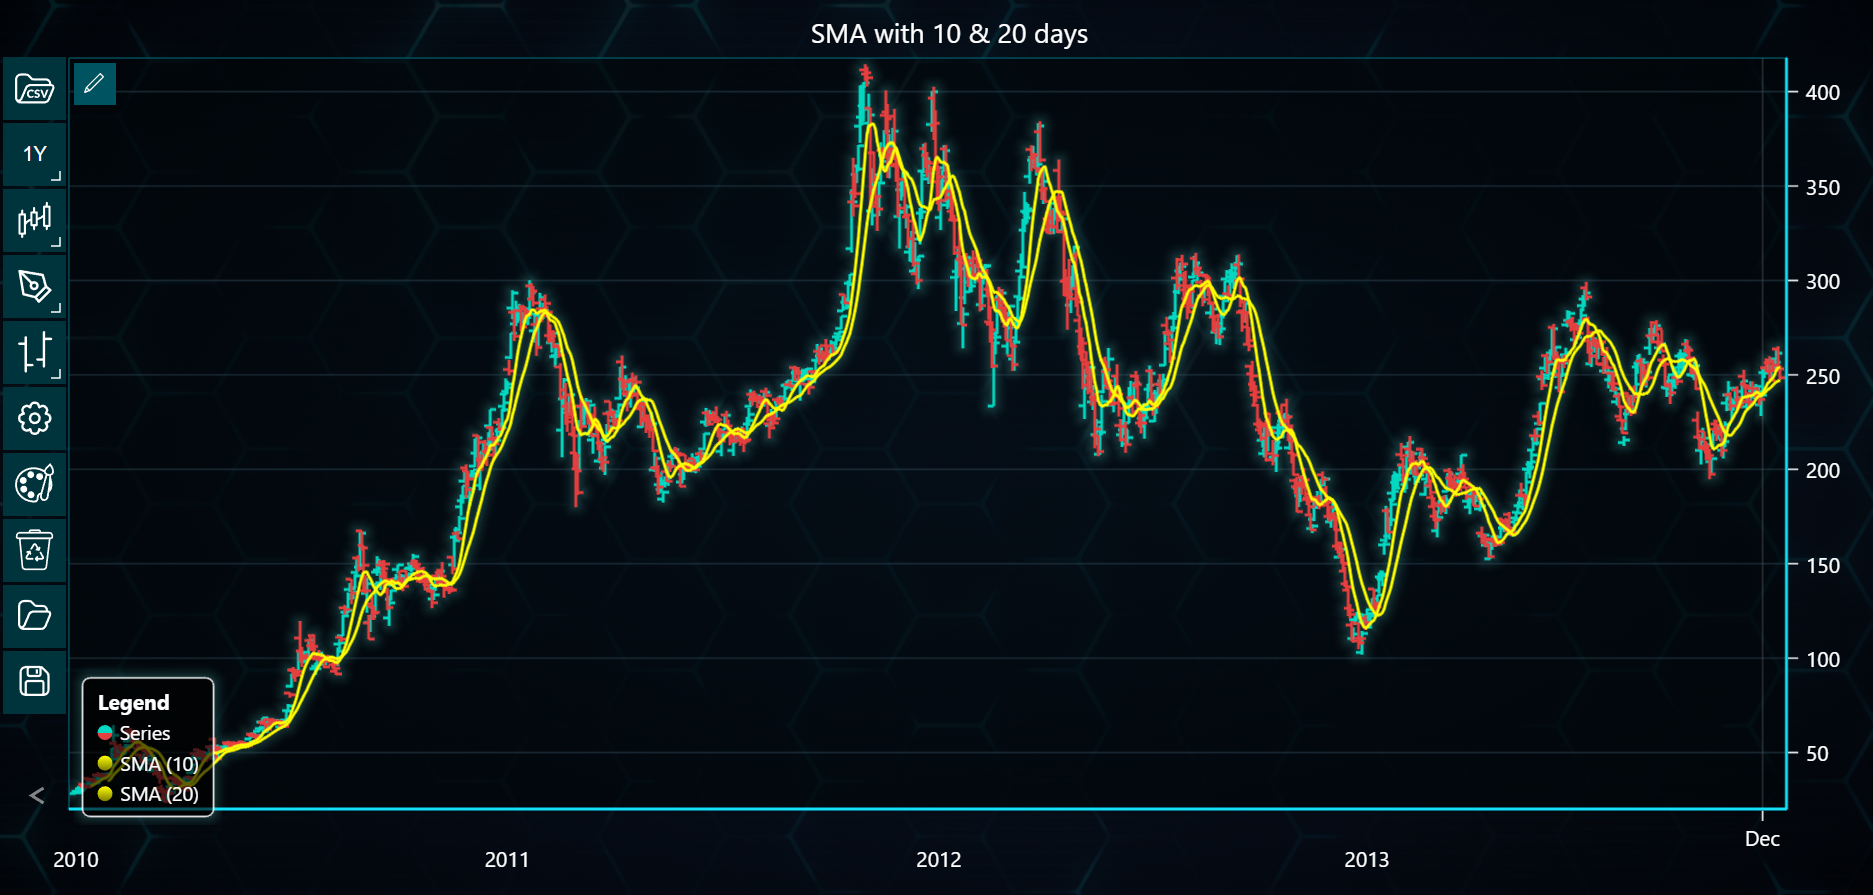
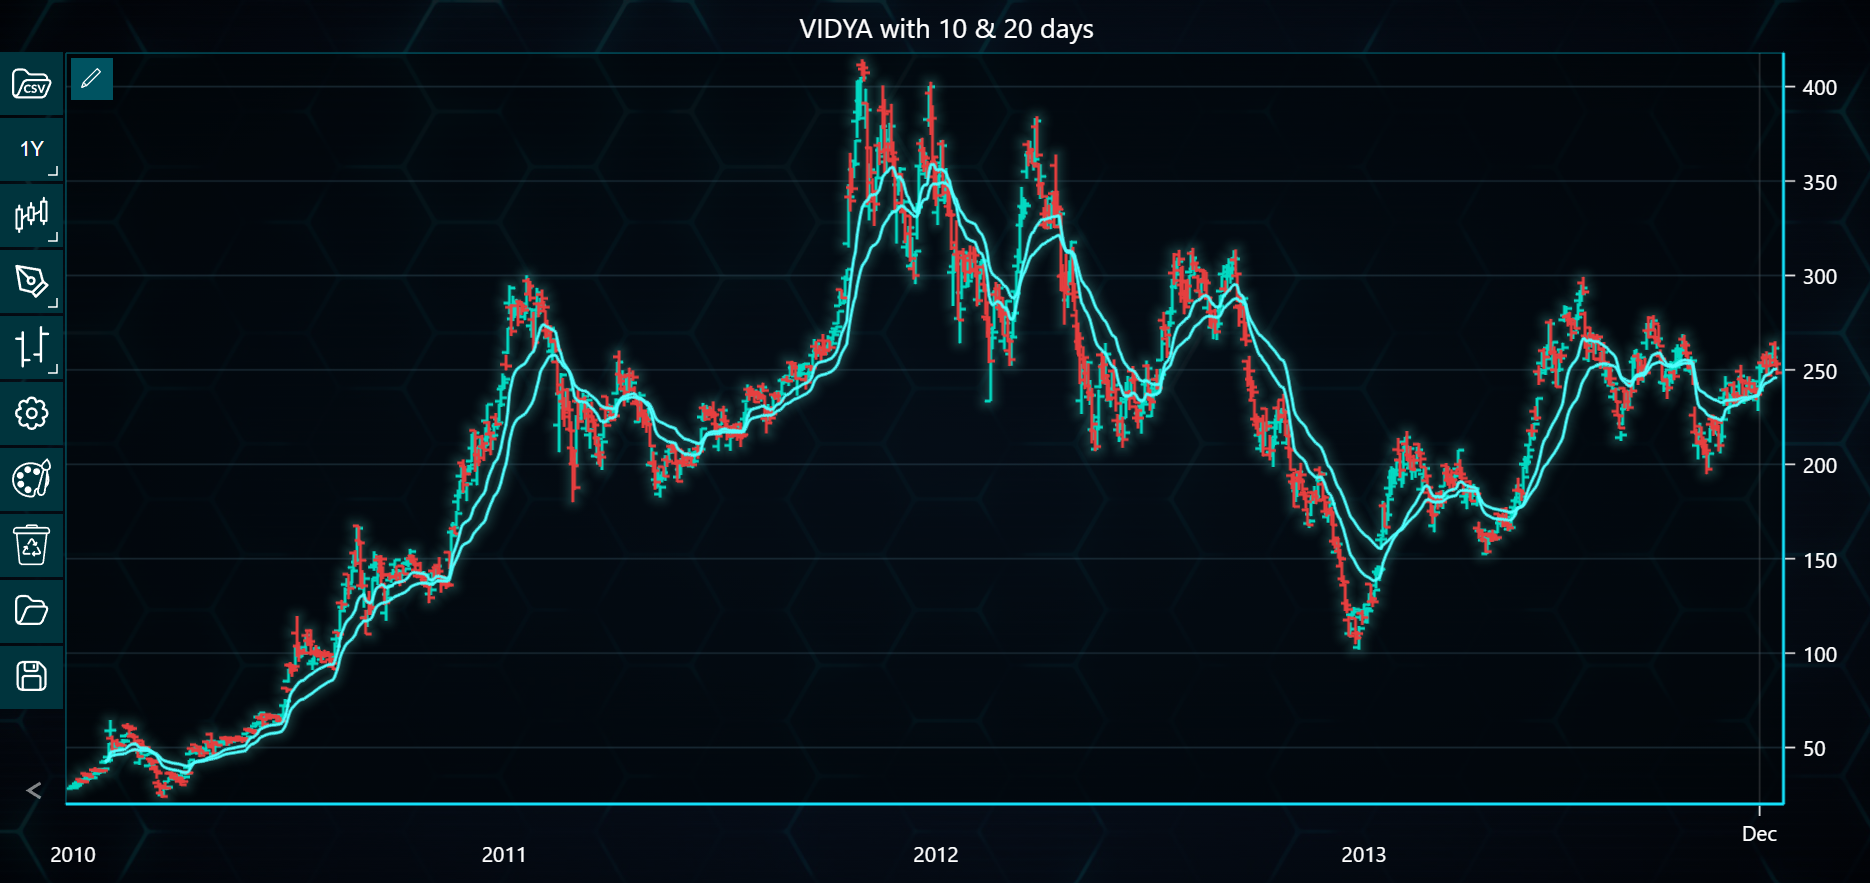
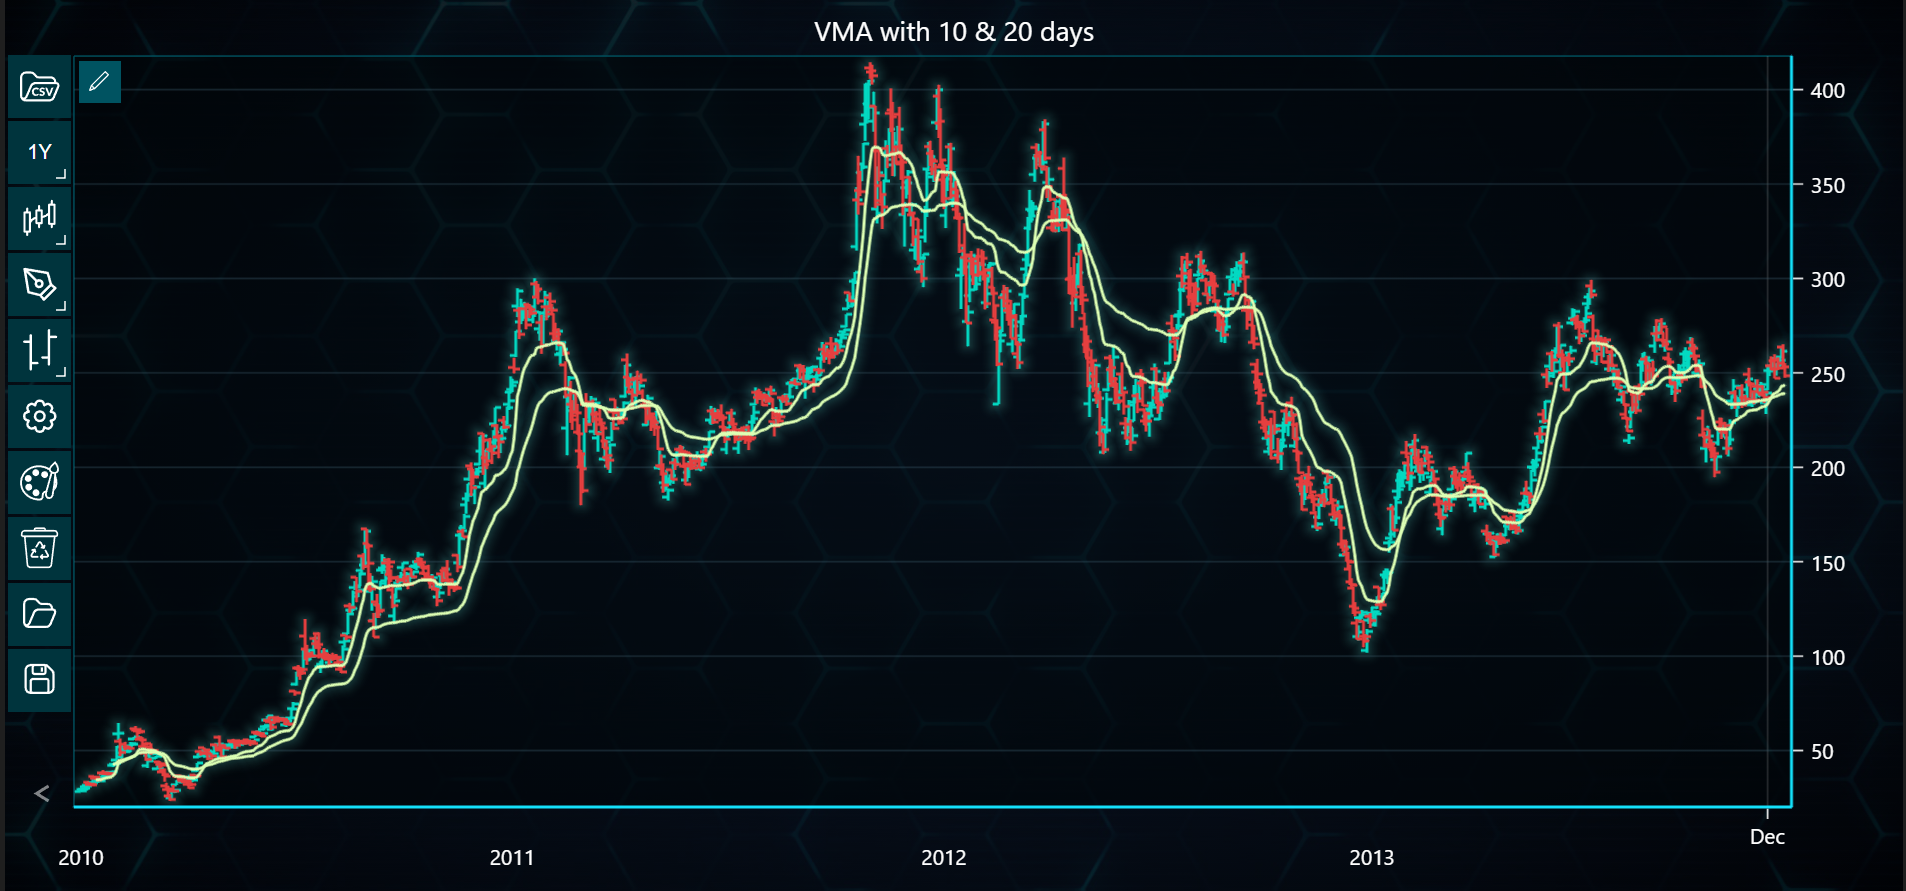
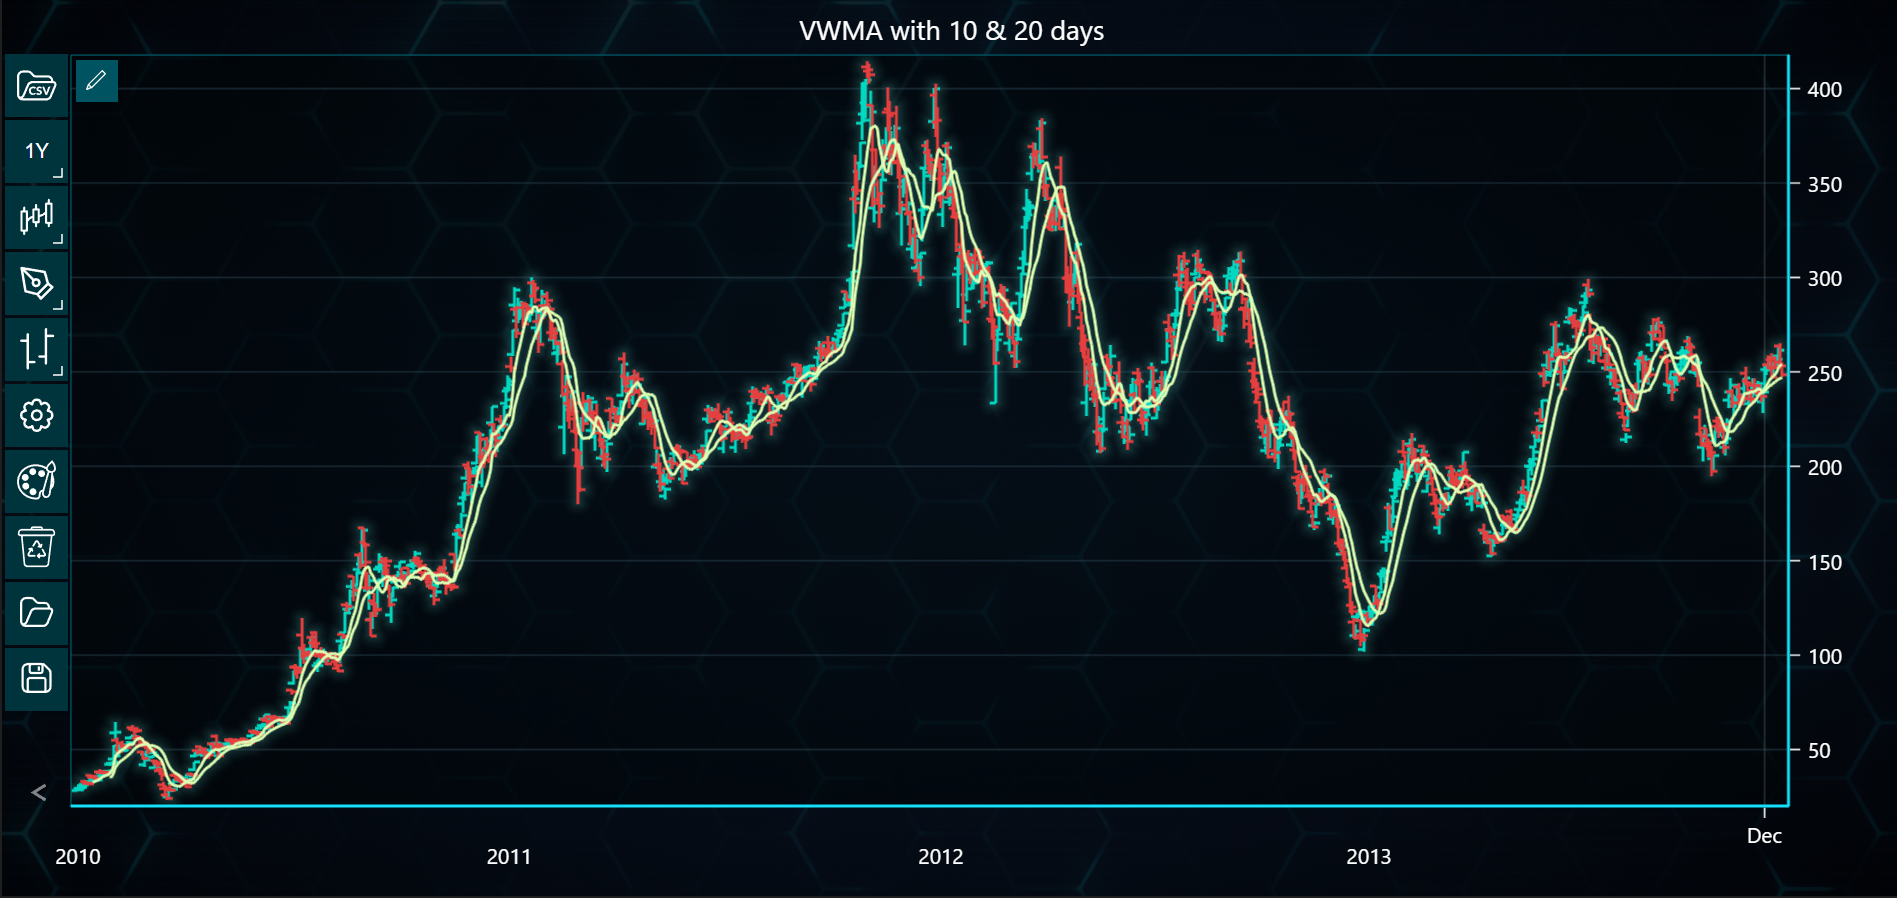
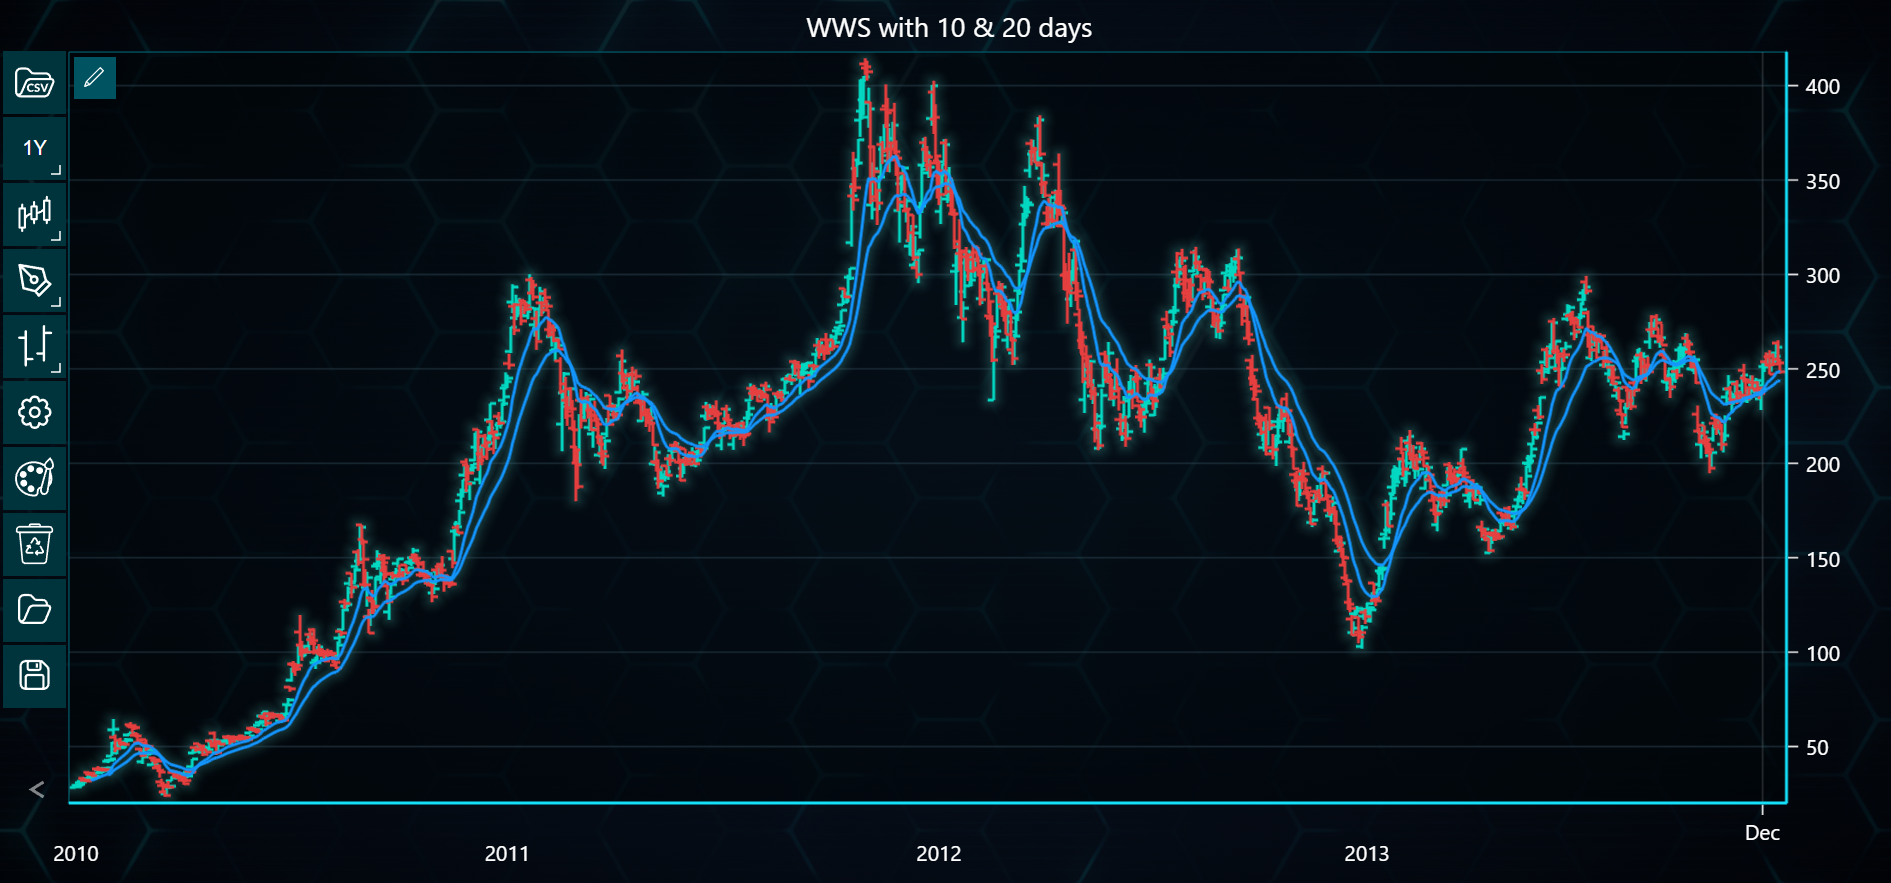
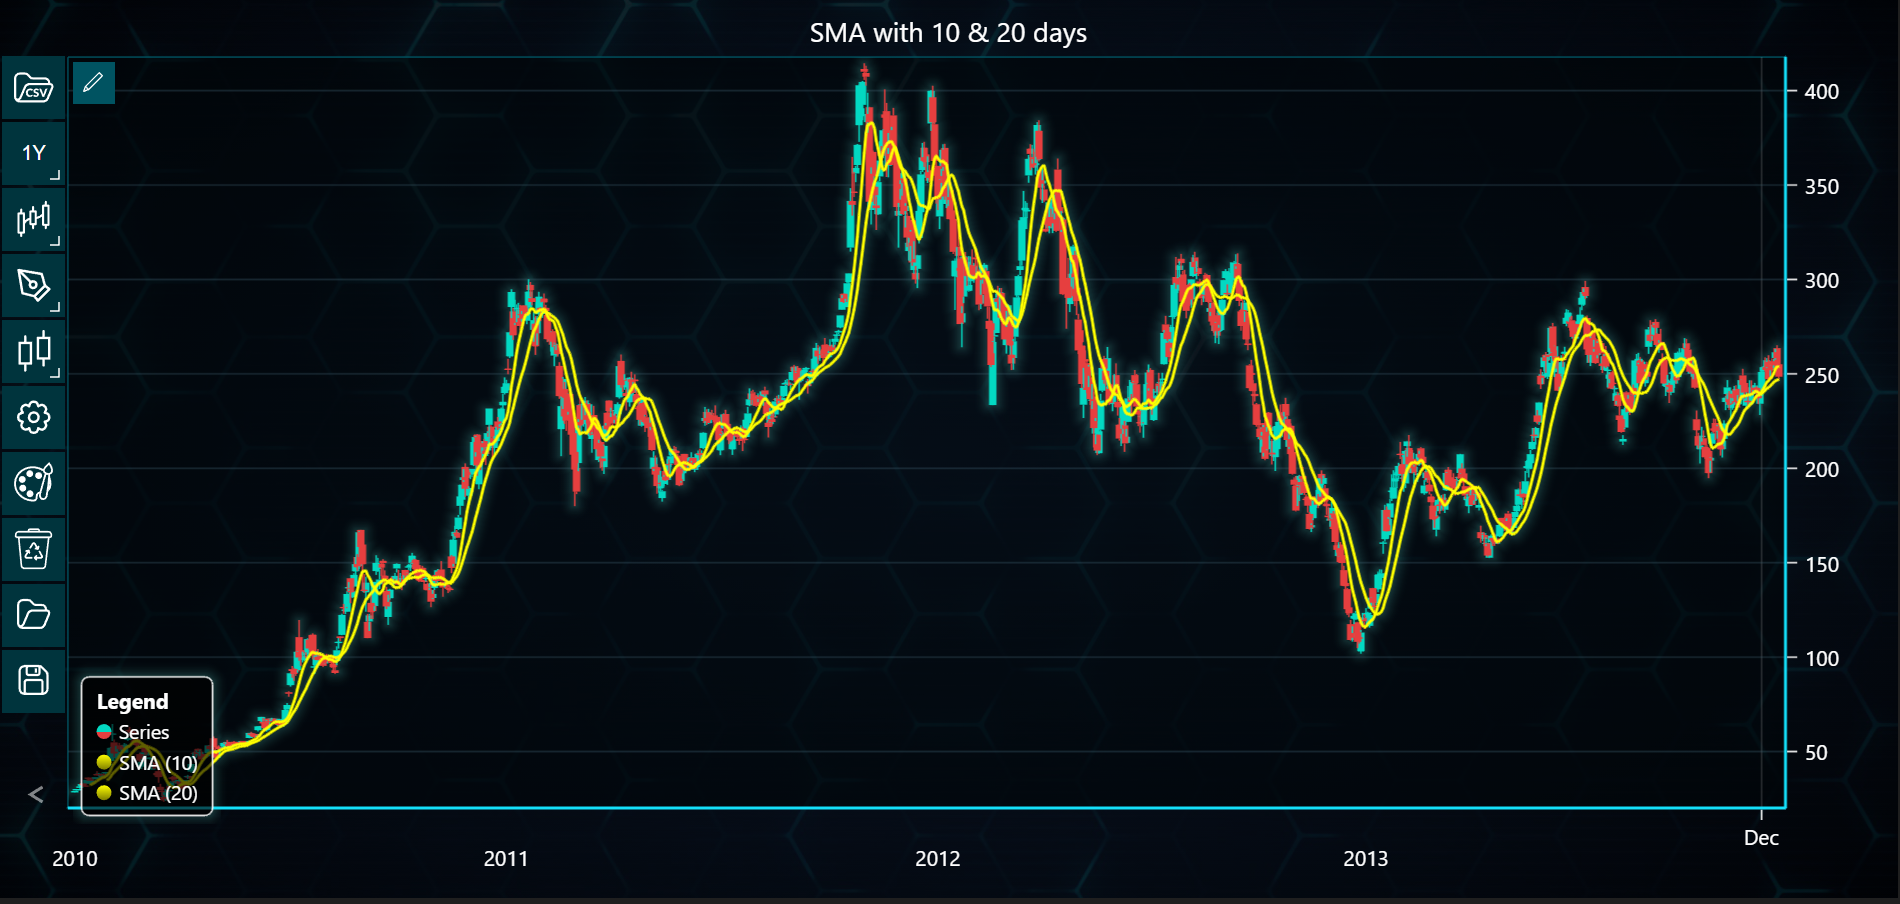
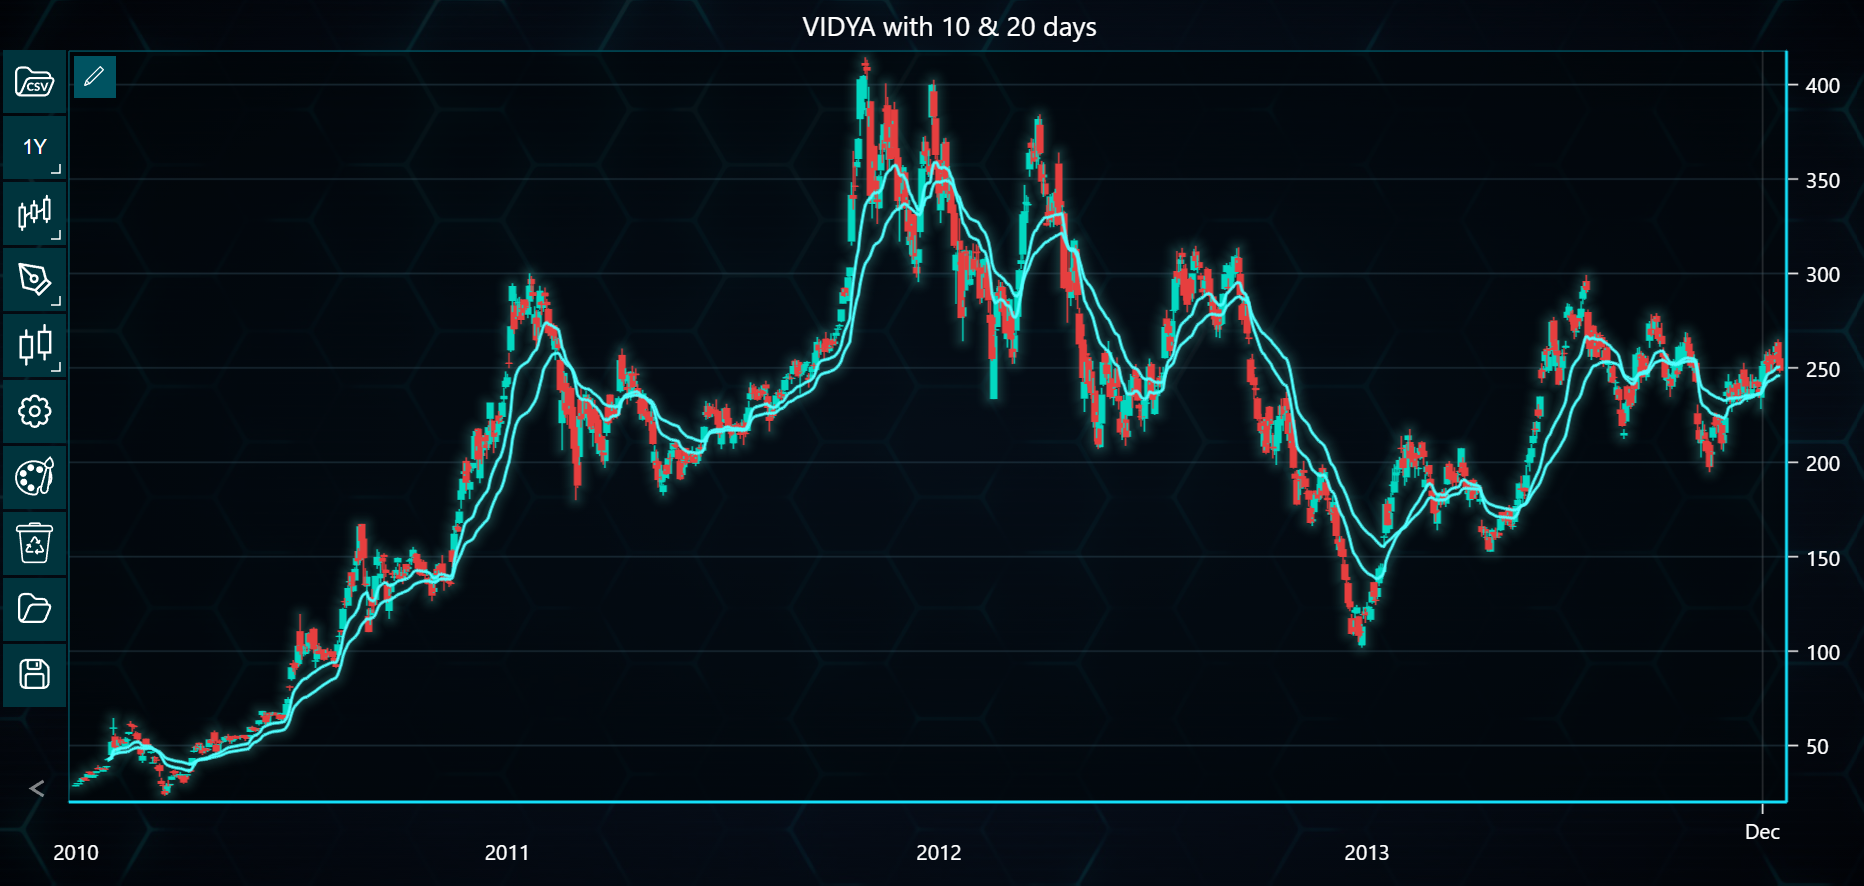
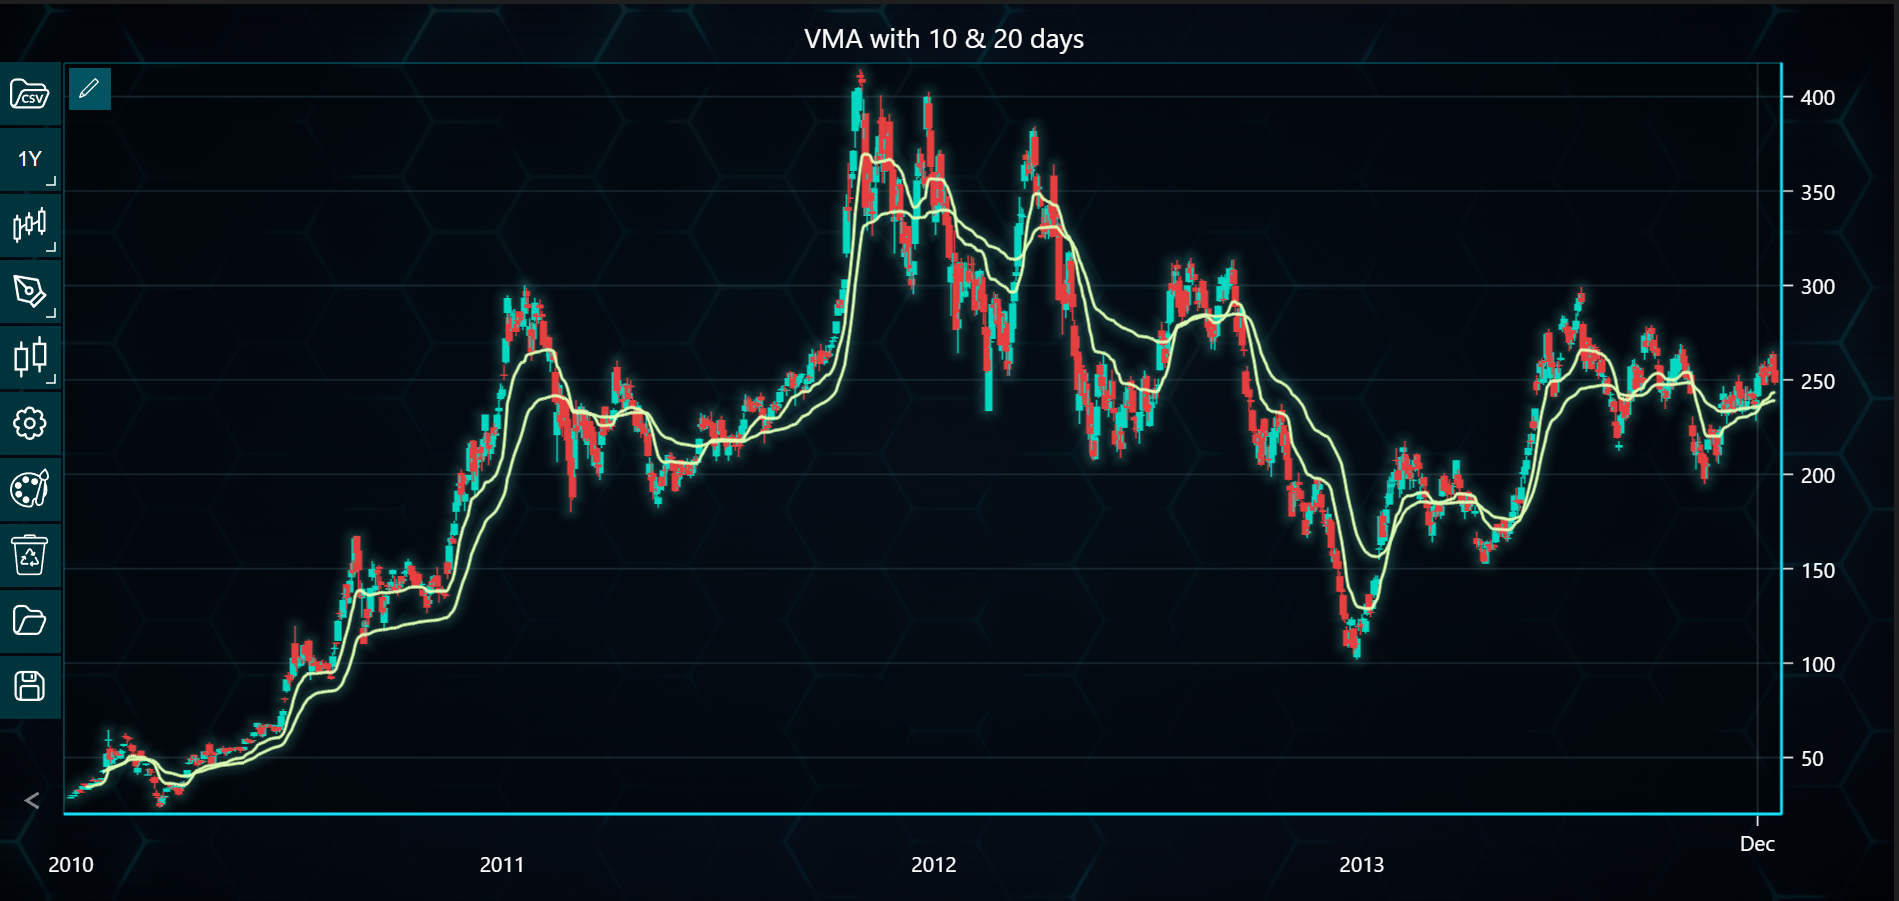
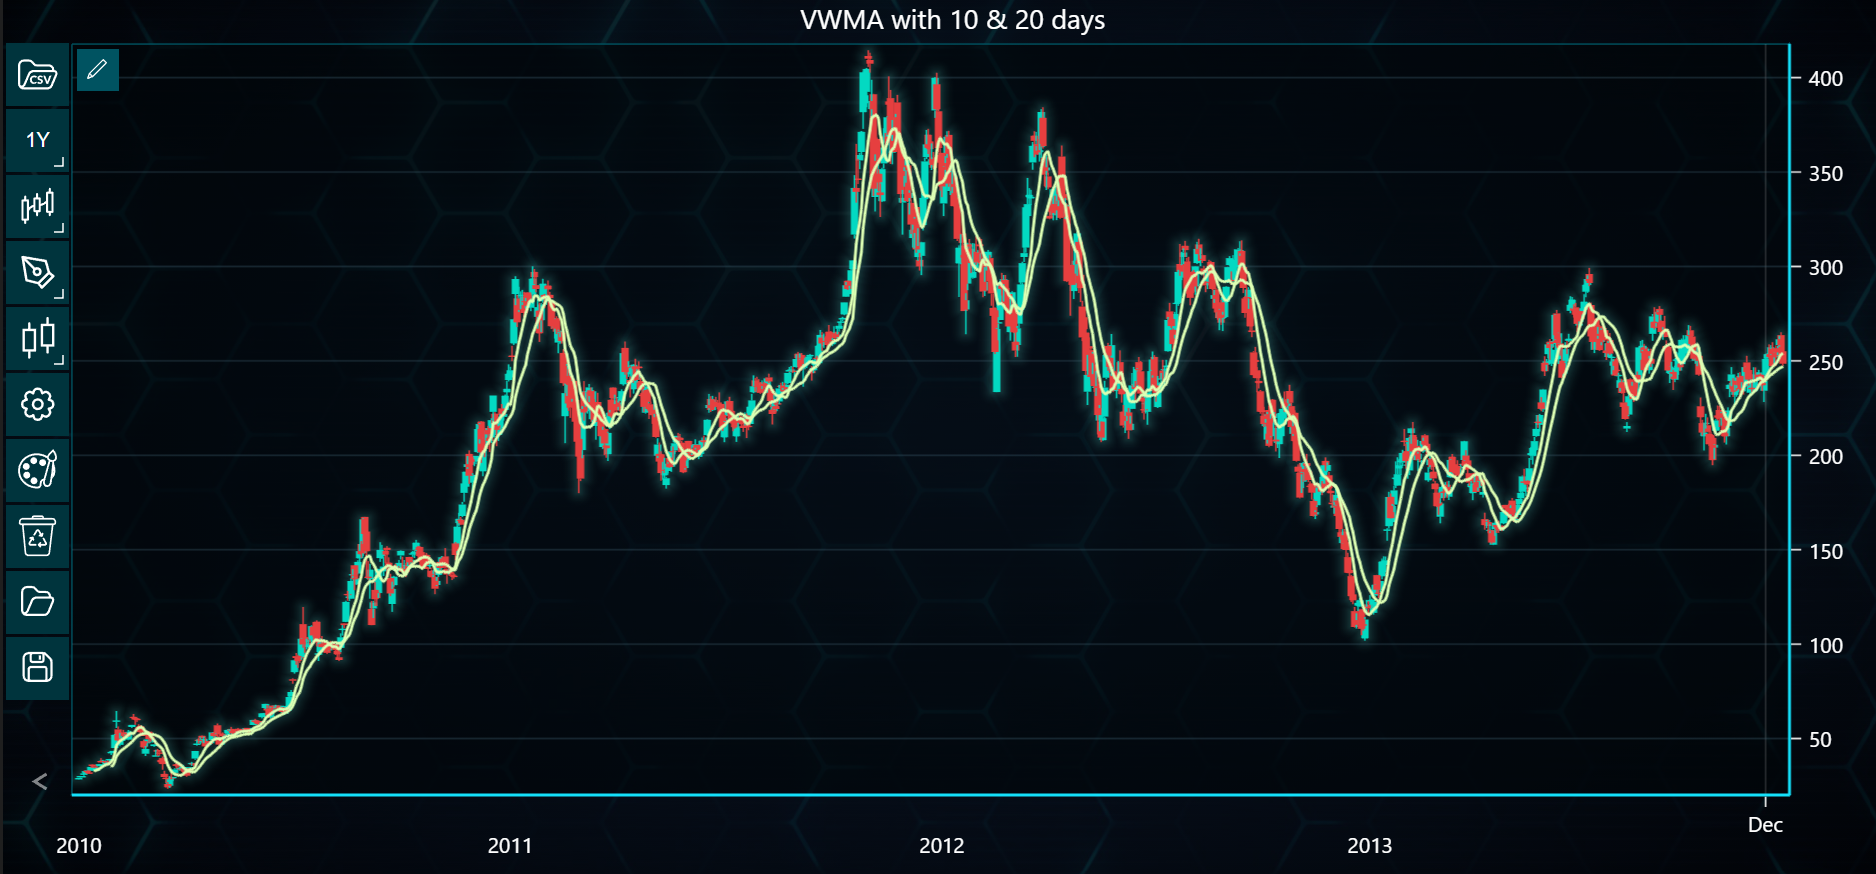
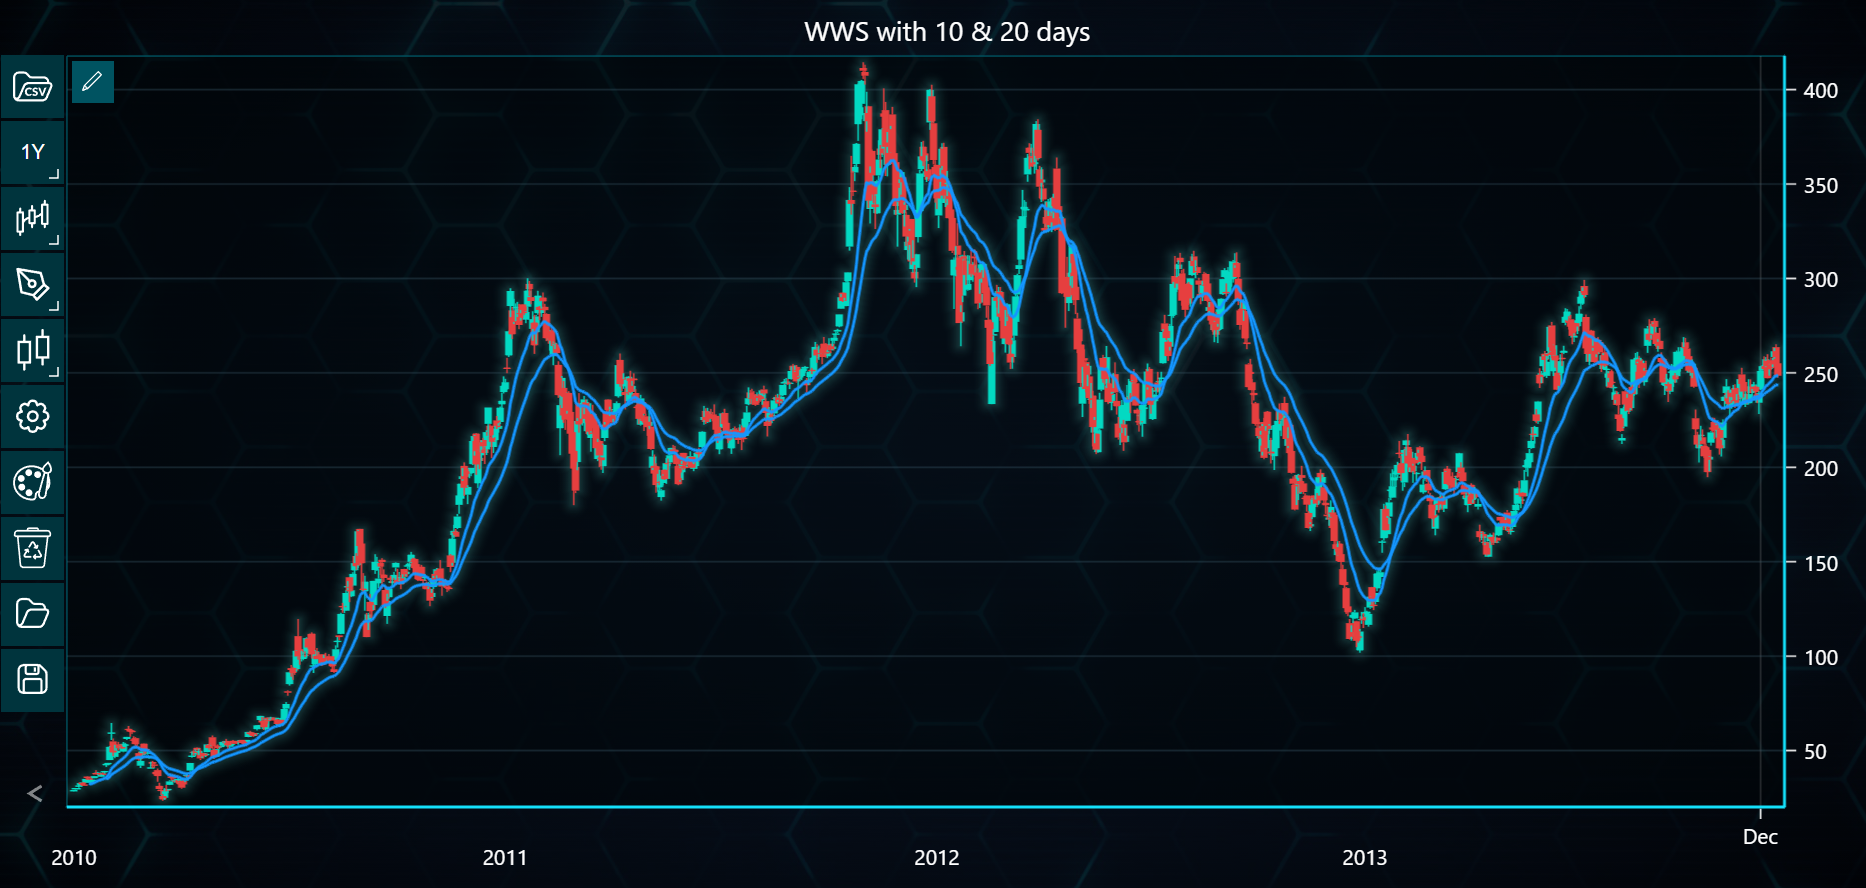
In this guide, you will explore how to visualize eight types of moving average indicators (e.g., SMA, EMA, VWMA) using both CandleStick and Bar charts. You will also find how to apply multiple periods and compare them interactively in LightningChart Python Trader. Full code and dataset are provided at the bottom of the page.
Using CandleStick Chart
from lightningchart_trader import TAChart
LICENSE_KEY_PATH = "license_key.txt"
DATA_PATH = "Tesla.csv"
# Load the license key
license_key = open(LICENSE_KEY_PATH).read()
# Defining chart type
chart_type = 'CandleStick'
# Defining periods for the moving averages
periods = [10, 20]
# List to hold chart instances for each chart
CandleStick_charts = []
# Creating a chart for each indicator
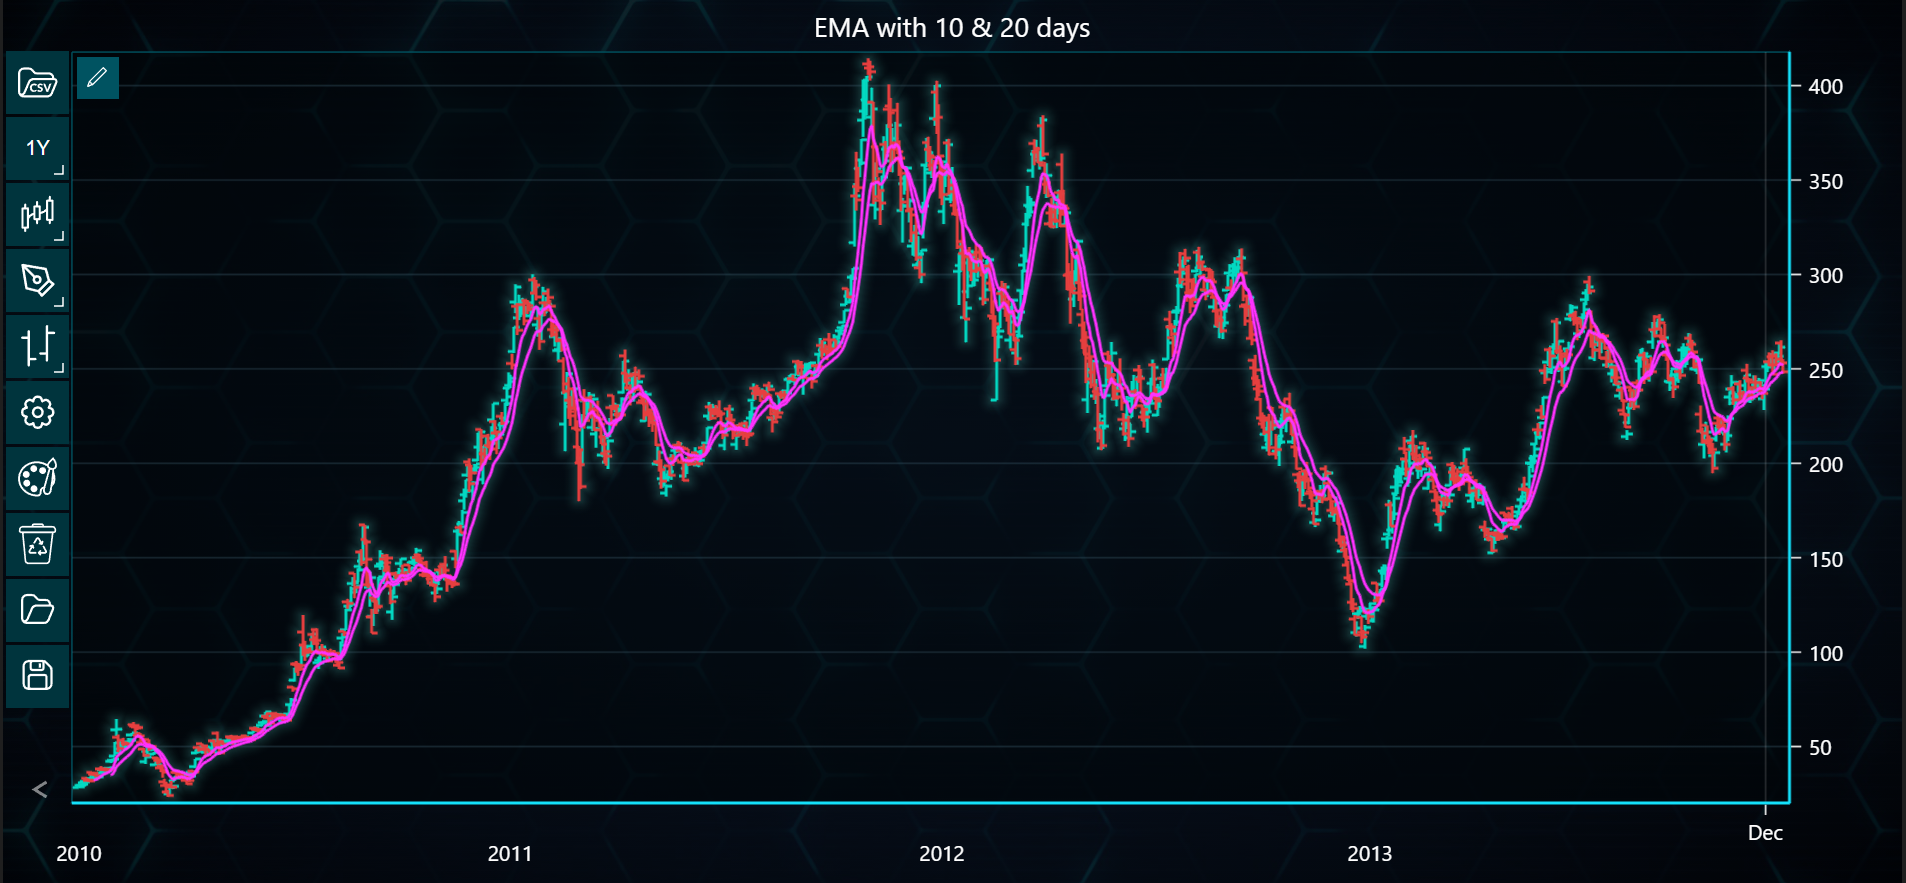
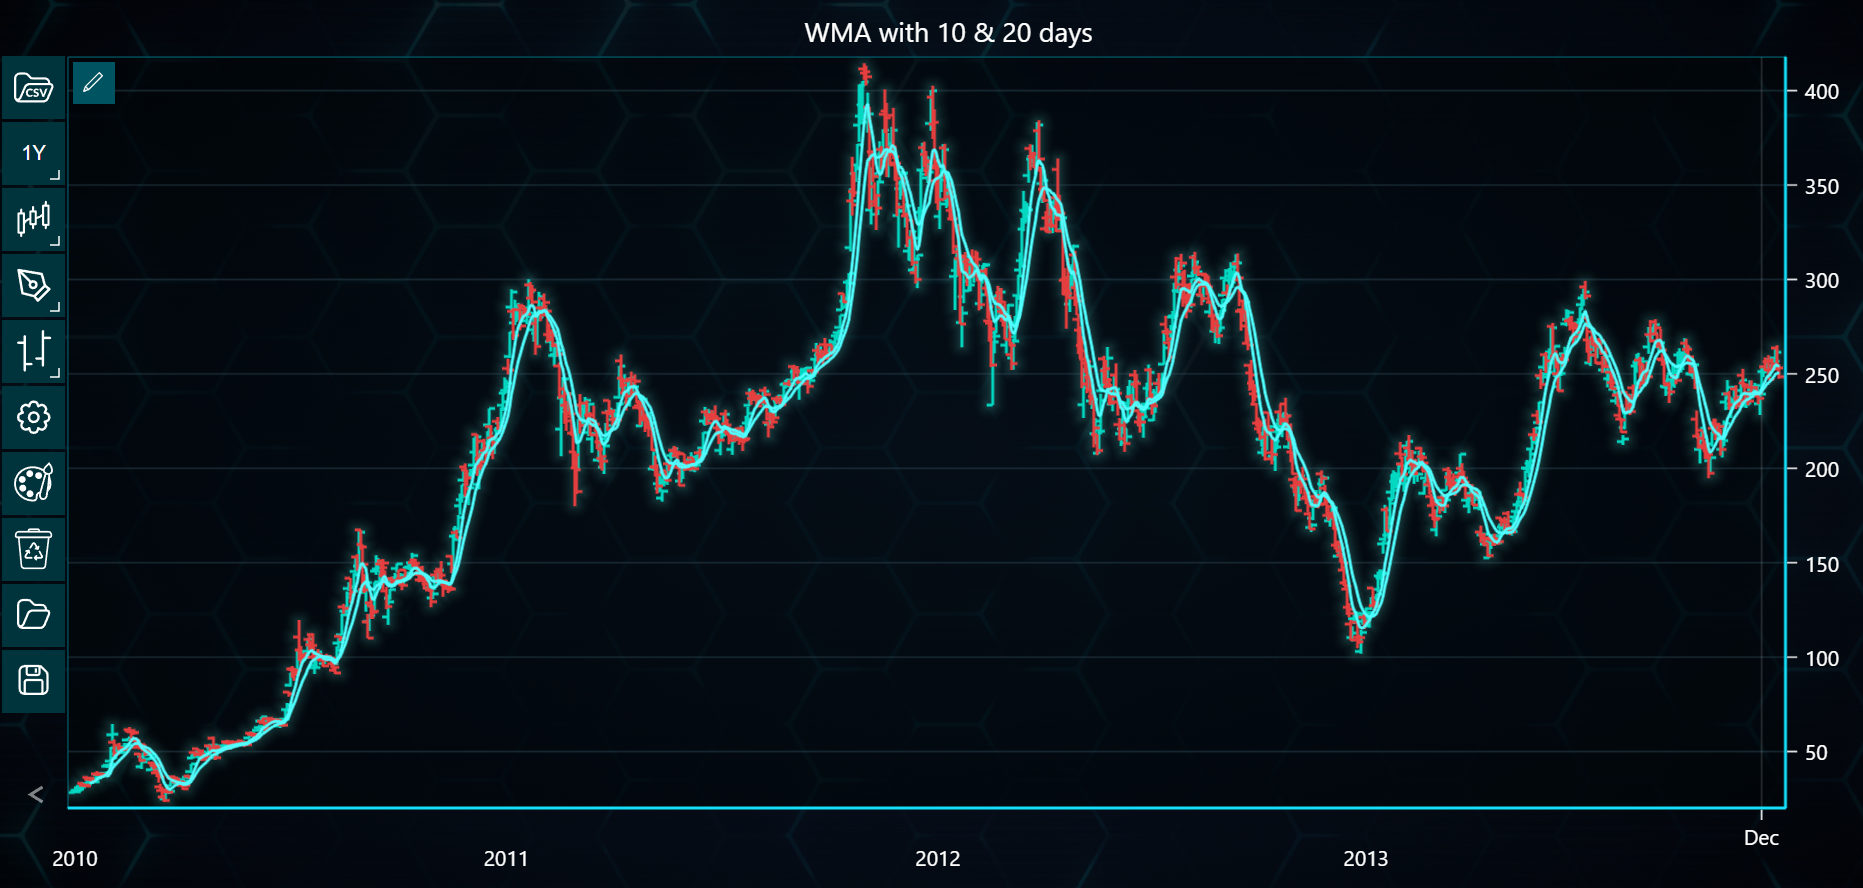
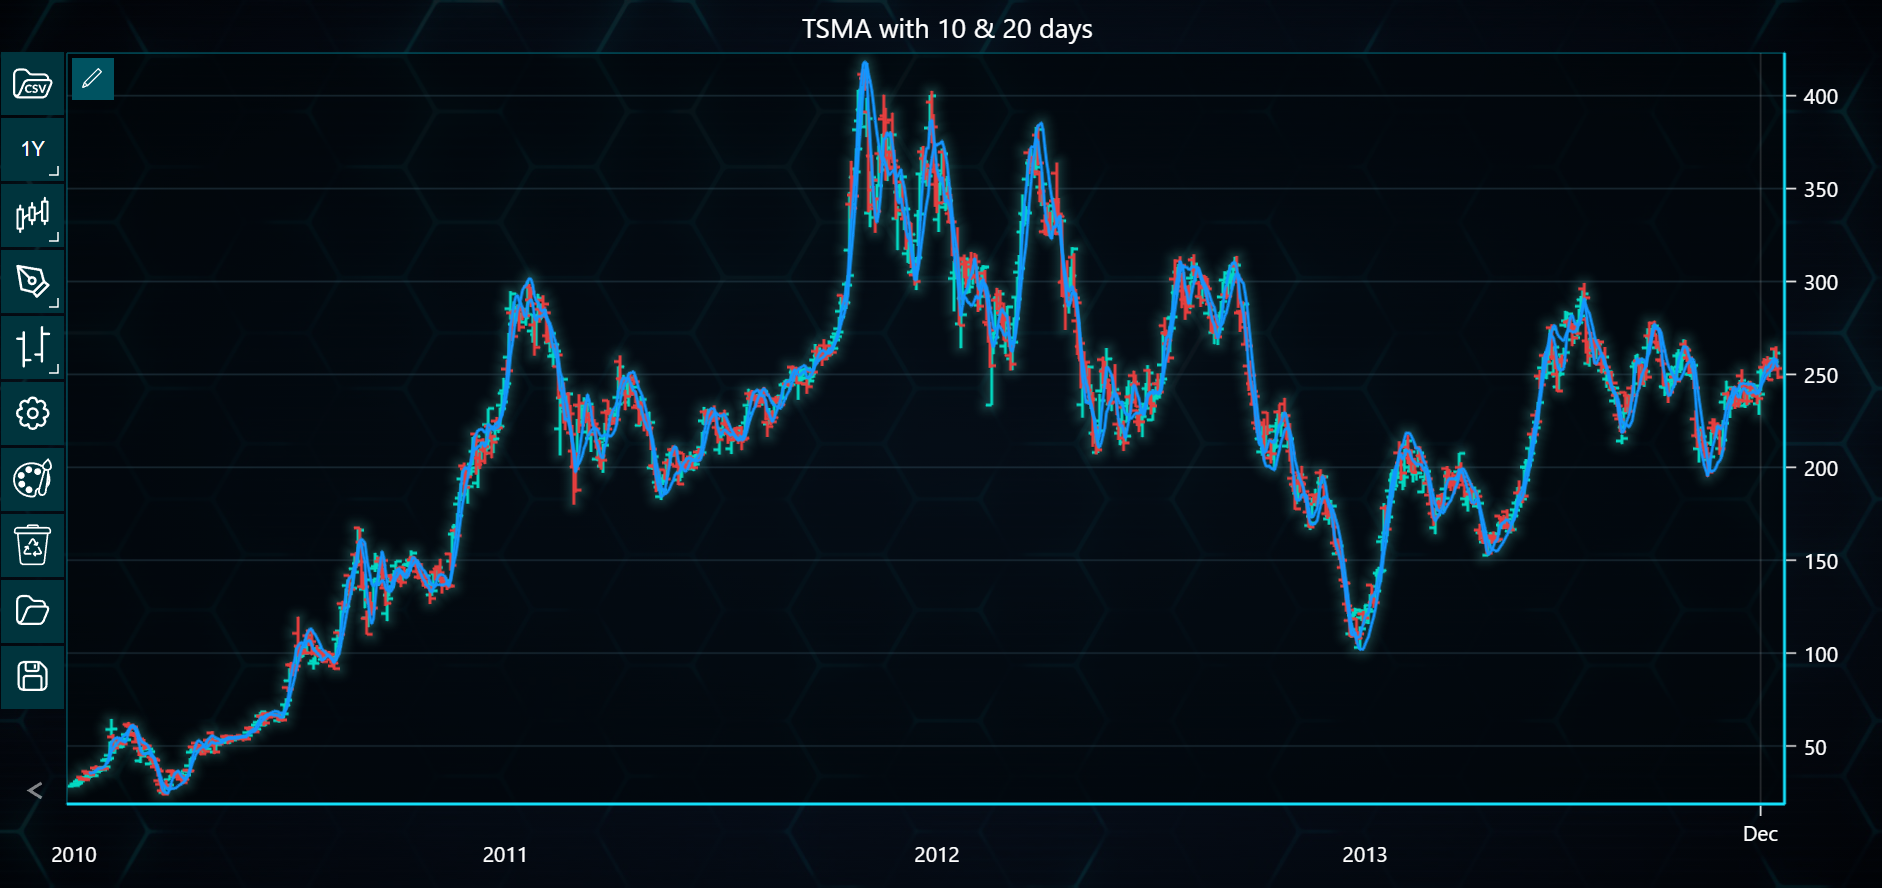
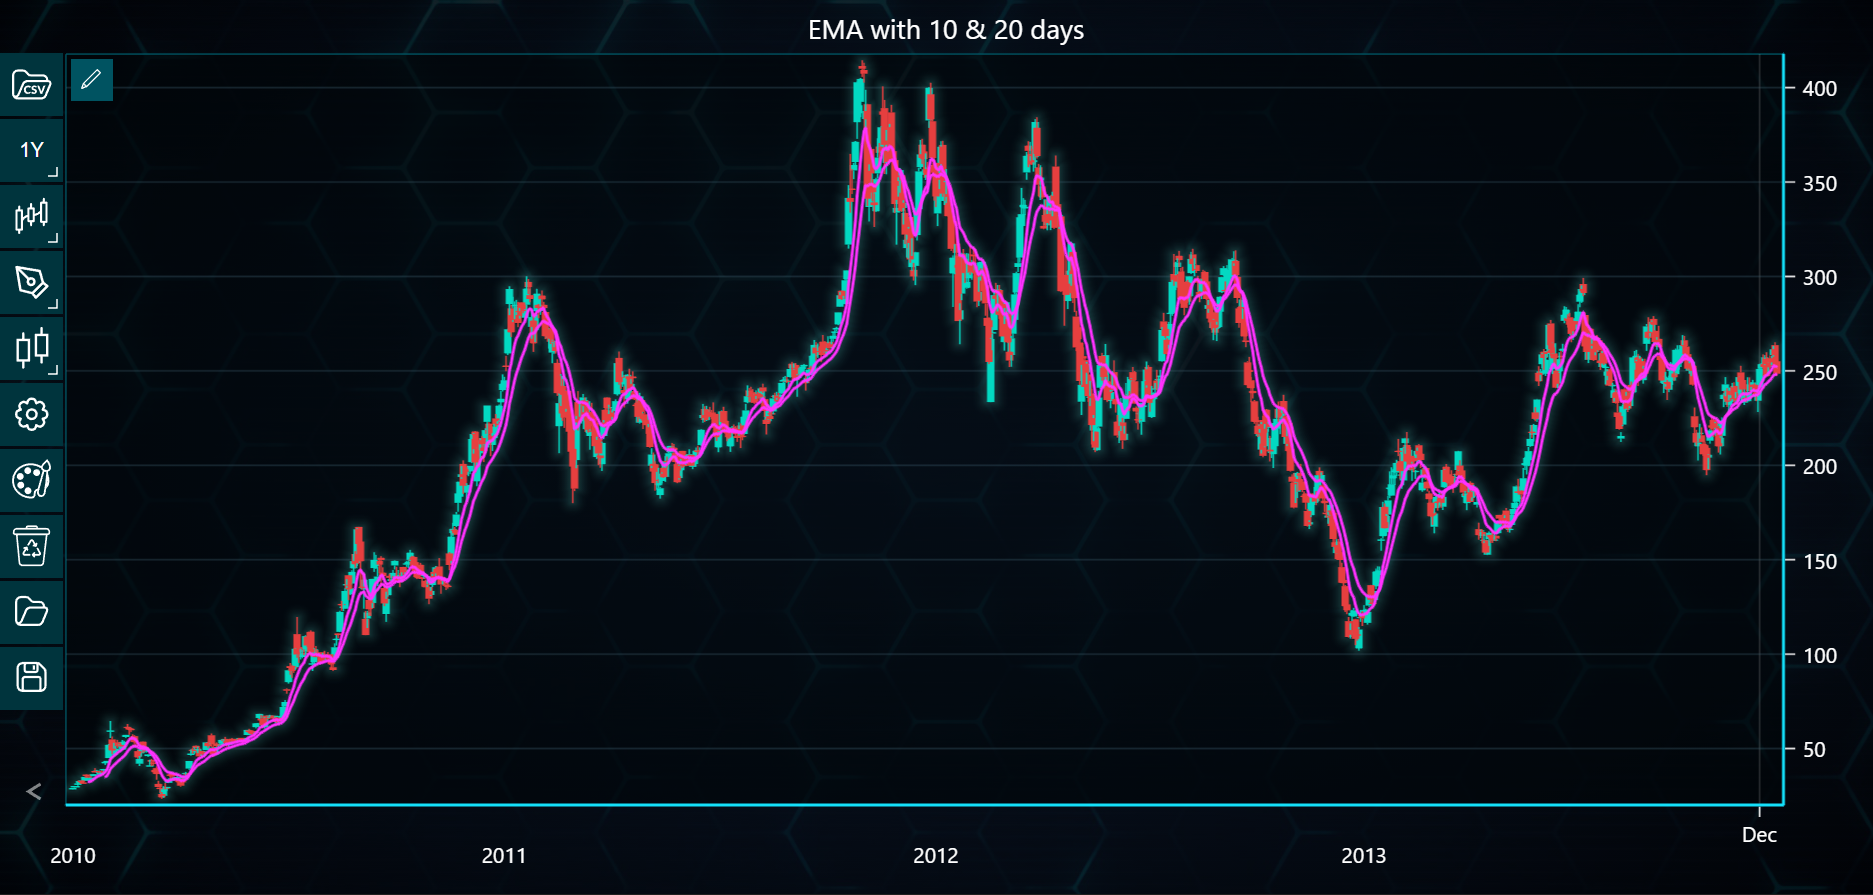
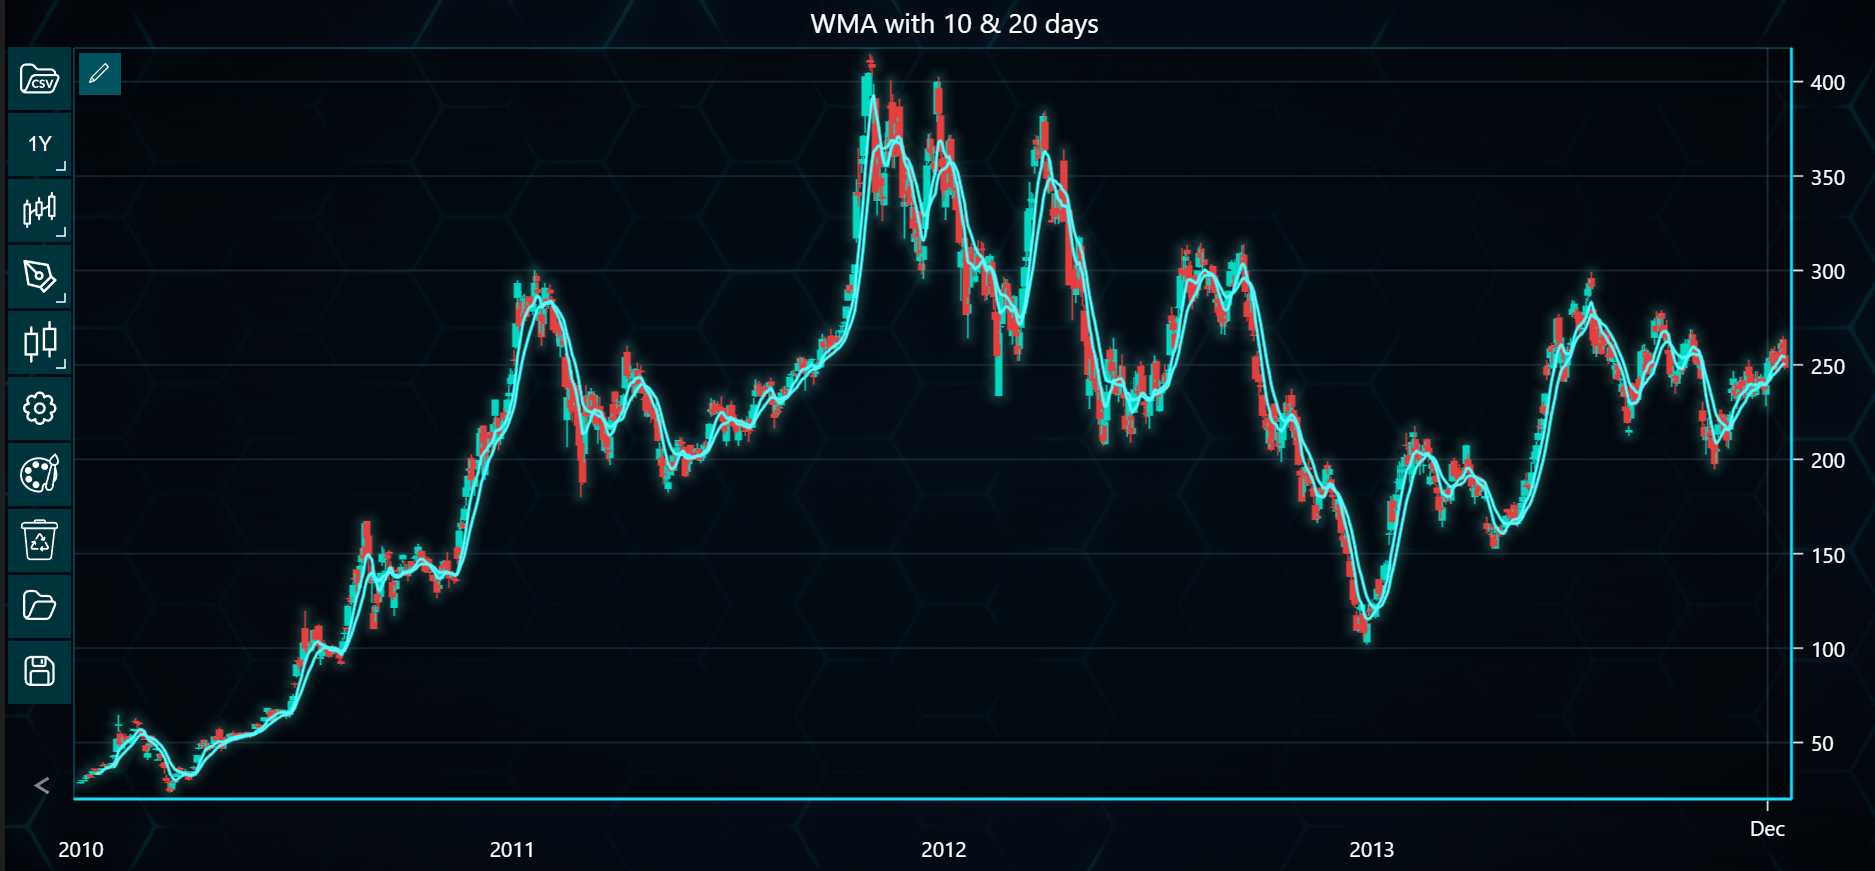
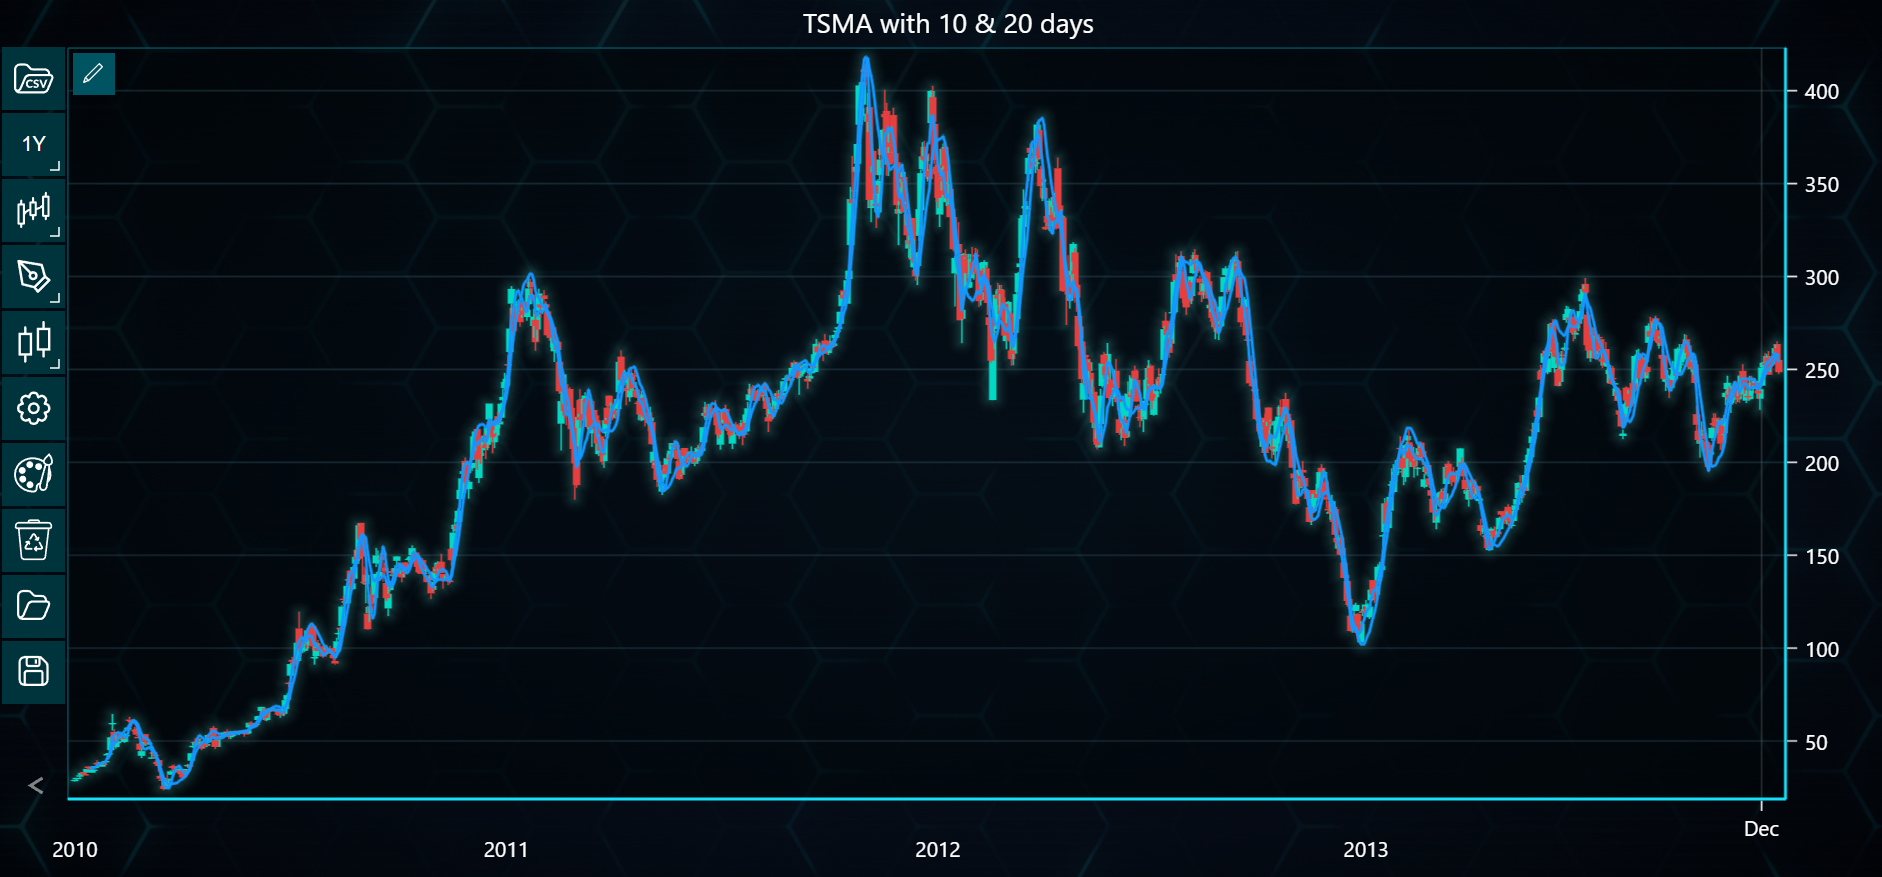
for indicator_name in ['SMA', 'EMA', 'WMA', 'TSMA', 'VIDYA', 'VMA', 'VWMA', 'WWS']:
# Initialize a new TAChart instance
CandleStick_chart = TAChart(license_key=license_key)
# Loading Tesla data from the CSV file
CandleStick_chart.load_csv(csv=DATA_PATH, dataset_name='Tesla Data')
# Set the chart type and title
CandleStick_chart.set_price_chart_type(chart_type)
CandleStick_chart.set_chart_title(f'{indicator_name} with {periods[0]} & {periods[1]} days')
# Add indicators with both periods
if indicator_name == 'SMA':
for period in periods:
CandleStick_chart.add_simple_moving_average(period_count=period)
elif indicator_name == 'EMA':
for period in periods:
CandleStick_chart.add_exponential_moving_average(period_count=period)
elif indicator_name == 'WMA':
for period in periods:
CandleStick_chart.add_weighted_moving_average(period_count=period)
elif indicator_name == 'TSMA':
for period in periods:
CandleStick_chart.add_time_series_moving_average(period_count=period)
elif indicator_name == 'VIDYA':
for period in periods:
CandleStick_chart.add_vidya(period_count=period)
elif indicator_name == 'VMA':
for period in periods:
CandleStick_chart.add_variable_moving_average(period_count=period)
elif indicator_name == 'VWMA':
for period in periods:
CandleStick_chart.add_volume_weighted_moving_average(period_count=period)
elif indicator_name == 'WWS':
for period in periods:
CandleStick_chart.add_welles_wilder_smoothing_average(period_count=period)
# Add chart instances to the list to prepare for display
CandleStick_charts.append(CandleStick_chart)
# Open charts
for chart in CandleStick_charts:
chart.open()
Using Bar Chart
from lightningchart_trader import TAChart

LICENSE_KEY_PATH = "license_key.txt"
DATA_PATH = "Tesla.csv"

# Load the license key
license_key = open(LICENSE_KEY_PATH).read()

# Defining chart type
chart_type = 'Bar'

# Defining periods for the moving averages
periods = [10, 20]

# List to hold chart instances for each chart
Bar_charts = []

# Creating a chart for each indicator
for indicator_name in ['SMA', 'EMA', 'WMA', 'TSMA', 'VIDYA', 'VMA', 'VWMA', 'WWS']:
    # Initialize a new TAChart instance
    Bar_chart = TAChart(license_key=license_key)

    # Loading Tesla data from the CSV file
    Bar_chart.load_csv(csv=DATA_PATH, dataset_name='Tesla Data')

    # Set the chart type and title
    Bar_chart.set_price_chart_type(chart_type)
    Bar_chart.set_chart_title(f'{indicator_name} with {periods[0]} & {periods[1]} days')

    # Add indicators with both periods
    if indicator_name == 'SMA':
        for period in periods:
            Bar_chart.add_simple_moving_average(period_count=period)
    elif indicator_name == 'EMA':
        for period in periods:
            Bar_chart.add_exponential_moving_average(period_count=period)
    elif indicator_name == 'WMA':
        for period in periods:
            Bar_chart.add_weighted_moving_average(period_count=period)
    elif indicator_name == 'TSMA':
        for period in periods:
            Bar_chart.add_time_series_moving_average(period_count=period)
    elif indicator_name == 'VIDYA':
        for period in periods:
            Bar_chart.add_vidya(period_count=period)
    elif indicator_name == 'VMA':
        for period in periods:
            Bar_chart.add_variable_moving_average(period_count=period)
    elif indicator_name == 'VWMA':
        for period in periods:
            Bar_chart.add_volume_weighted_moving_average(period_count=period)
    elif indicator_name == 'WWS':
        for period in periods:
            Bar_chart.add_welles_wilder_smoothing_average(period_count=period)

    # Add chart instances to the list to prepare for display
    Bar_charts.append(Bar_chart)

# Open charts
for chart in Bar_charts:
    chart.open()