v1.2.0
Kagi, Renko and Point&Figure Charts
In the example below, you can explore how to create Kagi, Renko, and Point-and-Figure charts using the LightningChart Python Trader. Full code and dataset are provided at the bottom of the page.
from lightningchart_trader import TAChart
LICENSE_KEY_PATH = "license_key.txt"
DATA_PATH = "Tesla.csv"
# Load the license key
license_key = open(LICENSE_KEY_PATH).read()
# Initialize the TAChart
kagi_chart = TAChart(license_key=license_key)
# Load data and set the chart type to Renko
kagi_chart.load_csv(csv=DATA_PATH)
kagi_chart.set_price_chart_type('Kagi')
kagi_chart.set_chart_title('Kagi')
# Access the Renko instance
kagi = kagi_chart.get_kagi_instance()
# Customize the Renko settings
kagi.set_reversal(2.0)
kagi.set_atr_period_count(14)
kagi.set_kagi_base_type(0) # Close
kagi.set_line_width(3.0)
kagi.set_thick_line_color('#FF5733') # Red
kagi.set_thin_line_color('#33FF57') # Green
# Modify the Kagi settings
kagi_2 = kagi_chart.get_kagi_instance()
kagi_2.set_reversal(4.0)
kagi_2.set_atr_period_count(7)
kagi_2.set_kagi_base_type(3) # High
kagi_2.set_line_width(2.0)
kagi_2.set_thick_line_color('#FF5733') # Red
kagi_2.set_thin_line_color('#33FF57') # Green
# Initialize the TAChart
point_and_figure_chart = TAChart(license_key=license_key)
# Load data and set the chart type to Renko
point_and_figure_chart.load_csv(csv=DATA_PATH)
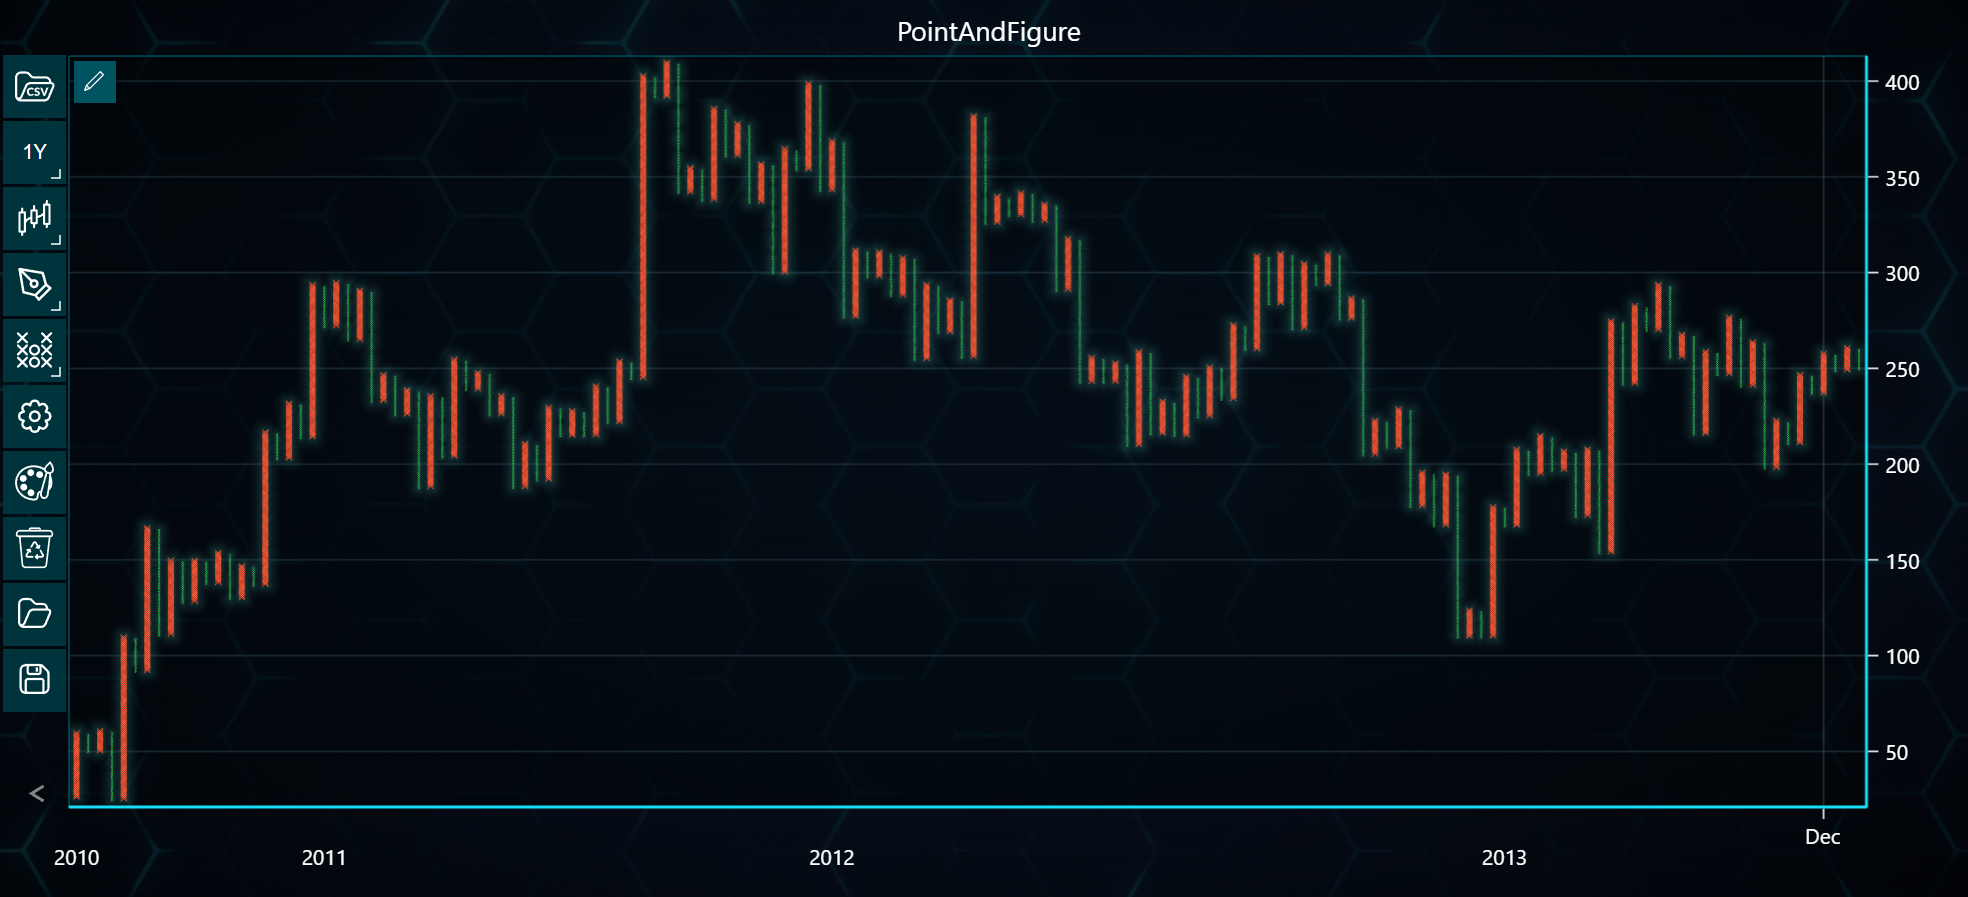
point_and_figure_chart.set_chart_title('PointAndFigure')
# Set the chart type to Point-and-Figure
point_and_figure_chart.set_price_chart_type('PointAndFigure')
# Access the Renko instance
point_and_figure = point_and_figure_chart.get_point_and_figure_instance()
# Customize the Point-and-Figure settings
point_and_figure.set_box_size(1)
point_and_figure.set_reversal_amount(3)
point_and_figure.set_atr_period_count(14)
point_and_figure.set_x_color('#FF5733') # Orange color for X
point_and_figure.set_o_color('#33FF57') # Green color for O
point_and_figure.set_point_and_figure_base_type(3) # Use ATR base type
# Initialize the TAChart
renko_chart = TAChart(license_key=license_key)
# Load data and set the chart type to Renko
renko_chart.load_csv(csv=DATA_PATH)
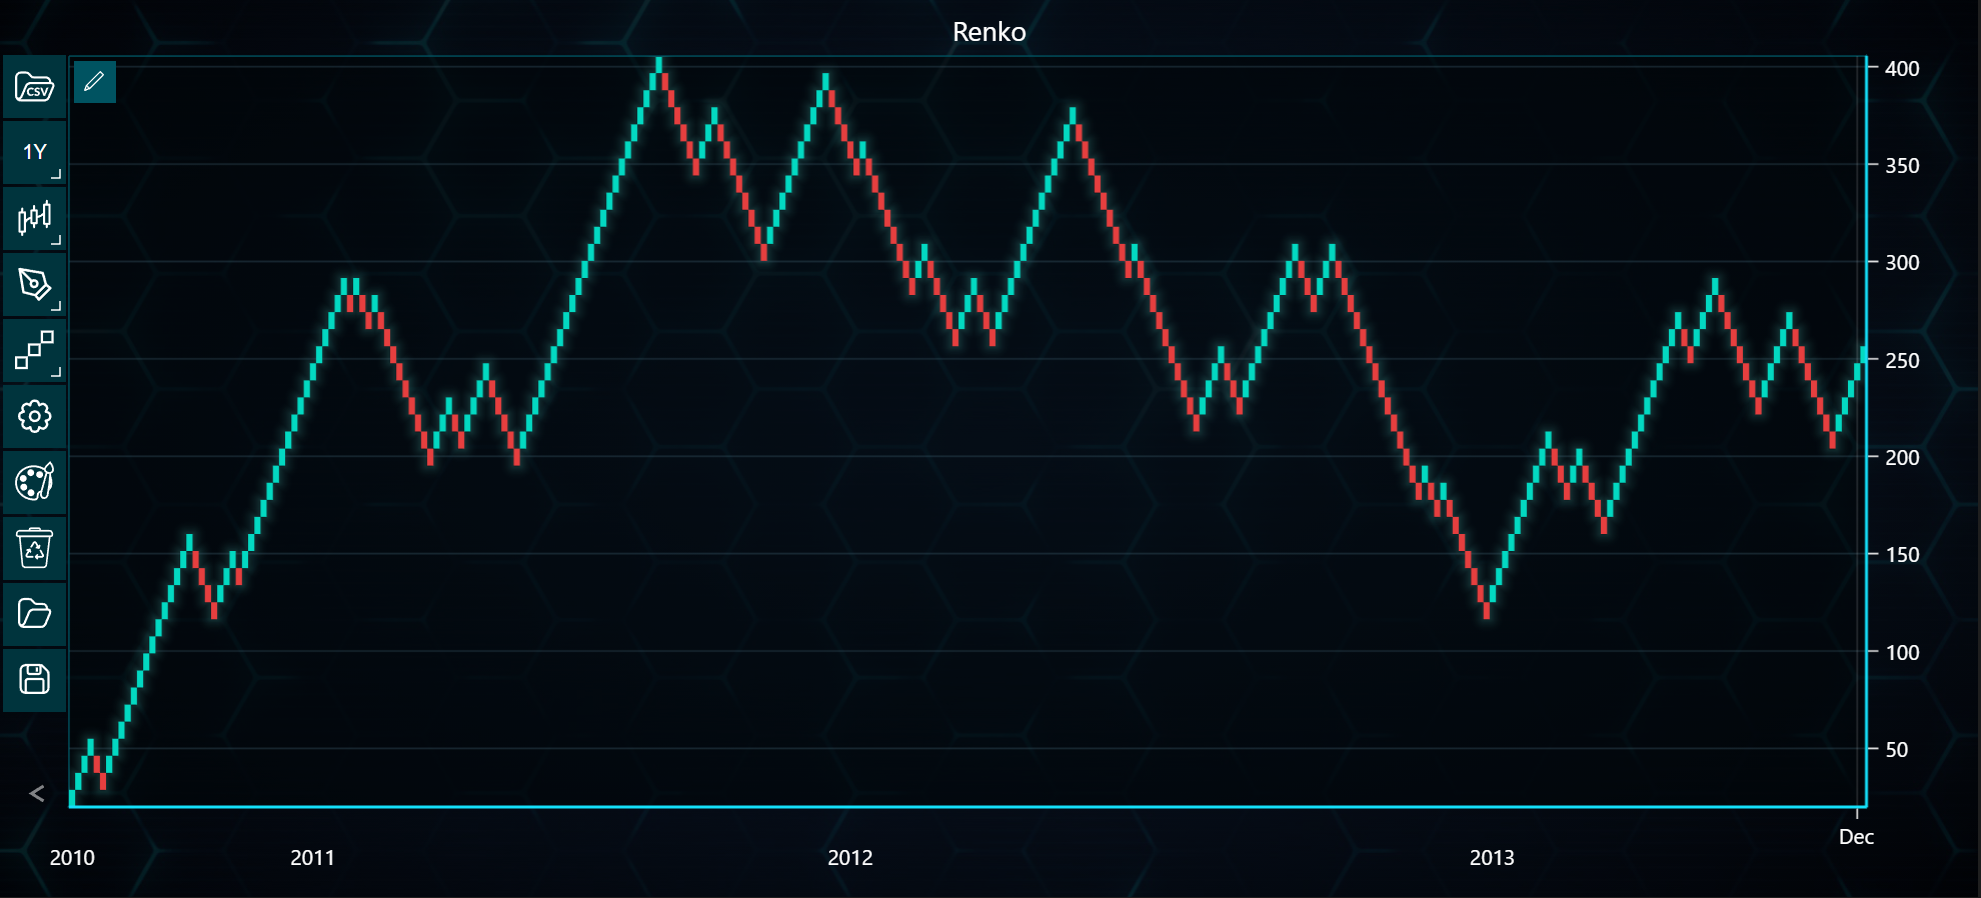
renko_chart.set_chart_title('Renko')
renko_chart.set_price_chart_type('Renko')
# Access the Renko instance
renko = renko_chart.get_renko_instance()
# Customize Renko-specific settings
renko.set_box_size(4)
renko.set_renko_base_type(3)
renko.set_atr_period_count(14)
renko_chart.open()
point_and_figure_chart.open()
kagi_chart.open()